







Home improvement spending September 2026 needs a closer look than the broad construction headline. Private residential spending fell 5.5% from revised August levels. Yet the published new single-family and multifamily components barely changed. Subtracting those components from the total produces an improvements residual that fell about 13.0%. That calculation changes the question: which part of residential work weakened, and what does the dollar measure actually describe?
Research date: November 7, 2026. Source: Census release CB26-176, published November 2. Figures below use one release vintage: September preliminary and August revised. Dollar rates are nominal and seasonally adjusted at annual rates, unless explicitly stated otherwise.
Home improvement spending September 2026: reconstruct the components
The Census construction-spending announcement gives the overall private residential decline. Table 1 in the dated release PDF provides the components needed to explain it. Its footnote includes private residential improvements in the total, although the table does not print a separate improvements row.
| Component | August, revised | September, preliminary | Change |
|---|---|---|---|
| Private residential total | 897,995 | 848,777 | −49,218 |
| New single-family | 403,477 | 403,436 | −41 |
| New multifamily | 115,814 | 115,888 | +74 |
| Improvements residual, calculated | 378,704 | 329,453 | −49,251 |
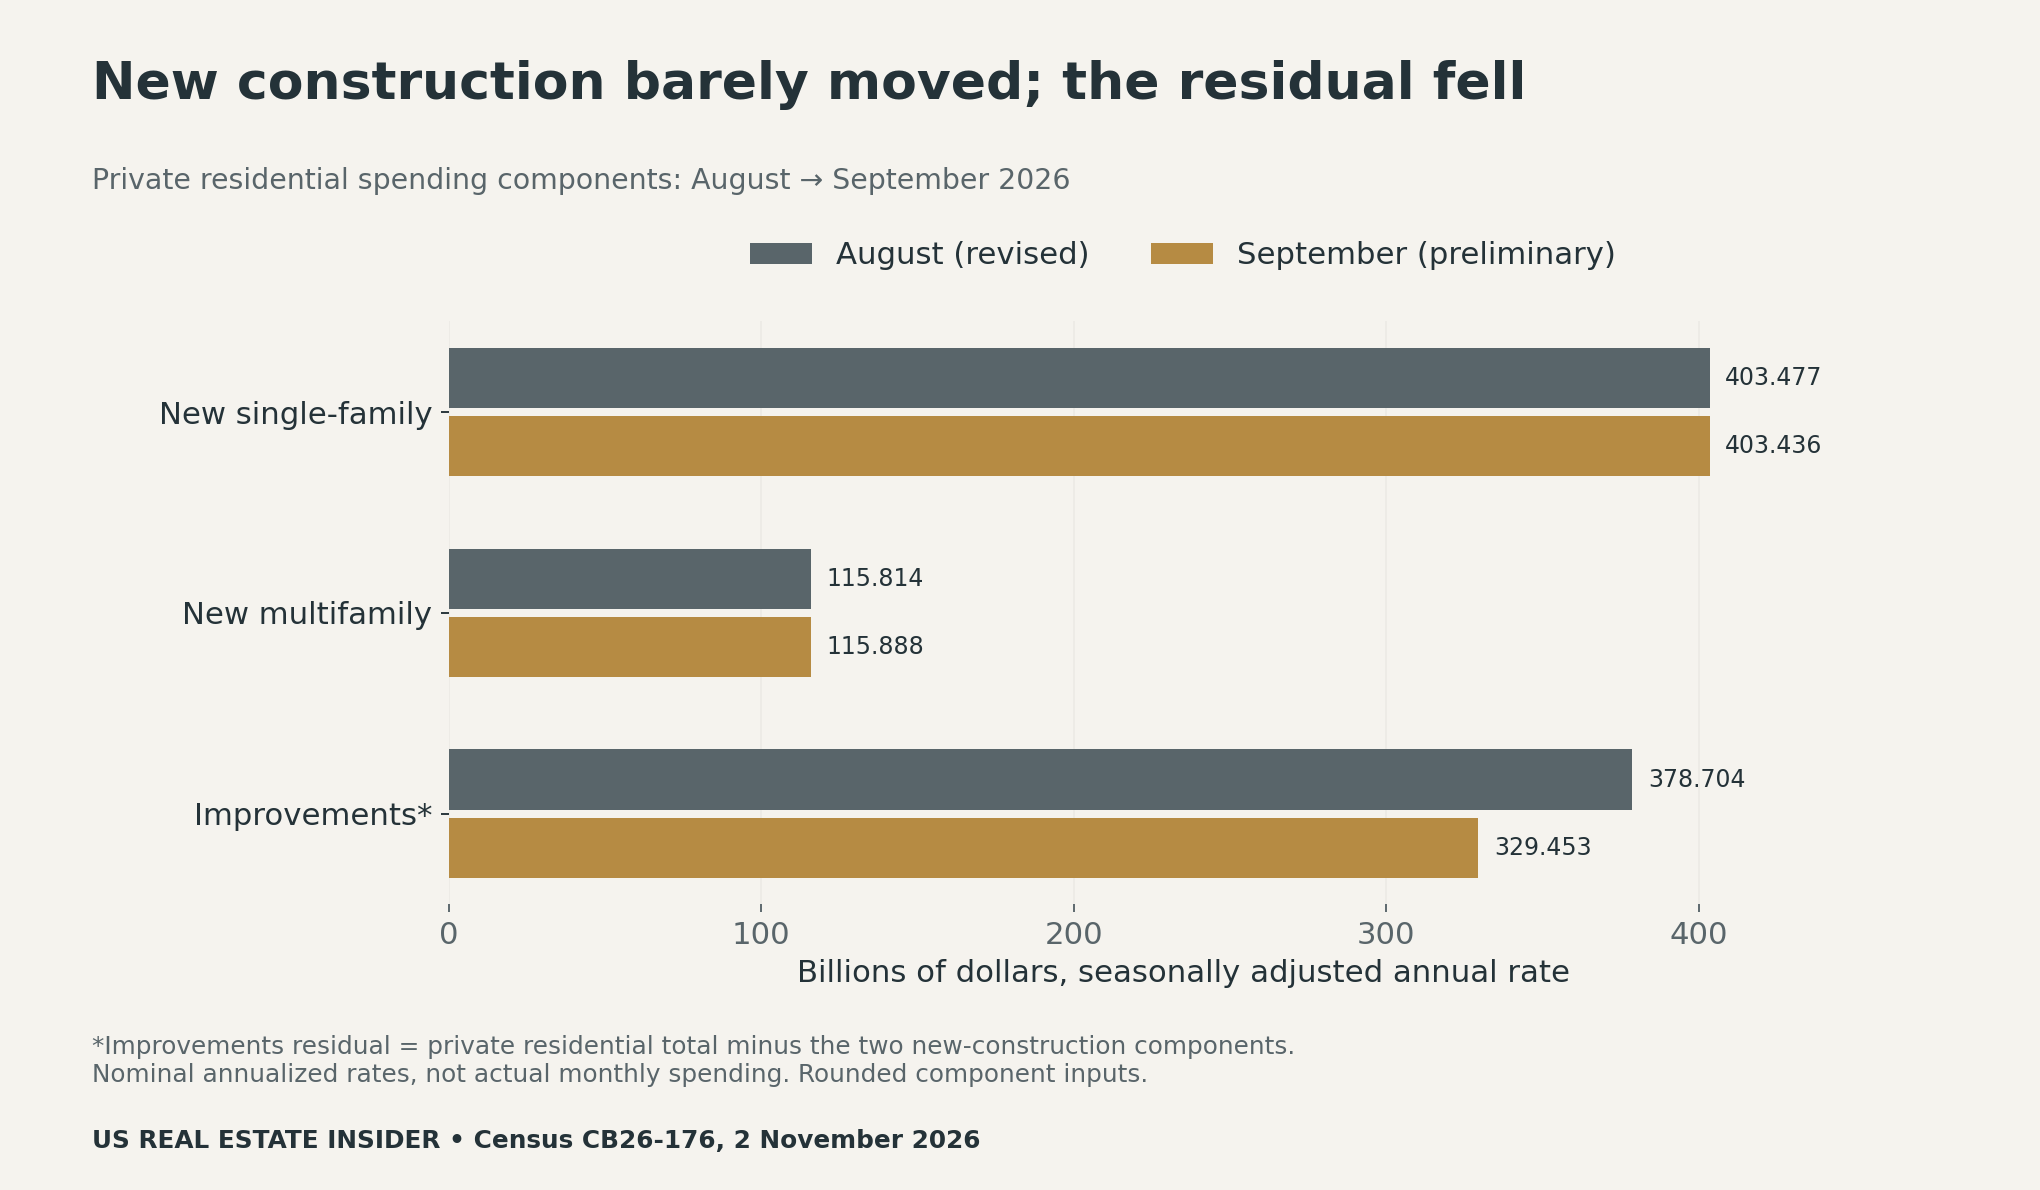
For August, the subtraction is 897,995 − 403,477 − 115,814 = 378,704. For September, it is 848,777 − 403,436 − 115,888 = 329,453. The unit remains millions of dollars at an annual rate throughout. We label the result a derived improvements residual because it comes from this subtraction, rather than a separately quoted headline estimate.
The percentage change uses the August residual as its denominator: (329,453 ÷ 378,704 − 1) × 100 ≈ −13.0%. This differs from the headline 5.5% decline, which uses the larger private residential total. A component and its parent total can therefore have different growth rates without either calculation being inconsistent.
Reconcile the decline before interpreting it
The two new-construction changes sum to −41 + 74 = +33 million at an annual rate. Add the residual change of −49,251 million, and the bridge reaches the total change of −49,218 million exactly, using the printed inputs. The residual decrease is slightly larger than the net total decline because the small new-construction increase offsets part of it.
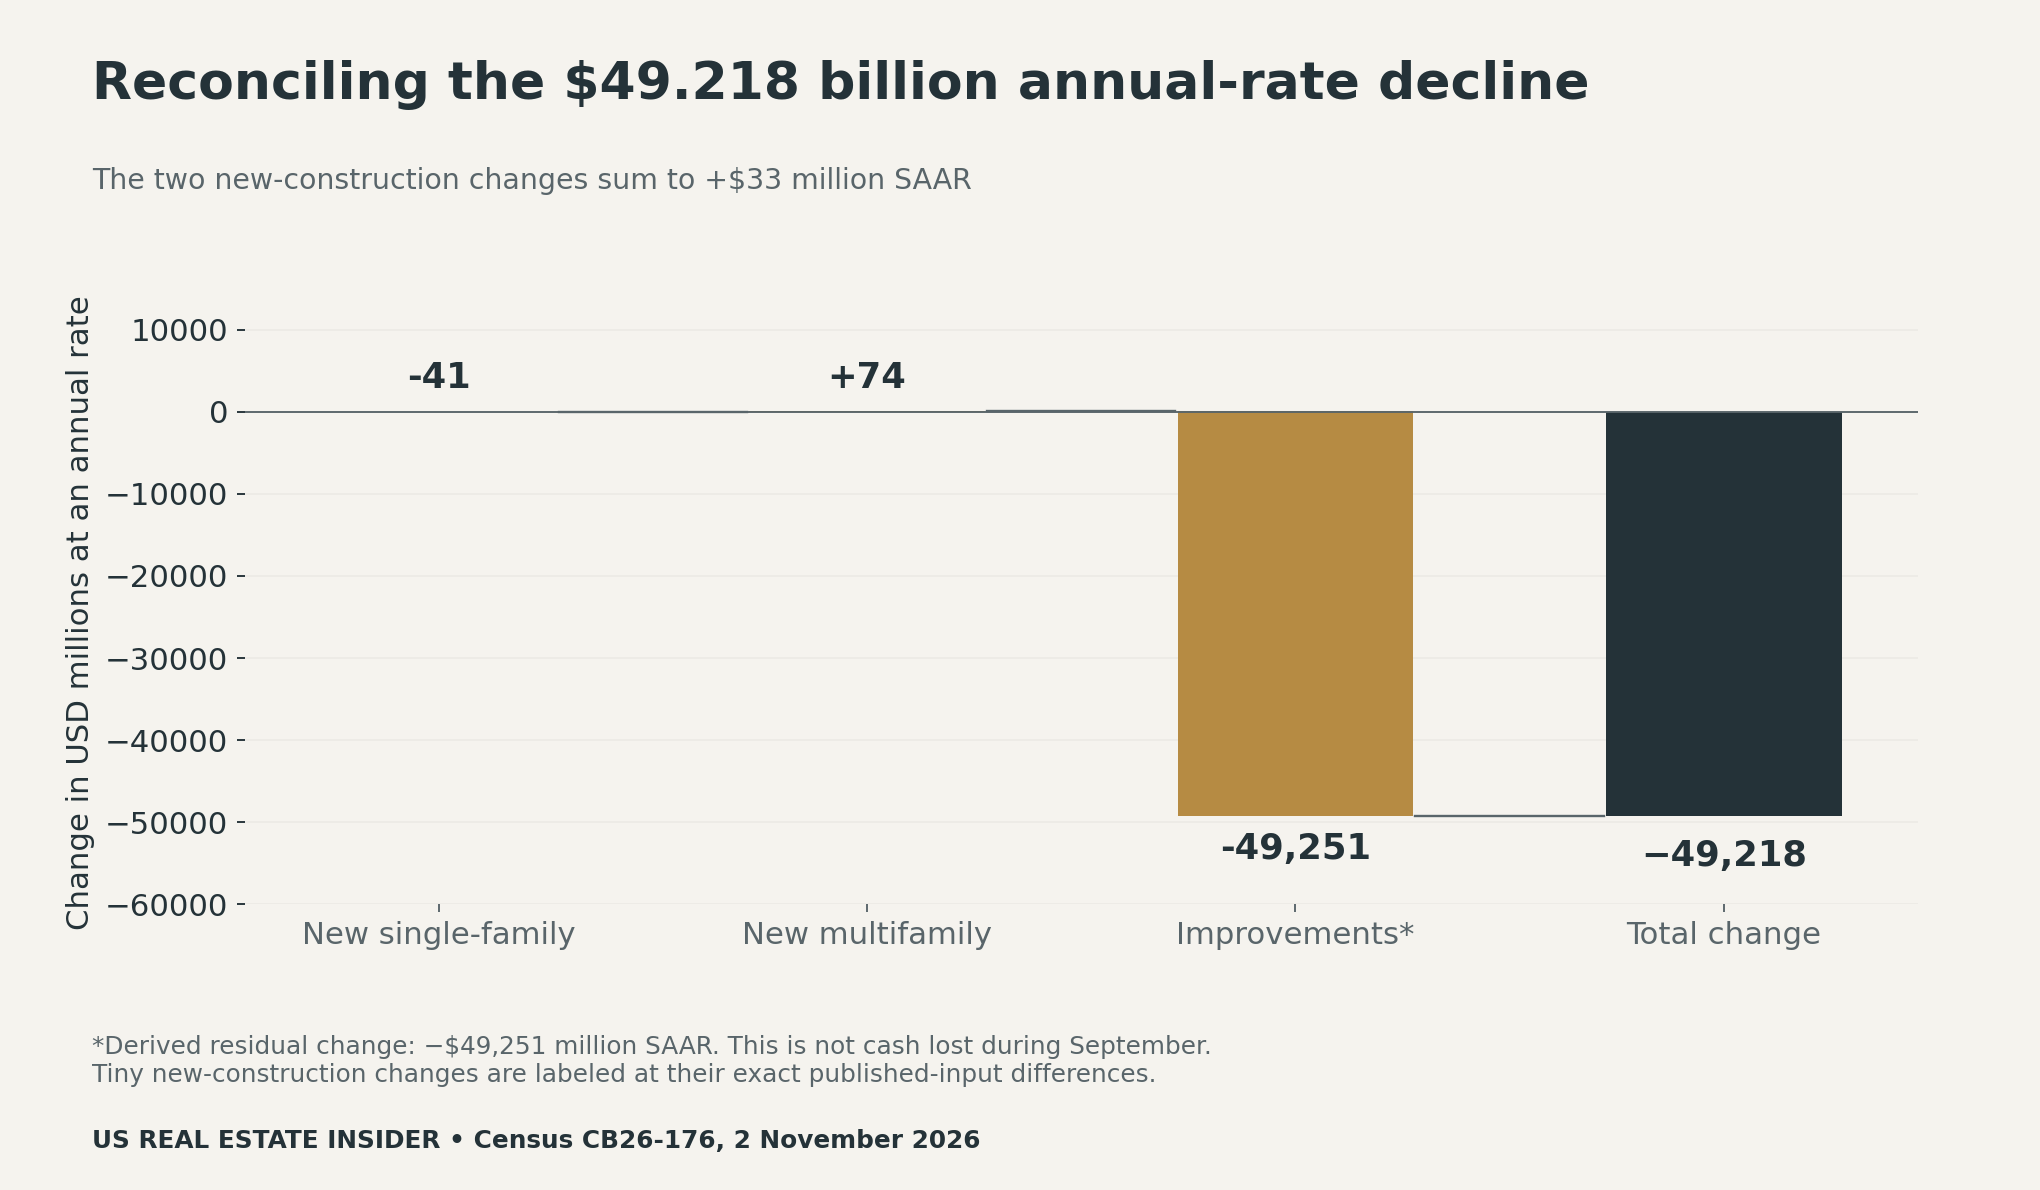
This is an accounting reconciliation, not a causal model. It locates a change within the published categories. It does not establish whether financing costs, project timing, household choices or another factor caused that movement. Likewise, a national residual cannot identify which local businesses gained or lost work.
Composition is another useful view
The derived improvements residual represented about 42.17% of the private residential total in August and 38.82% in September. These shares answer a composition question. They do not describe the share of construction firms, workers, homes or individual renovation projects. The denominator is a dollar rate in each month.
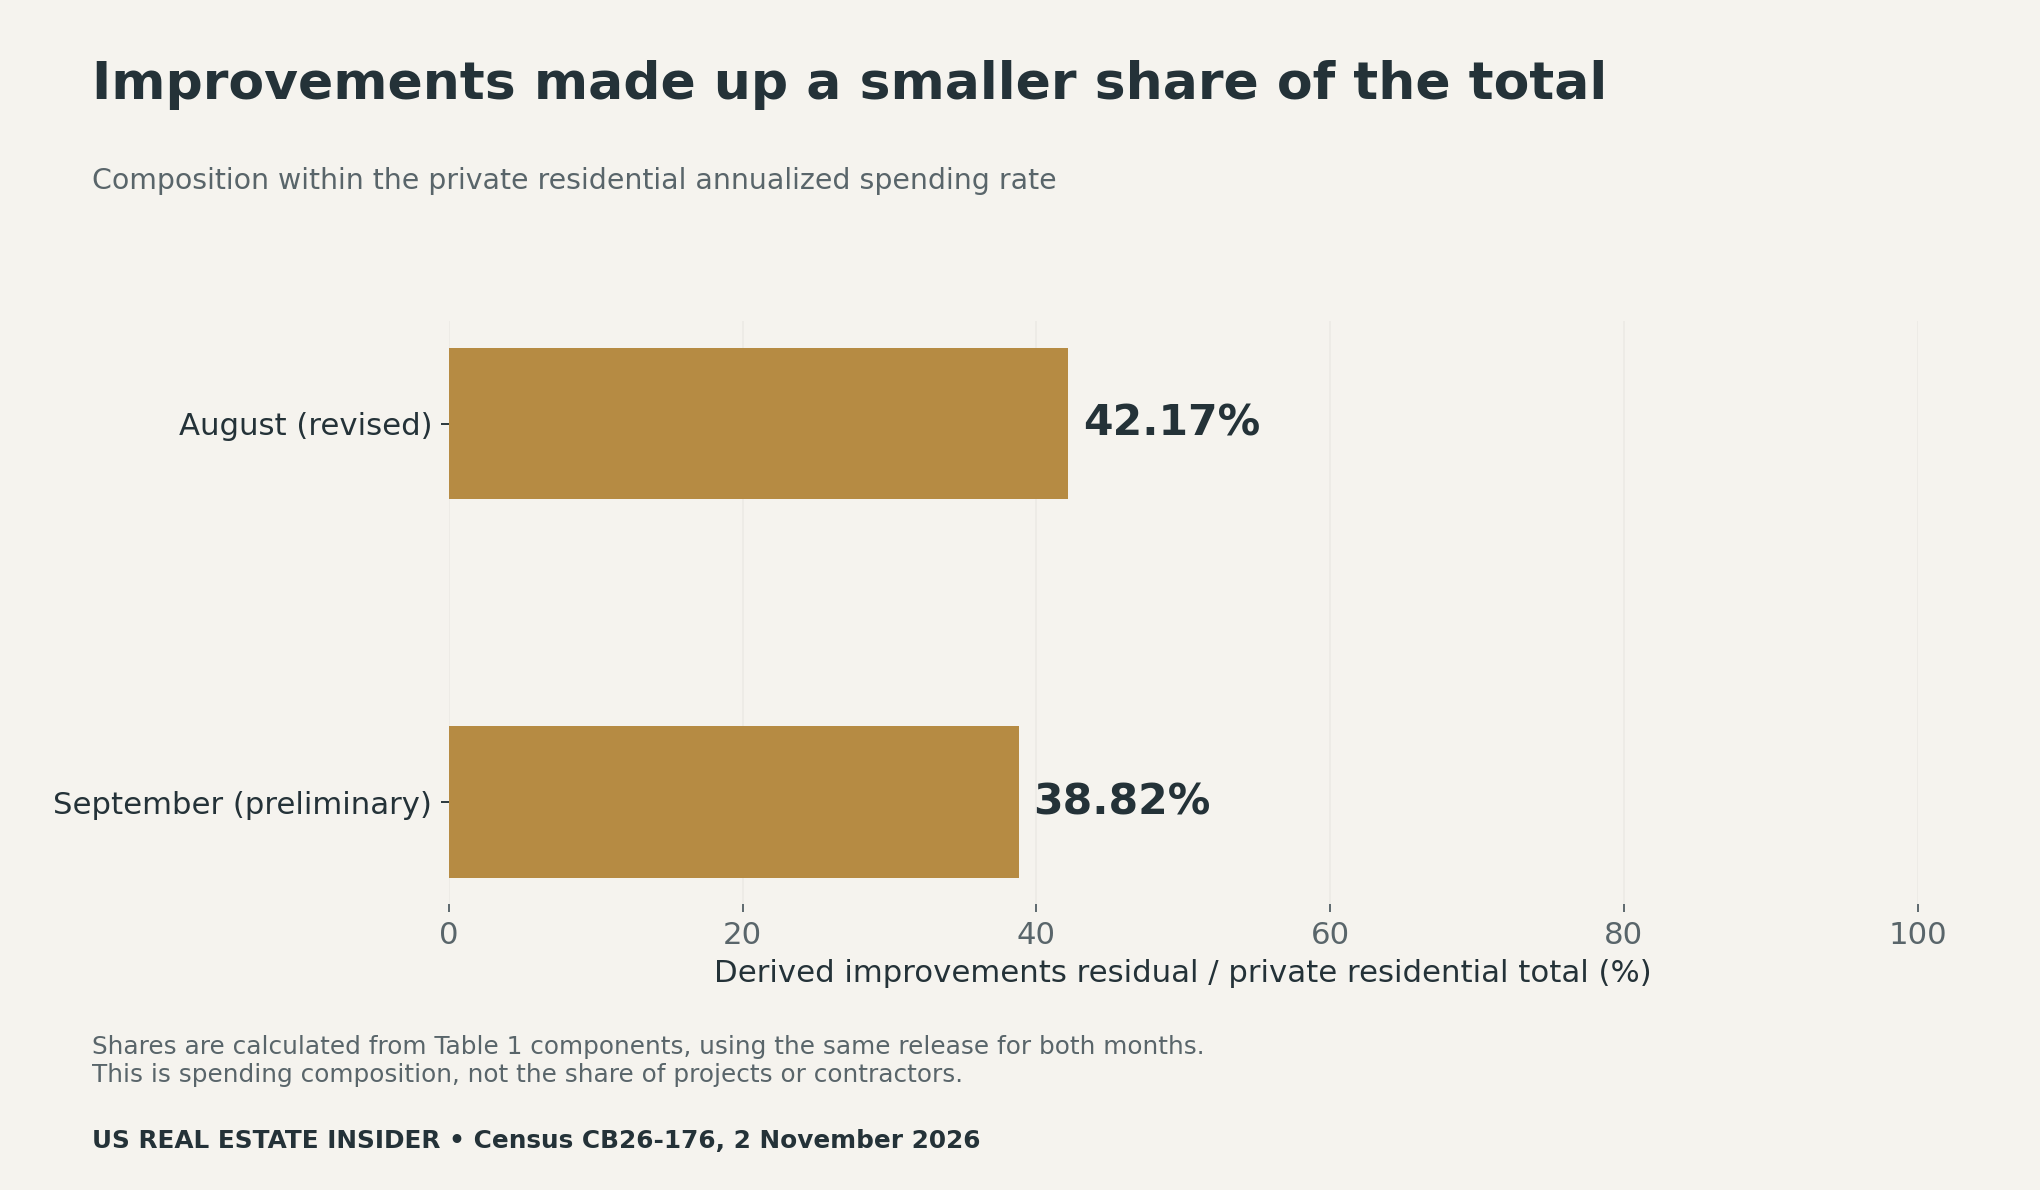
A renovation reader can use the composition view to avoid a common shortcut. A falling residential total does not mean every segment fell at that same rate. Before applying a headline to your own project, identify the relevant category and then check whether the evidence is national, local or property-specific.
Annualized spending is not monthly cash or housing starts
Census measures the value of construction work put in place. The official definitions explain which work and costs belong in that measure. Improvements include qualifying remodeling, additions and major replacements to owner-occupied property; routine maintenance and repair are excluded. Our residual therefore does not represent the entire remodeling-and-repair industry.
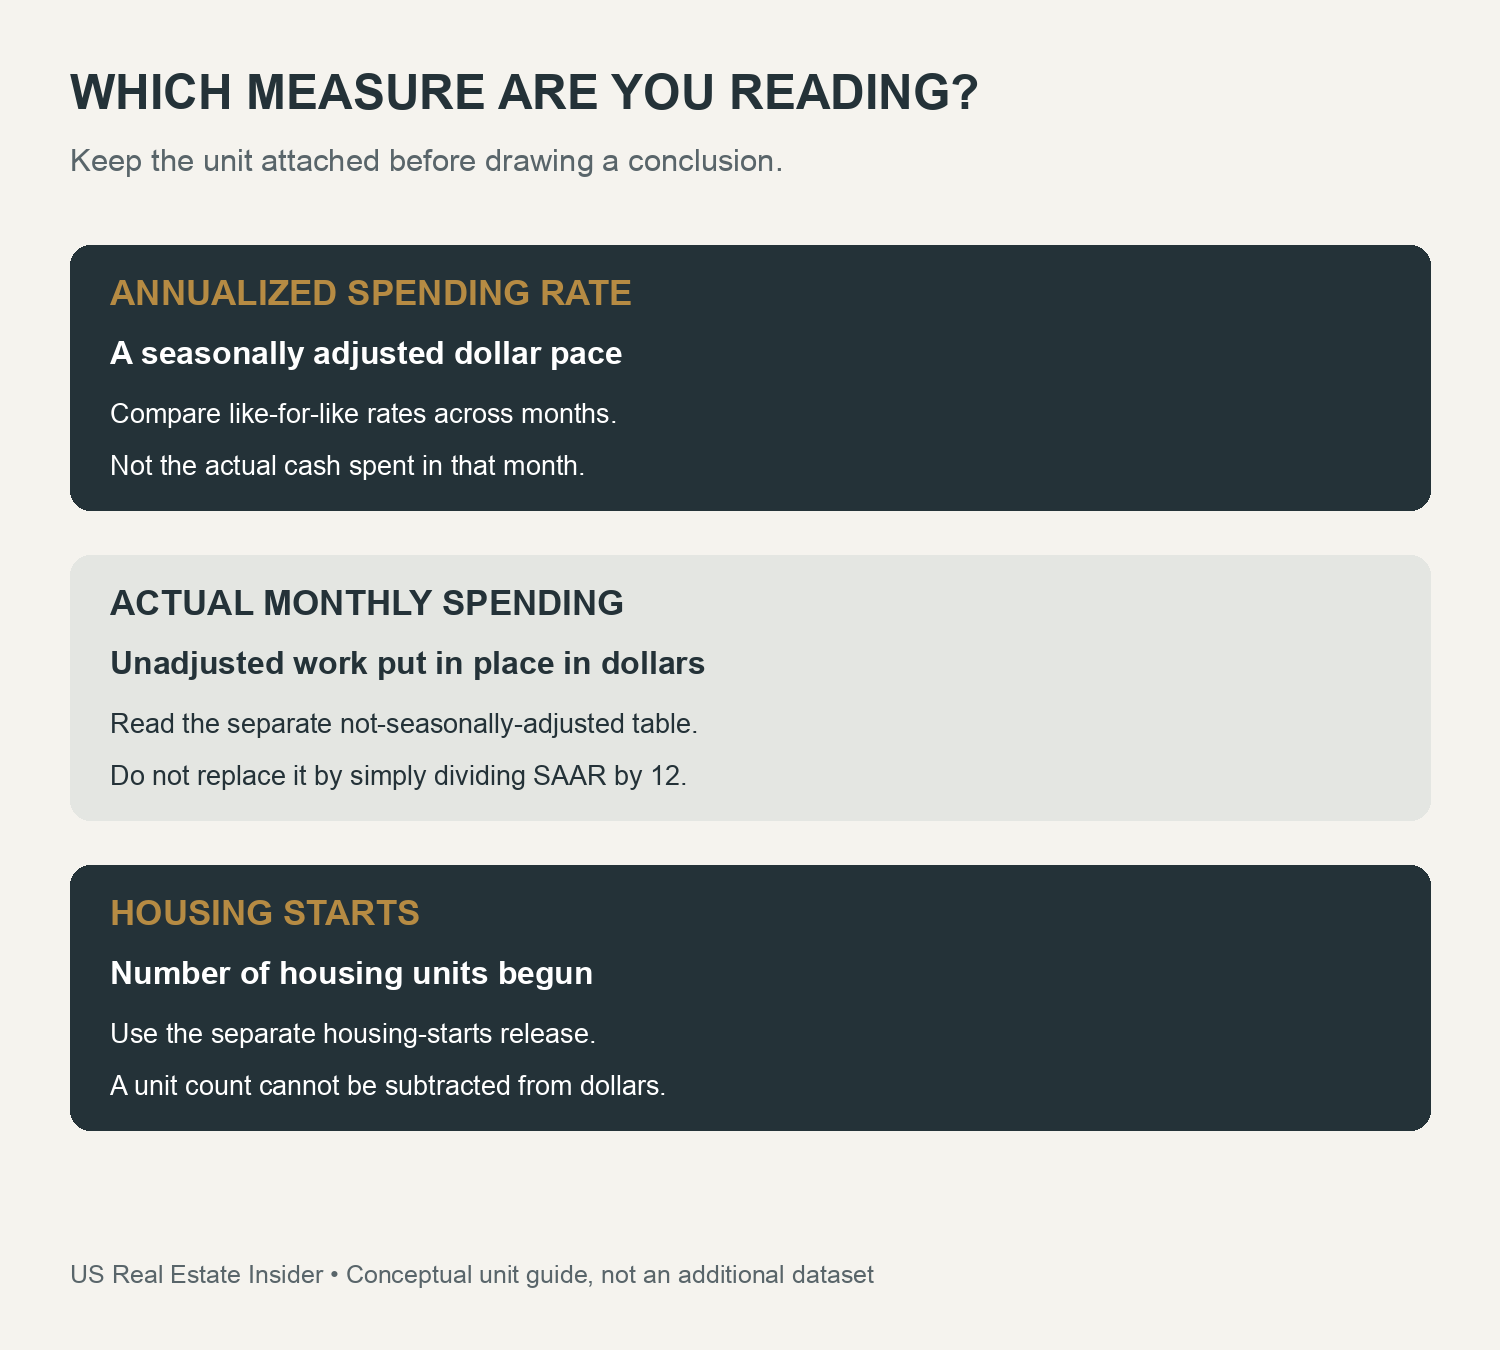
An annualized rate expresses a pace after seasonal adjustment. It is not a forecast of the next twelve months. Nor is the $49.251 billion residual decline money literally lost during September. Dividing an annualized figure by twelve also does not recover the separate unadjusted monthly estimate, because seasonal adjustment changes the comparison. Use the appropriate table for the question you want to answer.
Housing starts are different again: they count units begun. Our housing-supply pipeline analysis examines construction stages. Check the dates and definitions there before comparing its unit counts with these dollar rates. A count cannot be subtracted from a spending amount.
Uncertainty and revisions limit the conclusion
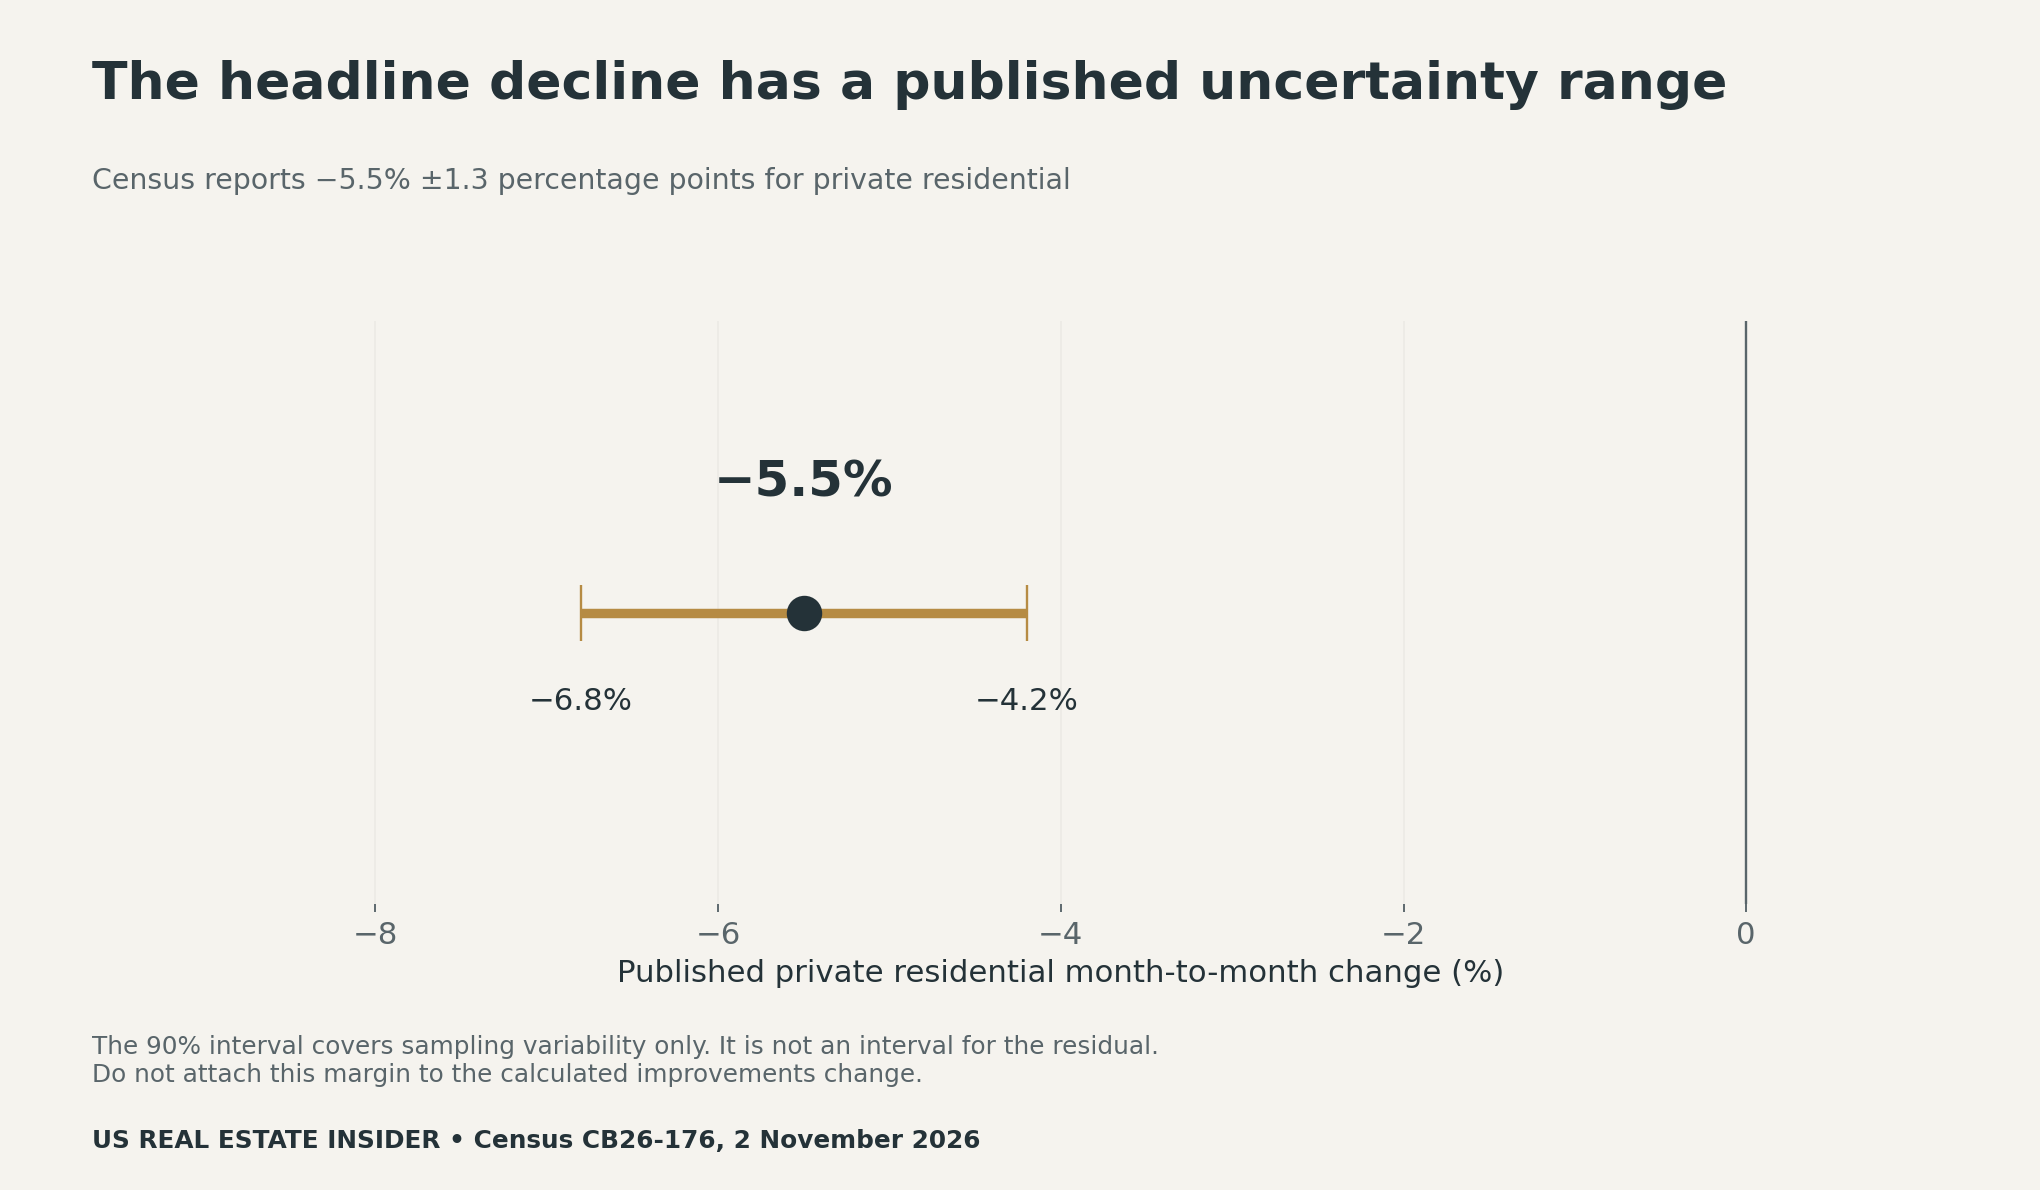
Census reports the headline private residential change as −5.5%, with a margin of ±1.3 percentage points. The release explains that this is a 90% confidence range for sampling variability. It excludes zero, but it does not capture every possible source of error. It also does not establish a permanent trend from one month.
The Census methodology describes distinct data sources for improvements and new construction. The estimates are not a simple tally of the same invoices. September is preliminary, and August is already revised. Later releases may revise both levels and the residual calculated from them. Our downloads retain the release identifier so the arithmetic remains reproducible even when the current-release URLs change.
Use the evidence without turning it into a contractor quote
If you are planning a renovation, collect current quotes for a consistent written scope. Record material specifications, labor, permit requirements, exclusions and timing. Compare those project-level facts with your budget. A national spending decline does not tell you that a particular contractor should be cheaper, that local labor is plentiful or that a project will pay for itself.
Our builder cancellation-rate guide offers a related lesson about denominators and personal outcomes. The first-time buyer survey analysis similarly separates a national description from an individual decision. Use each dataset within its own scope.
Download the inputs, bridge and audit tools
These four original CSV files open in common spreadsheet software. Published values, derived arithmetic and blank planning fields are explicitly labeled. Retain the source date when you reuse a number or reproduce a chart.
- Component inputs and calculated residuals (CSV)
- Annual-rate change reconciliation (CSV)
- Release and revision log (CSV)
- Blank construction-data reading worksheet (CSV)
To reproduce the study, subtract the two new-construction inputs from the total for each month. Compare the two residuals, divide that change by the August residual, and reconcile the three component changes to the total. Keep the same release vintage and unit throughout. No microdata, local price model or causal estimate was used.
Suggested citation: US Real Estate Insider, “Home Improvement Spending September 2026: Unpacking the Residential Drop,” November 7, 2026. Original component reconciliation using Census release CB26-176, November 2, 2026. The improvements residual is derived from Table 1; dollar values are nominal seasonally adjusted annual rates.


