




A homebuilder cancellation rate, explained through its denominator, describes a period ratio rather than a contract outcome. D.R. Horton’s reported 23% cancellation rate does not establish that a newly signed buyer has a 77% chance of closing. Subtracting the headline from 100% cannot supply that probability.
This guide separates the company’s reporting from an original, auditable teaching ledger. It shows how cancellations and closings can come from different signing cohorts. Then it provides a reporting dictionary and a blank milestone sheet for checking actual contract evidence.
Read the dated company result
In its 29 October 2026 earnings release filed with the SEC, D.R. Horton reports a 23% cancellation rate for the quarter ended 30 September, compared with 20% a year earlier. It defines the measure as cancelled sales orders divided by gross sales orders.
The same release reports 18,619 quarterly net orders, down 7%, and 22,915 homes closed, down 2%. For the fiscal year, the cancellation rate was 19%, compared with 18%. These are one builder’s reporting windows, not an industry-wide rate.
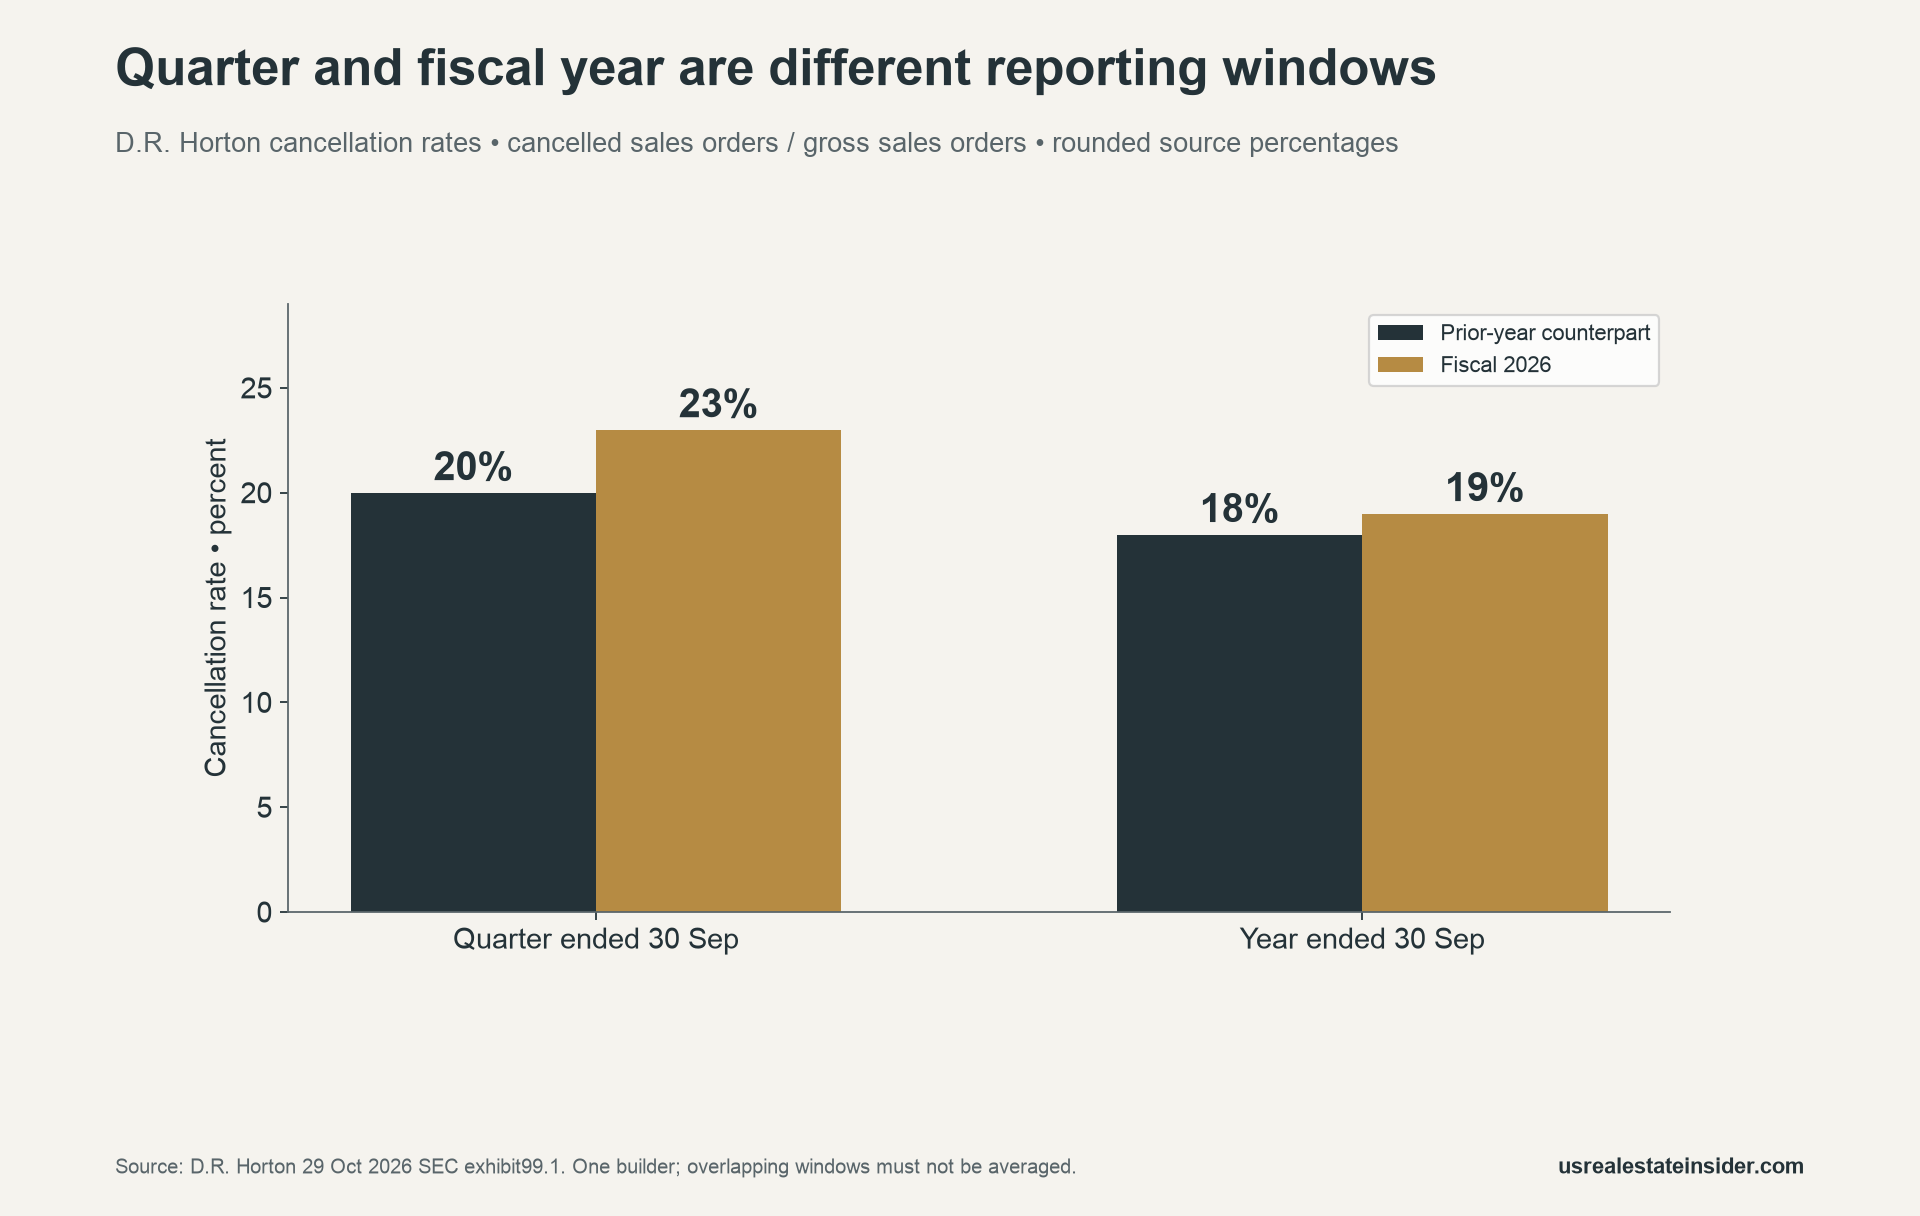
The annual window includes the quarter, so the two percentages should not be averaged together. Also, the 23% figure is rounded. We do not reverse-engineer an exact official gross-order count from that percentage and the net-order total.
Homebuilder cancellation rate explained through definitions
Gross orders record new orders in a period. Cancellations record orders cancelled in that period, including contracts that may have been signed earlier. Net orders subtract cancellations from gross orders under the reporting identity used in our teaching example. Closings count completions recorded during the period.
A cohort asks a different question. It follows a defined set of contracts from their signing dates to later outcomes. To study a signing cohort properly, retain its starting population, observation cutoff and unresolved contracts instead of replacing them with another period’s totals.
| Measure | Question | What to retain |
|---|---|---|
| Period cancellation ratio | How many cancellations relative to gross orders recorded in this window? | Definition, numerator, denominator and dates |
| Net-order flow | What remains after period cancellations are deducted? | Gross orders and cancellations |
| Closing count | How many completed in this window? | Completion date and signing cohort if available |
| Cohort status | What happened to this defined set of signings by a cutoff? | Closed, cancelled and unresolved outcomes |
Reproduce an illustrative reporting quarter
Our invented ledger begins with ten open contracts signed in June. Twenty more are signed in July. During July through September, four older contracts and two new contracts cancel. Six older contracts and four new contracts close. The remaining fourteen new contracts stay open at 30 September.
These thirty anonymous records are not D.R. Horton customer data. They are constructed to make the distinction auditable. Each row contains a synthetic contract identifier, signing date, outcome date where applicable and observation cutoff.
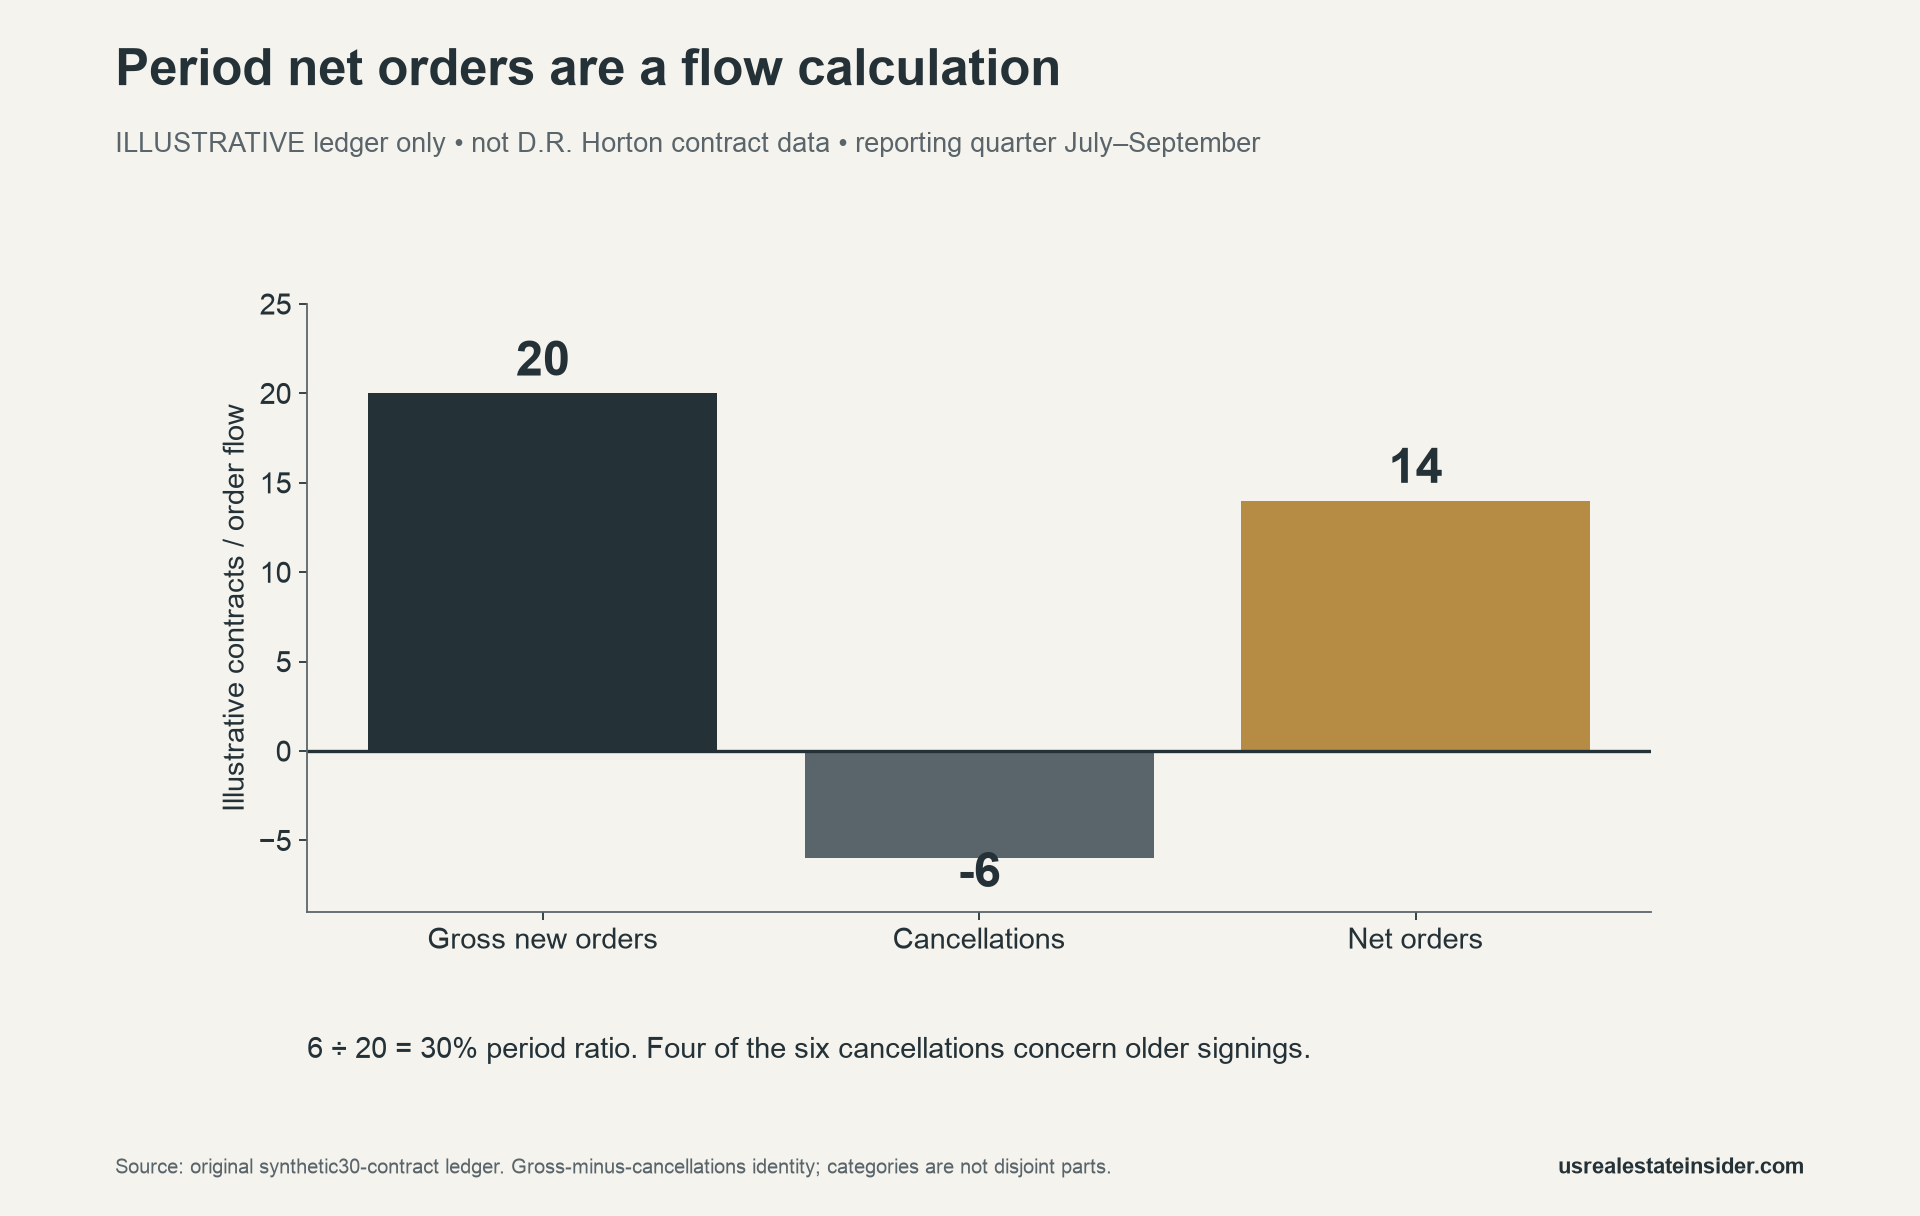
The period has twenty gross new orders and six cancellations. Therefore, its illustrative cancellation ratio is 6 ÷ 20 = 30%, while net orders are 20 − 6 = 14. Four cancellations concern contracts signed before the quarter began.
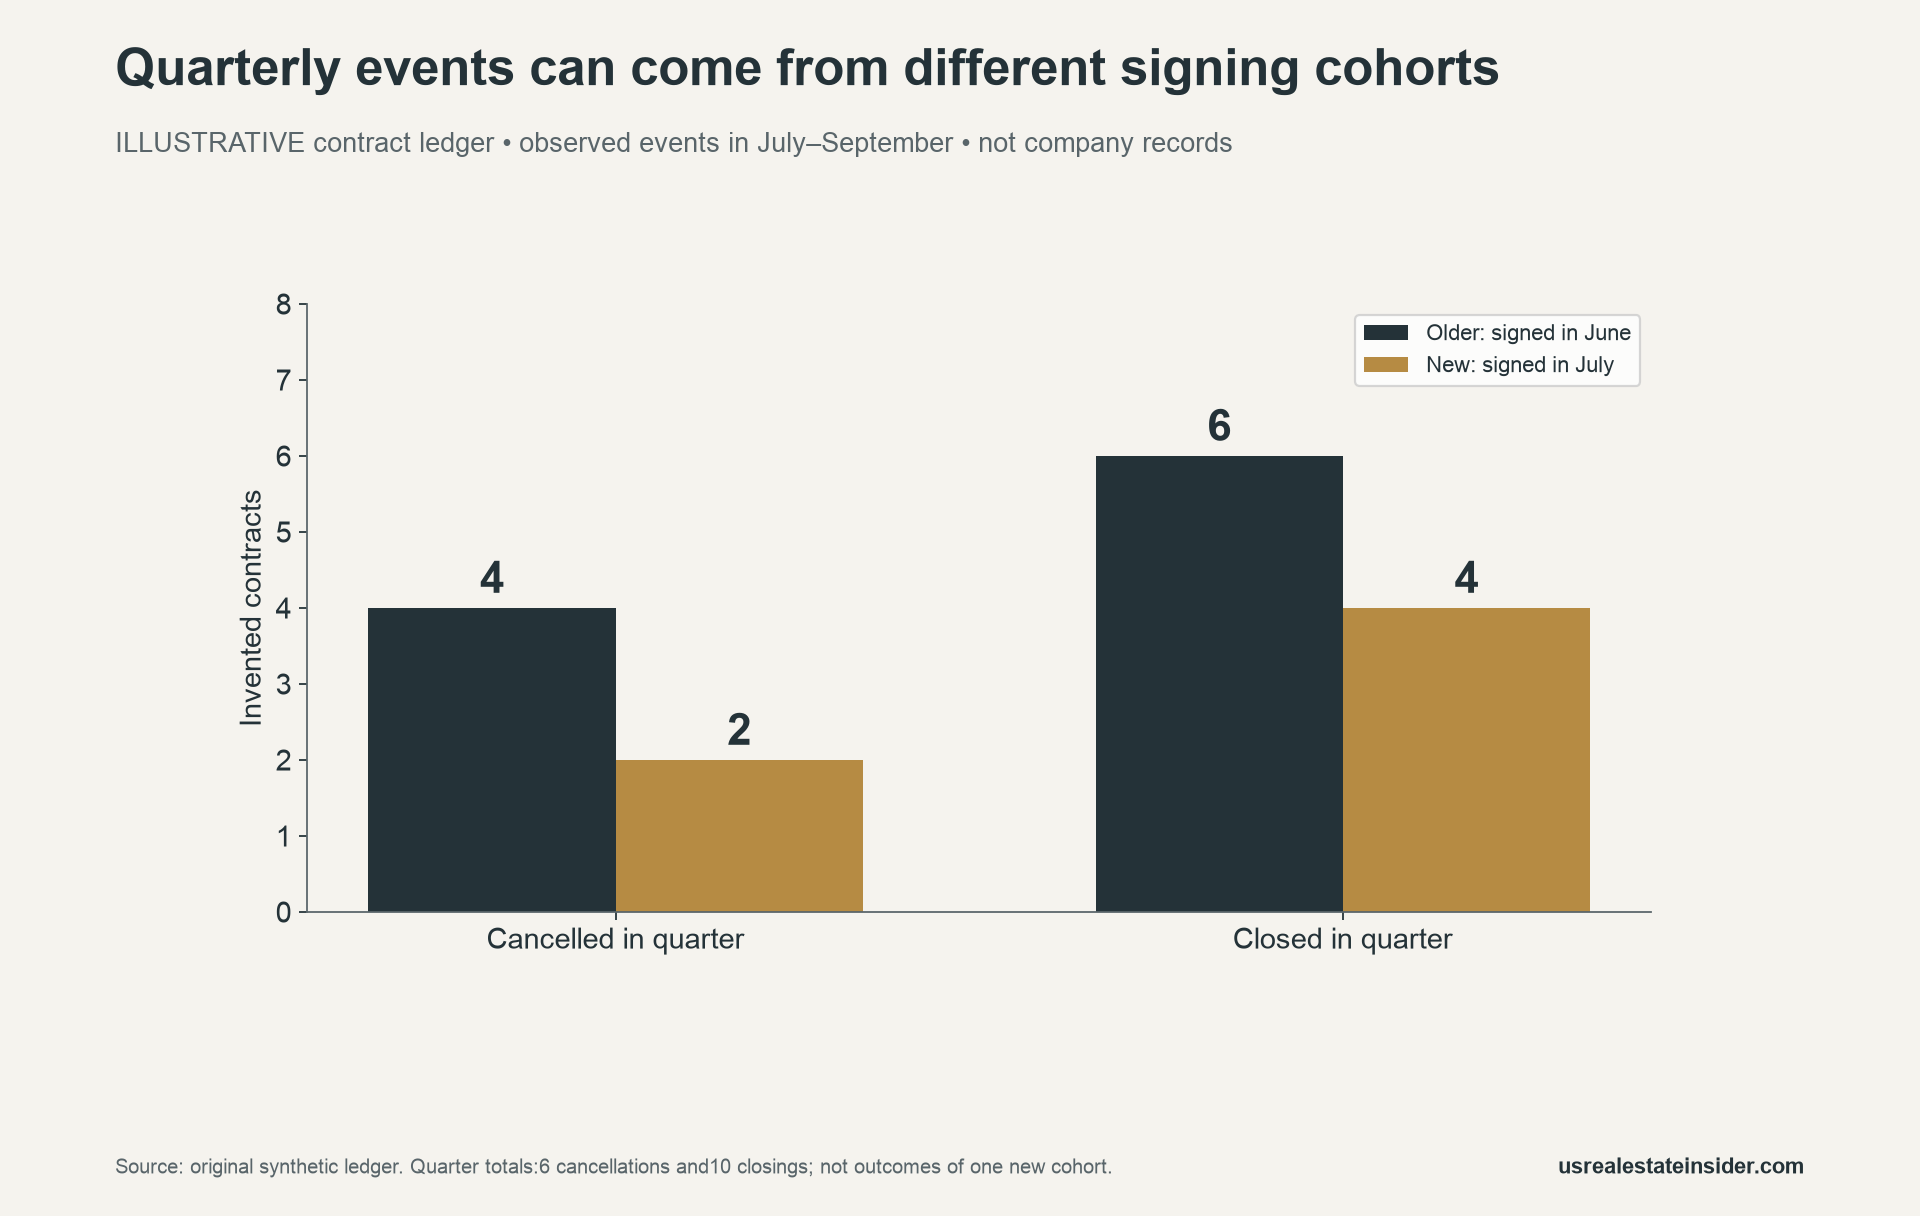
Ten contracts close during the quarter, but only four belong to the new signing cohort. A check on the full ledger gives beginning backlog 10 + net orders 14 − closings 10 = ending backlog 14. These identities verify the teaching dataset, not a company’s customer outcomes.
Follow the new signing cohort separately
Among the twenty July signings, two have cancelled, four have closed and fourteen remain open at the cutoff. The observed cancellation status is 10%, and the observed closing status is 20%. Neither is a final lifetime outcome because most contracts remain unresolved.
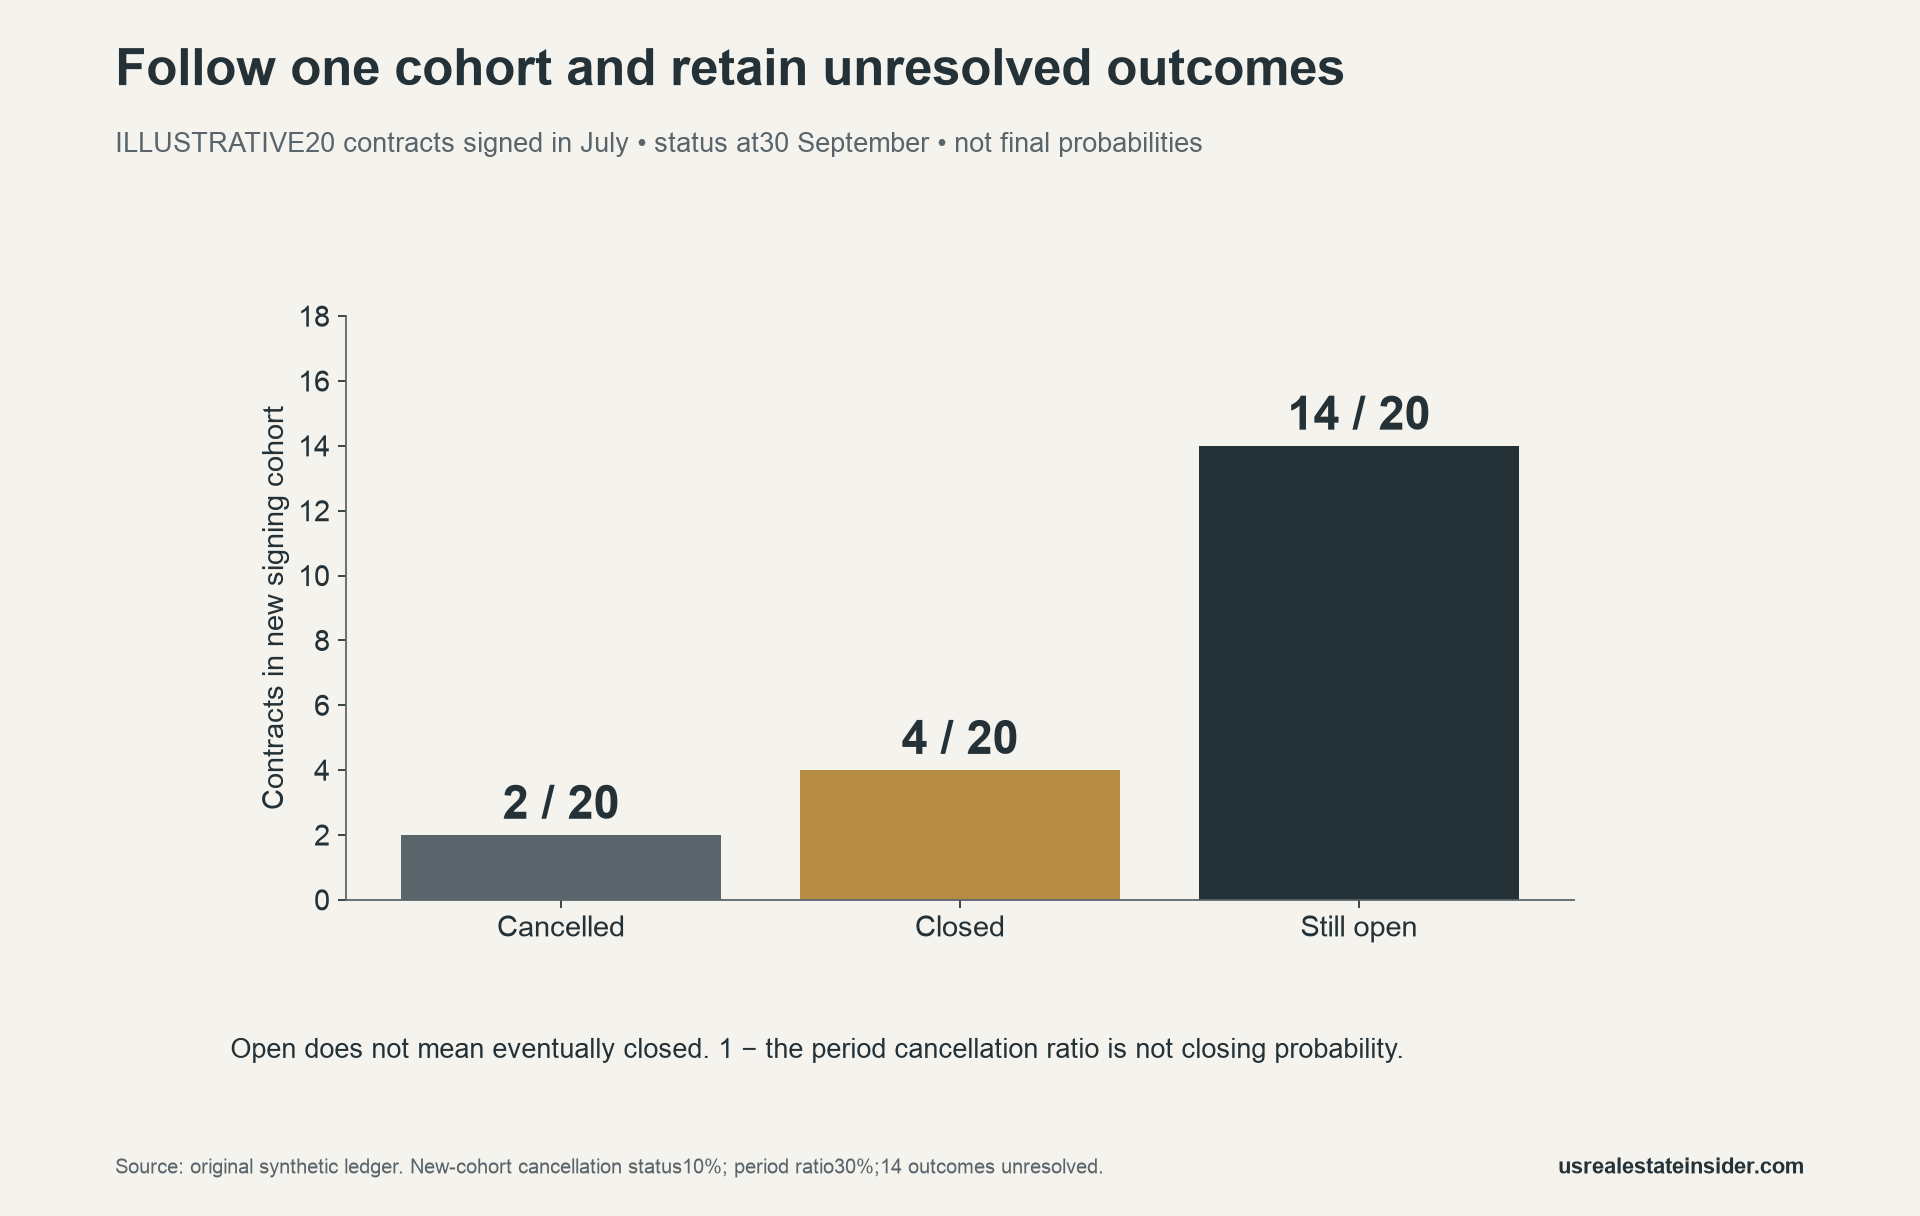
Consequently, subtracting the period’s 30% cancellation ratio from 100% would produce 70%, yet it would not establish a 70% closing probability. In this illustration, 70% of the new cohort is simply still open. Open contracts can later have different outcomes.
The same reasoning explains why a complement of the company’s headline cannot establish personal odds. Even a completed historical cohort would need a clear sampling and modelling argument before it could support a prediction for a specific buyer. The aggregate release does not provide that analysis.

Track your actual contract milestones
For a buyer, an evidence file is more actionable than inferred odds. Record the actual financing conditions, inspection arrangements, completion documentation and closing-date assumptions. For each item, retain the relevant clause, responsible contact, confirmation date and unresolved question.
Copy deadlines from the actual agreement and confirm their interpretation with an appropriate professional. This article does not create a cancellation right, promise a deposit refund or supply a universal deadline. Local requirements and the executed documents determine the relevant questions.
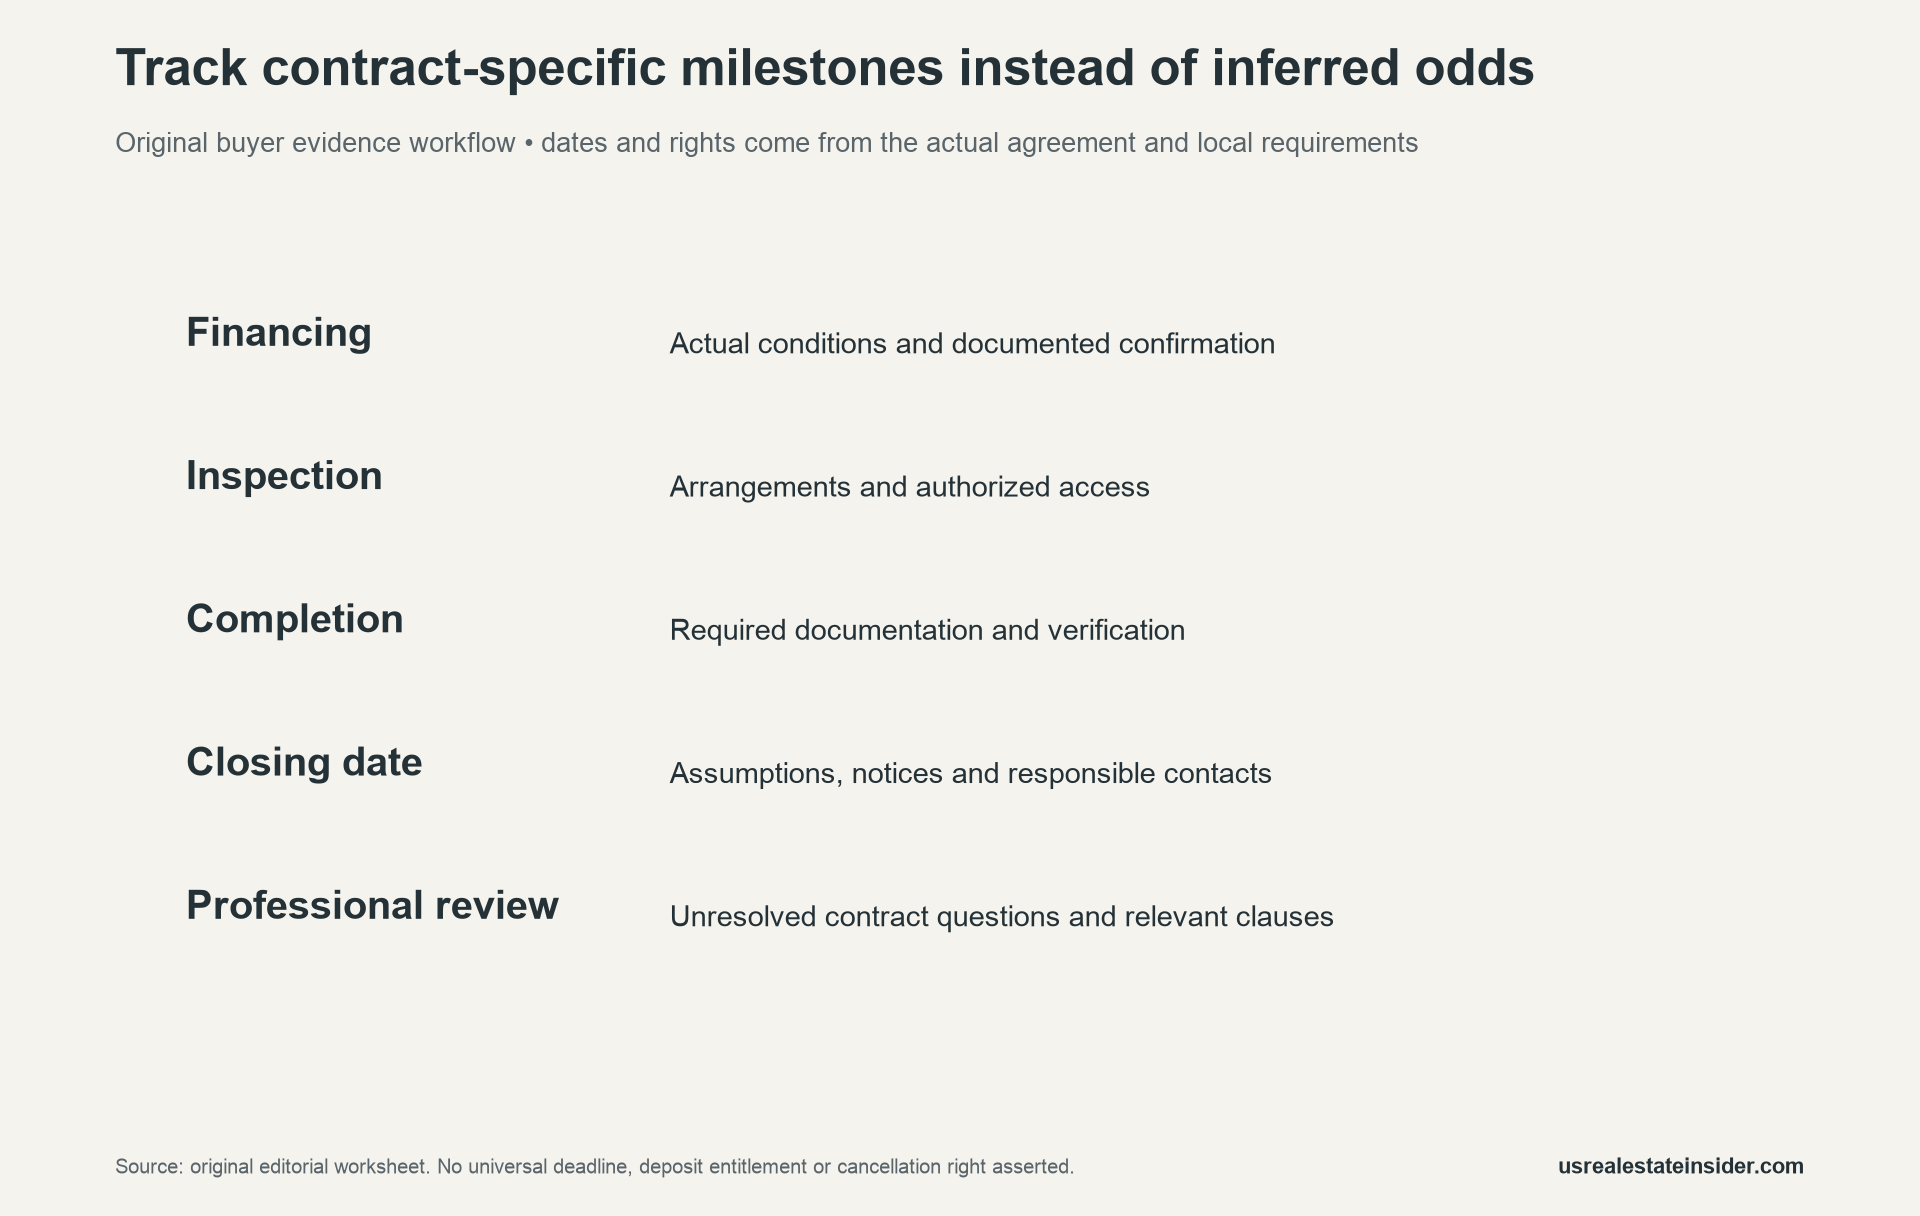
The blank milestone sheet provides a place for those records. It deliberately supplies no invented dates. For contract background, our contingent-offer guide introduces related terminology; interpretation of your particular agreement still needs its own review.
Download the reporting and cohort tools
The dated builder release snapshot (CSV) keeps the selected company observations separate from our example. The reporting definition dictionary (CSV) provides spaces for period boundaries, source definitions and rounding notes.
Download the illustrative contract-cohort ledger (CSV) to reproduce the counts. Filter by event date for period flows, then by signing cohort for cohort status. Use the blank buyer milestone sheet (CSV) to organize actual contract evidence without assuming a standard deadline.
What additional evidence would answer the harder questions?
A study of cancellation reasons would need consistently coded reasons linked to contracts and observation dates. A cohort-completion study would need sufficient follow-up and a clear treatment of contracts still open. Neither can be recovered from a rounded aggregate ratio alone.
Likewise, comparisons across builders require matching definitions and periods. We do not rank builders using unmatched ratios. Nor do we infer construction quality, customer experience, financing failure or deposit outcomes from the cancellation percentage by itself.
Method and limitations
US Real Estate Insider checked the SEC-hosted exhibit and retained the same release from the official company investor site. Our code validates unique synthetic identifiers, outcome counts, the cohort split and the backlog identity. No borrower information or private contract records were collected.
The illustration explains reporting structure; it does not estimate anyone’s closing probability. For another example of matching the denominator to the question, see our vacancy and foreclosure evidence guide. Keep source-reported observations and original teaching assumptions visibly separate.
Suggested citation: US Real Estate Insider, “Homebuilder Cancellation Rate Explained,” 2 November 2026. Cite D.R. Horton’s release for company observations and this article for the original synthetic ledger and worksheets.


