



Refinance share vs refinance volume can look contradictory until you inspect the denominator. A larger percentage of applications can belong to refinancing even when refinance activity falls. Our source-linked comparison and fictional count example show why the two statements can coexist.
What MBA reported for the week ending 13 November
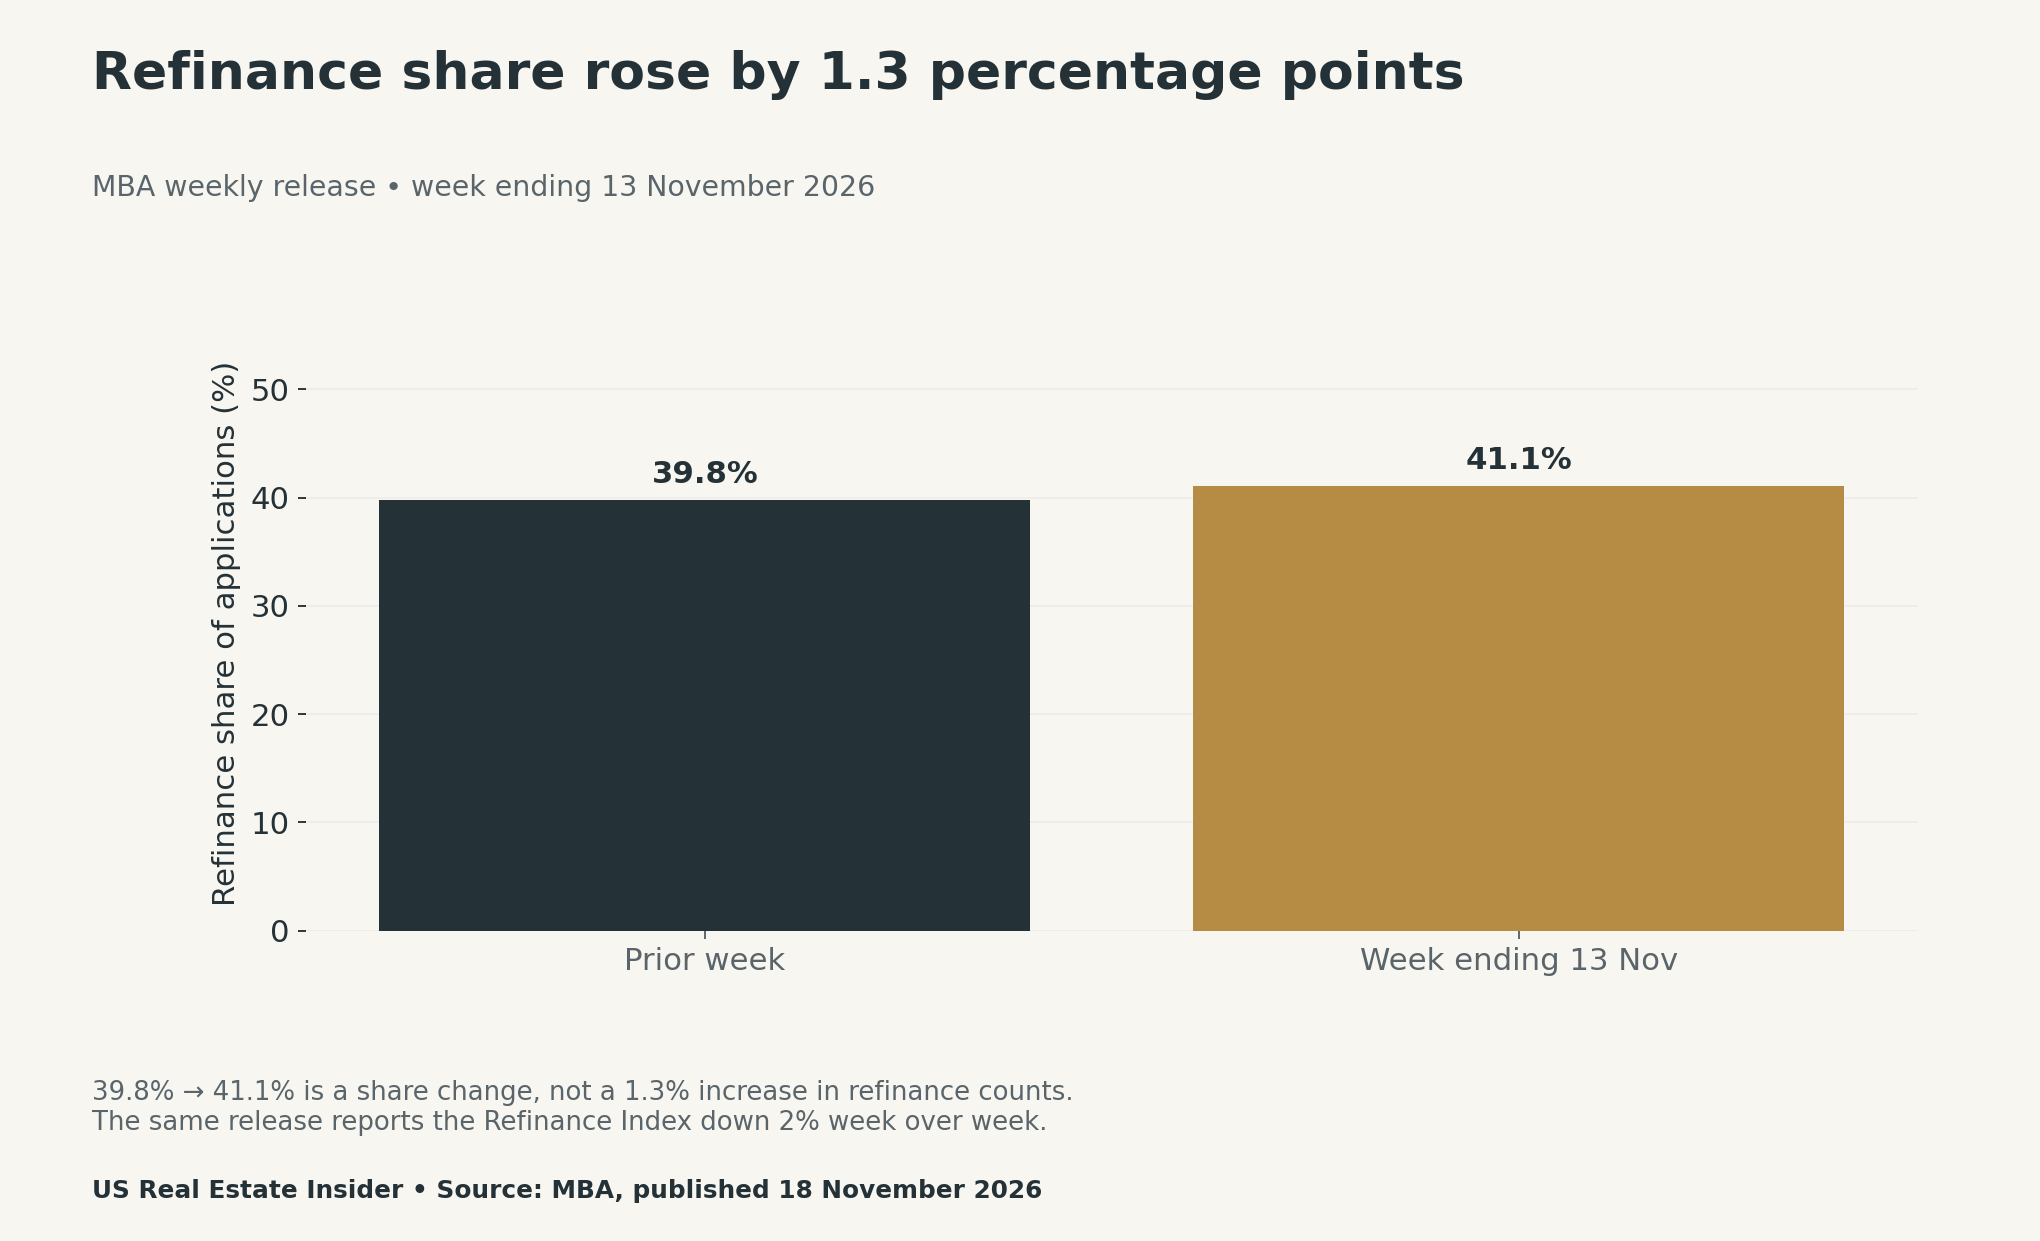
MBA’s 18 November 2026 release reports a 2% weekly decline in its Refinance Index. At the same time, refinance share increased from 39.8% to 41.1%. Its seasonally adjusted Purchase Index fell 3%, while the unadjusted Purchase Index fell 7%.
These measures are not interchangeable. An index change describes movement in the named activity measure. A share describes how much of a stated whole belongs to a category. Therefore, the higher refinance share does not establish that more refinance applications arrived.
Refinance share vs refinance volume in a fictional example
Begin with 400 refinance applications among 1,000 total applications. The share is 400 ÷ 1,000 × 100 = 40%. Now imagine 390 refinances among 900 total applications. That share is 390 ÷ 900 × 100 = 43.333%, displayed as 43.3%.
The refinance count fell by ten applications, or 2.5%. Meanwhile, the total fell by 100, or 10%. The smaller whole makes the remaining refinances a larger fraction. Other applications fell from 600 to 510, so the example’s categories still add up to the stated total.
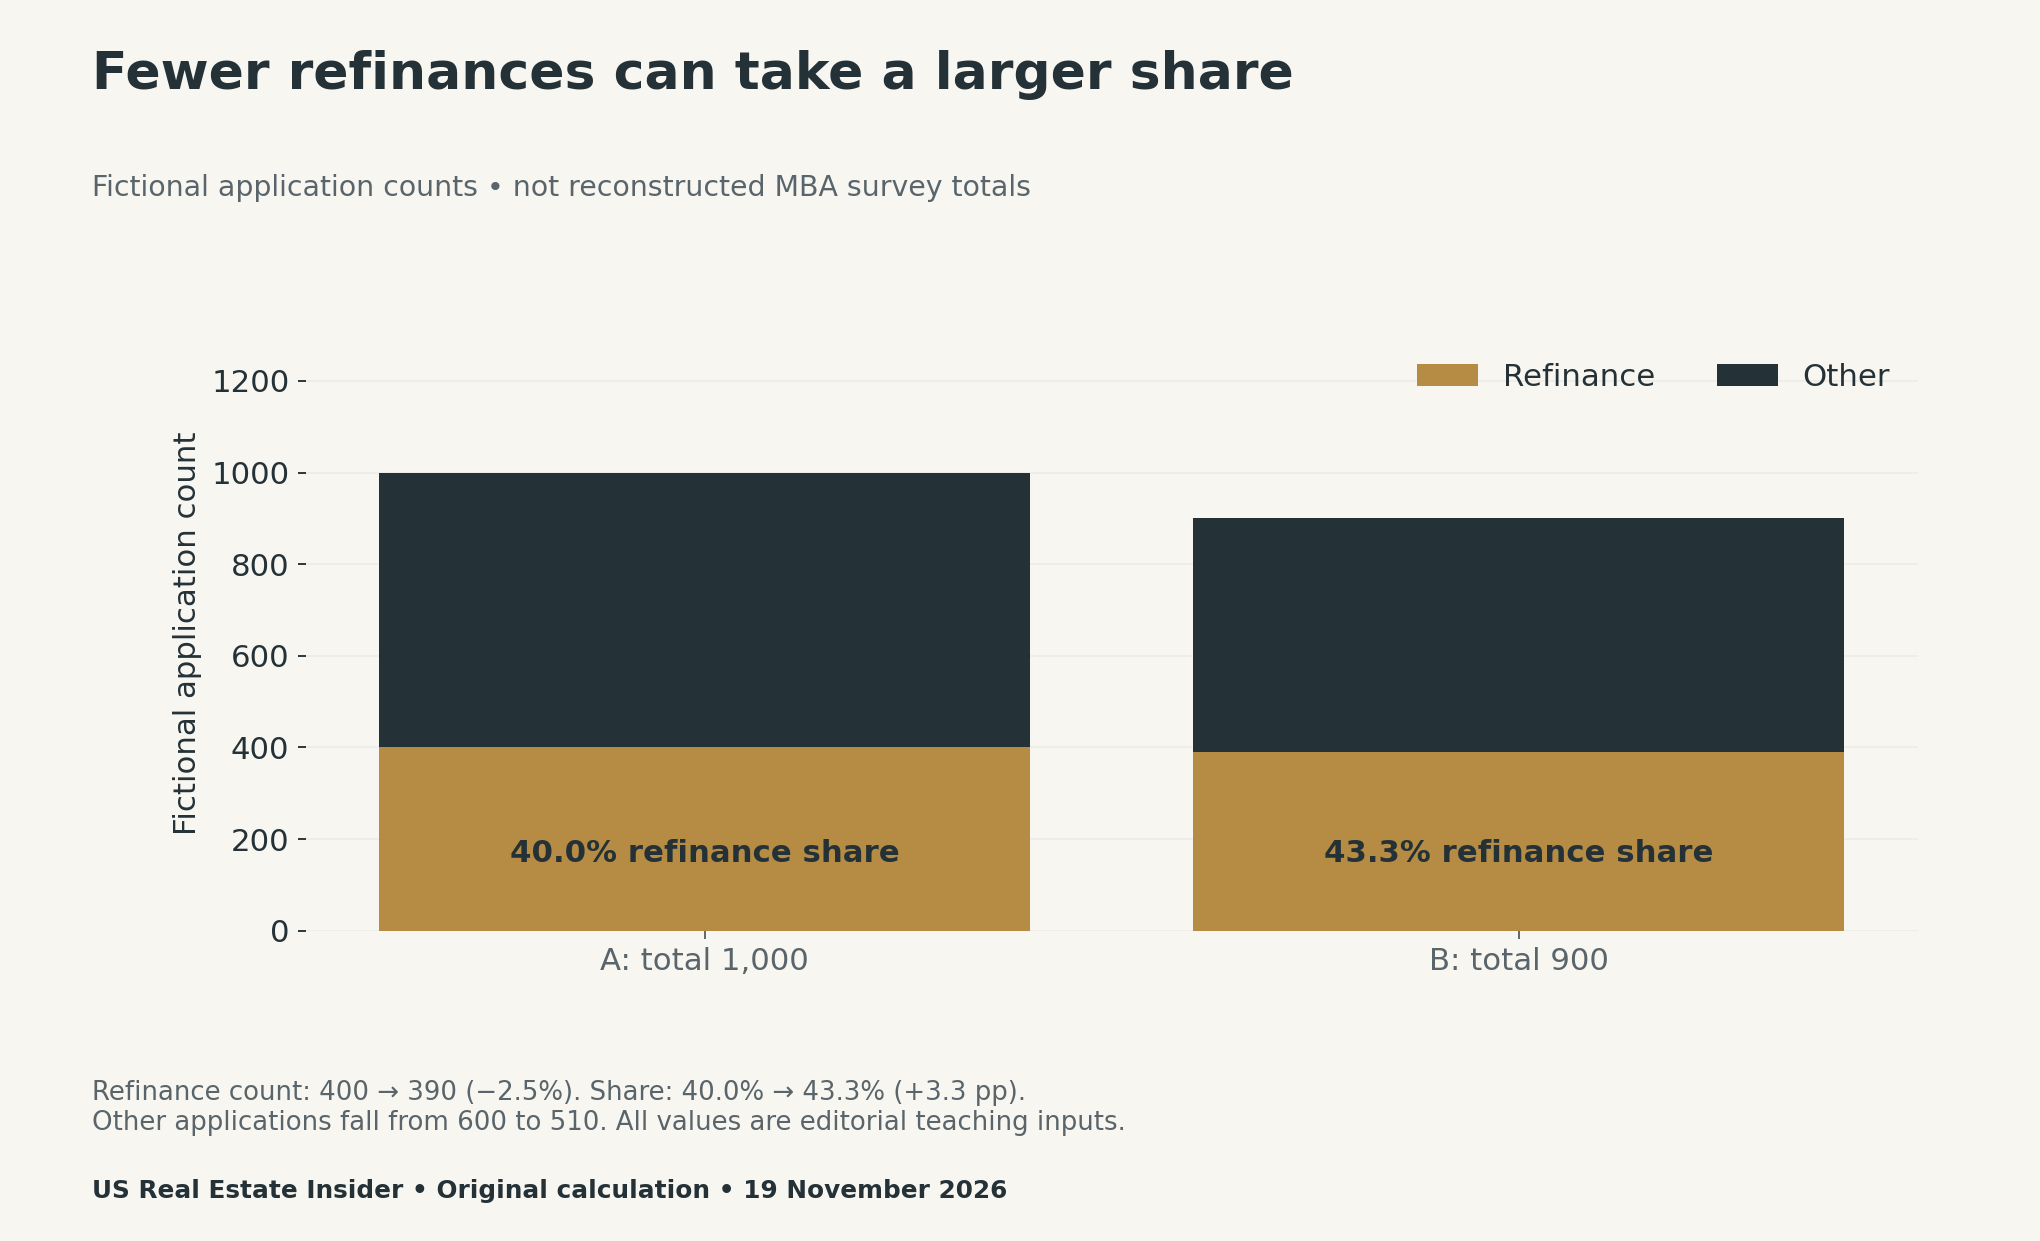
Subtracting the two shares gives about 3.3 percentage points. That is different from the percentage change in the share itself, which is about 8.3%. Neither calculation turns the 2.5% count decline into growth. Keep percent changes and percentage-point differences in separately labelled fields.
A denominator sensitivity check
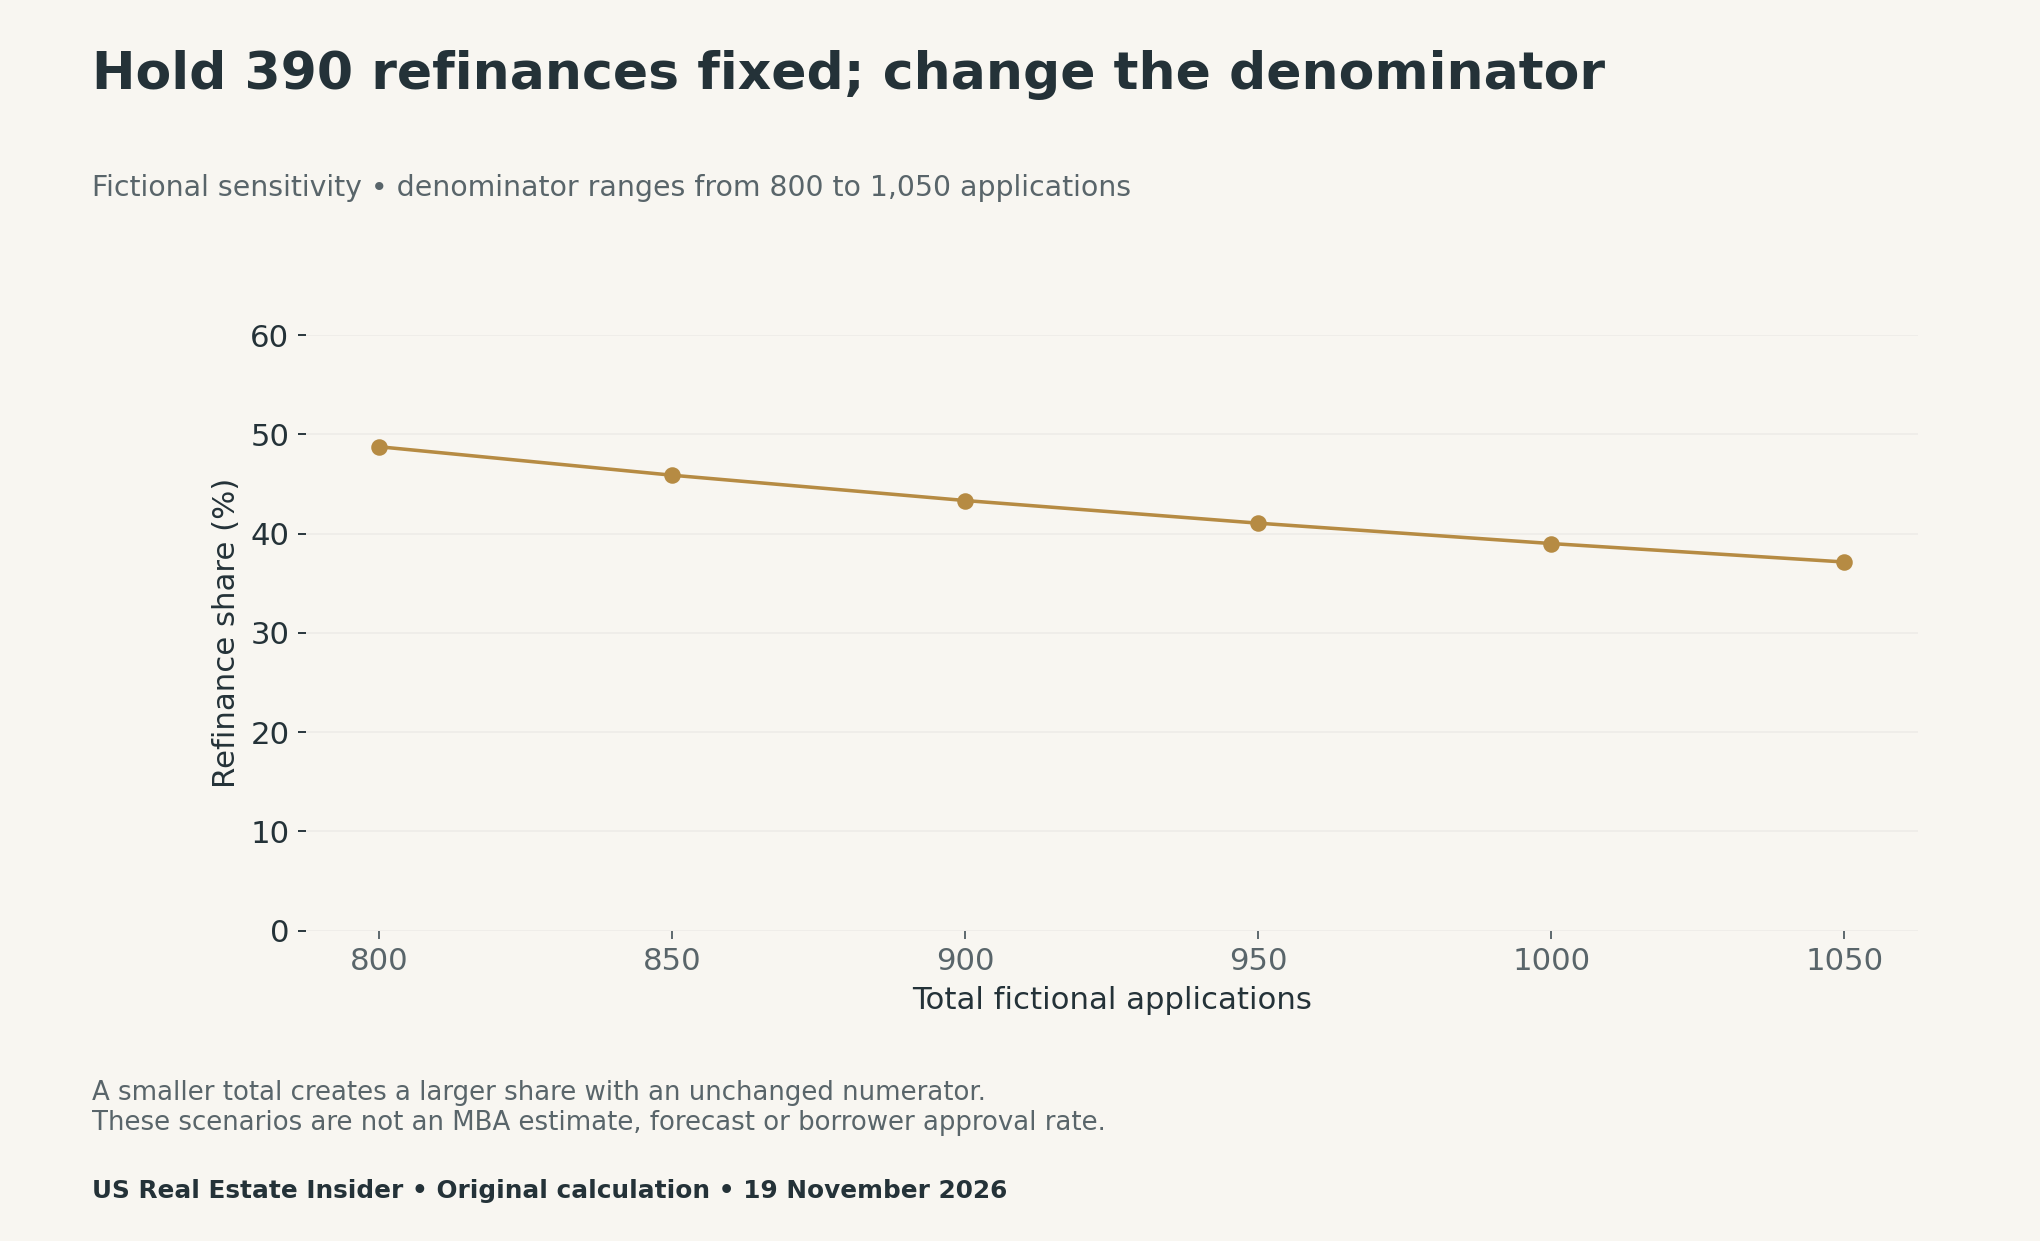
The sensitivity CSV keeps the numerator at 390 and varies the total in six scenarios. Every total is at least as large as the numerator. This simple validity check matters: a part cannot exceed its whole when both use the same non-overlapping counting base.
A share by itself cannot tell you the absolute count. For example, 40% could mean 40 of 100 or 400 of 1,000. To recover a count, you need a compatible total and the correct measurement basis. A national share does not supply a household’s probability of approval.
Why we do not reverse-engineer MBA totals
Our invented numbers are deliberately different from the published survey figures. We do not use rounded shares and differently adjusted index changes to reconstruct an exact number of applications. The necessary bases, precision and definitions must match before such a calculation is defensible.
In particular, the adjusted and unadjusted Purchase Index changes are two views of an index, not two independent groups of applicants. Adding or averaging them would create a measure the publisher did not report. Retain their adjustment labels when citing or downloading them.
Audit the denominator before interpreting the headline
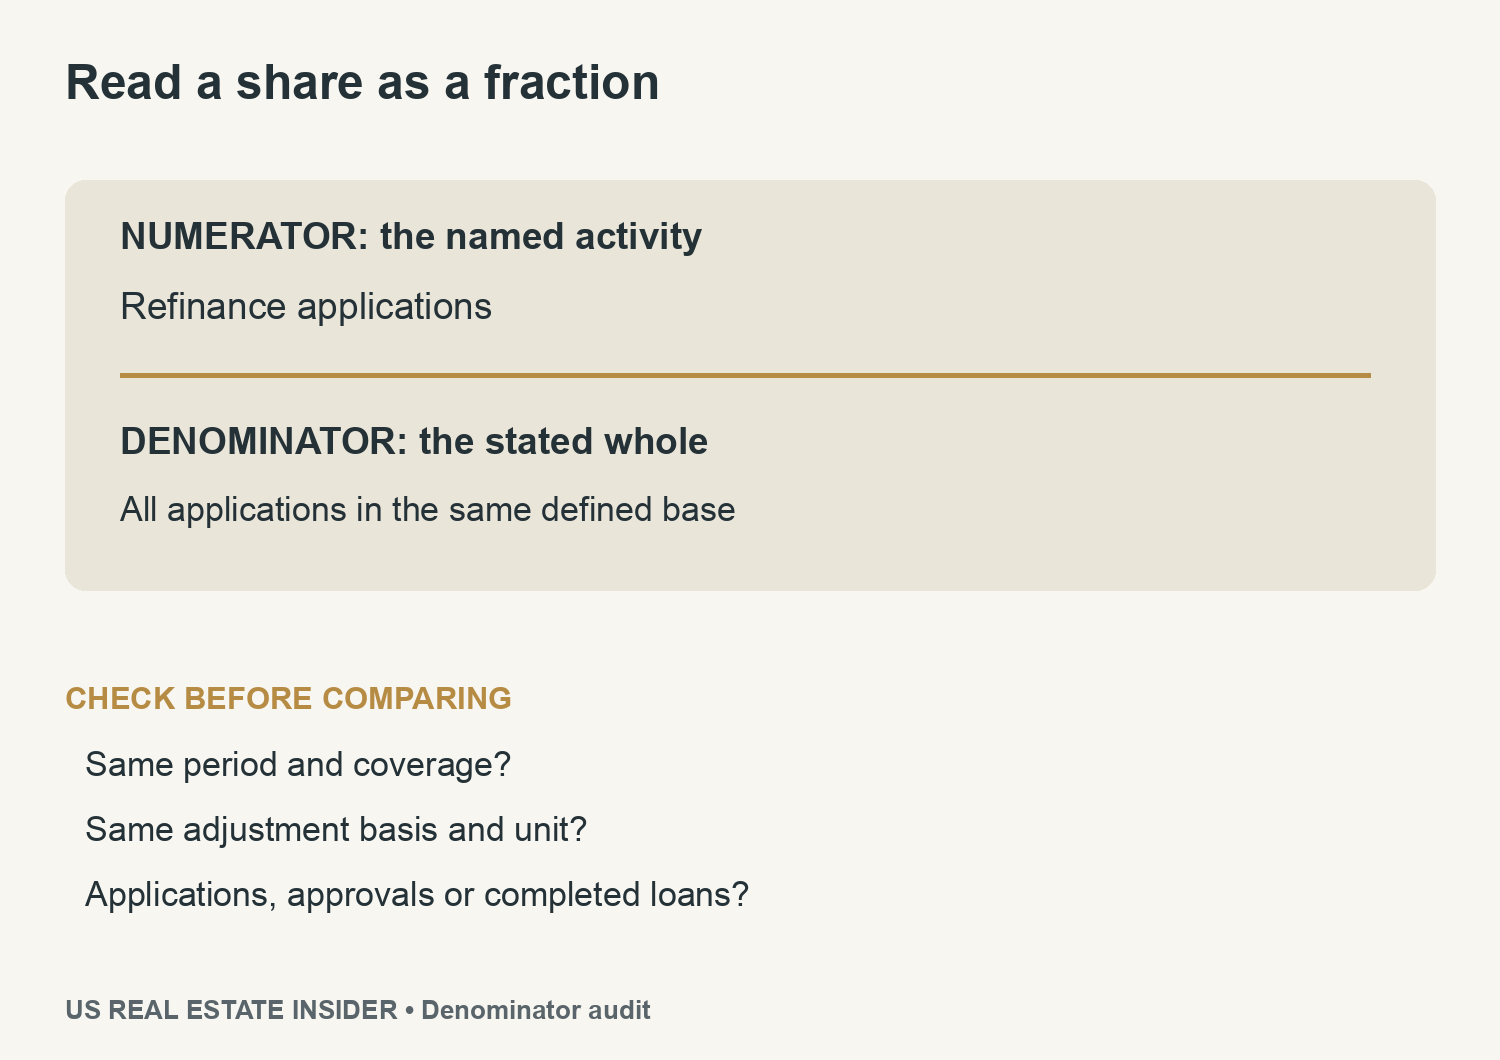
First, write the numerator in ordinary words. Next, identify the whole, its period and its coverage. Then check whether the figures are counts, dollar amounts, index levels or shares. Finally, record any seasonal adjustment and rounding before comparing two values.
The blank worksheet leaves unknown fields blank. That is preferable to borrowing a total from a different release or mixing an adjusted growth rate with an unadjusted base. Keep an explicit source link so another reader can inspect the definition.
Applications are not approvals, closings or savings
An application is one stage of a financing process. A market activity release does not establish that a lender approved a particular borrower, that a loan closed or that refinancing saved that household money. Those questions need their own evidence.
For a personal comparison, the CFPB’s Loan Estimate guide explains how to compare offers and their details. Use current quotes and comparable assumptions. A lower stated payment alone does not describe the complete cost or the effect of a changed loan term.
Record the proposed balance, rate structure, fees, term, payment scope and cash needed at closing. In addition, identify what is locked and what can change. Our denominator worksheet is a media-literacy tool; it neither selects a mortgage nor supplies a current quote.
Download the calculations and checklist
- Selected MBA measures with units and adjustment labels (CSV)
- Two-period fictional count and share calculation (CSV)
- Six fictional denominator scenarios (CSV)
- Blank mortgage-statistic denominator checklist (CSV)
For another part-versus-whole distinction, see our median home price and home value analysis. Browse Home Buying Tips for related financing questions.
Method and limits
We checked the first-party indexed MBA release on 19 November 2026. Direct retrieval returned an access restriction; we did not bypass it. The source file preserves the release date, reference week, units and published adjustment labels. We have not accessed underlying survey application records.
The count example and sensitivity are original editorial calculations, not observed borrower data. We round the second share to one decimal in the chart and retain greater precision in the CSV. No sampling uncertainty, approval probability, closed-loan count or household savings estimate is inferred.


