



November home sales seasonality can explain why a national market often becomes quieter, but it cannot diagnose one listing. A slower week deserves a structured review of relevant local evidence, access and presentation before anyone treats the calendar as a reason to cut a price—or to dismiss a problem.
This guide separates a newly published historical baseline from current property evidence. It adds a fictional inquiry comparison, an evidence-route infographic and blank review tools. None of the examples estimates November 2026 sales or predicts when a particular home will sell.
November home sales seasonality: label the historical period
In a 12 November analysis, Chris Lux of the National Association of REALTORS® describes pre-pandemic patterns from 1999–2019. Selected unadjusted October-to-November averages are a 9.6% decline in existing-home sales, a 2.7% inventory decline and about two extra days of marketing time.
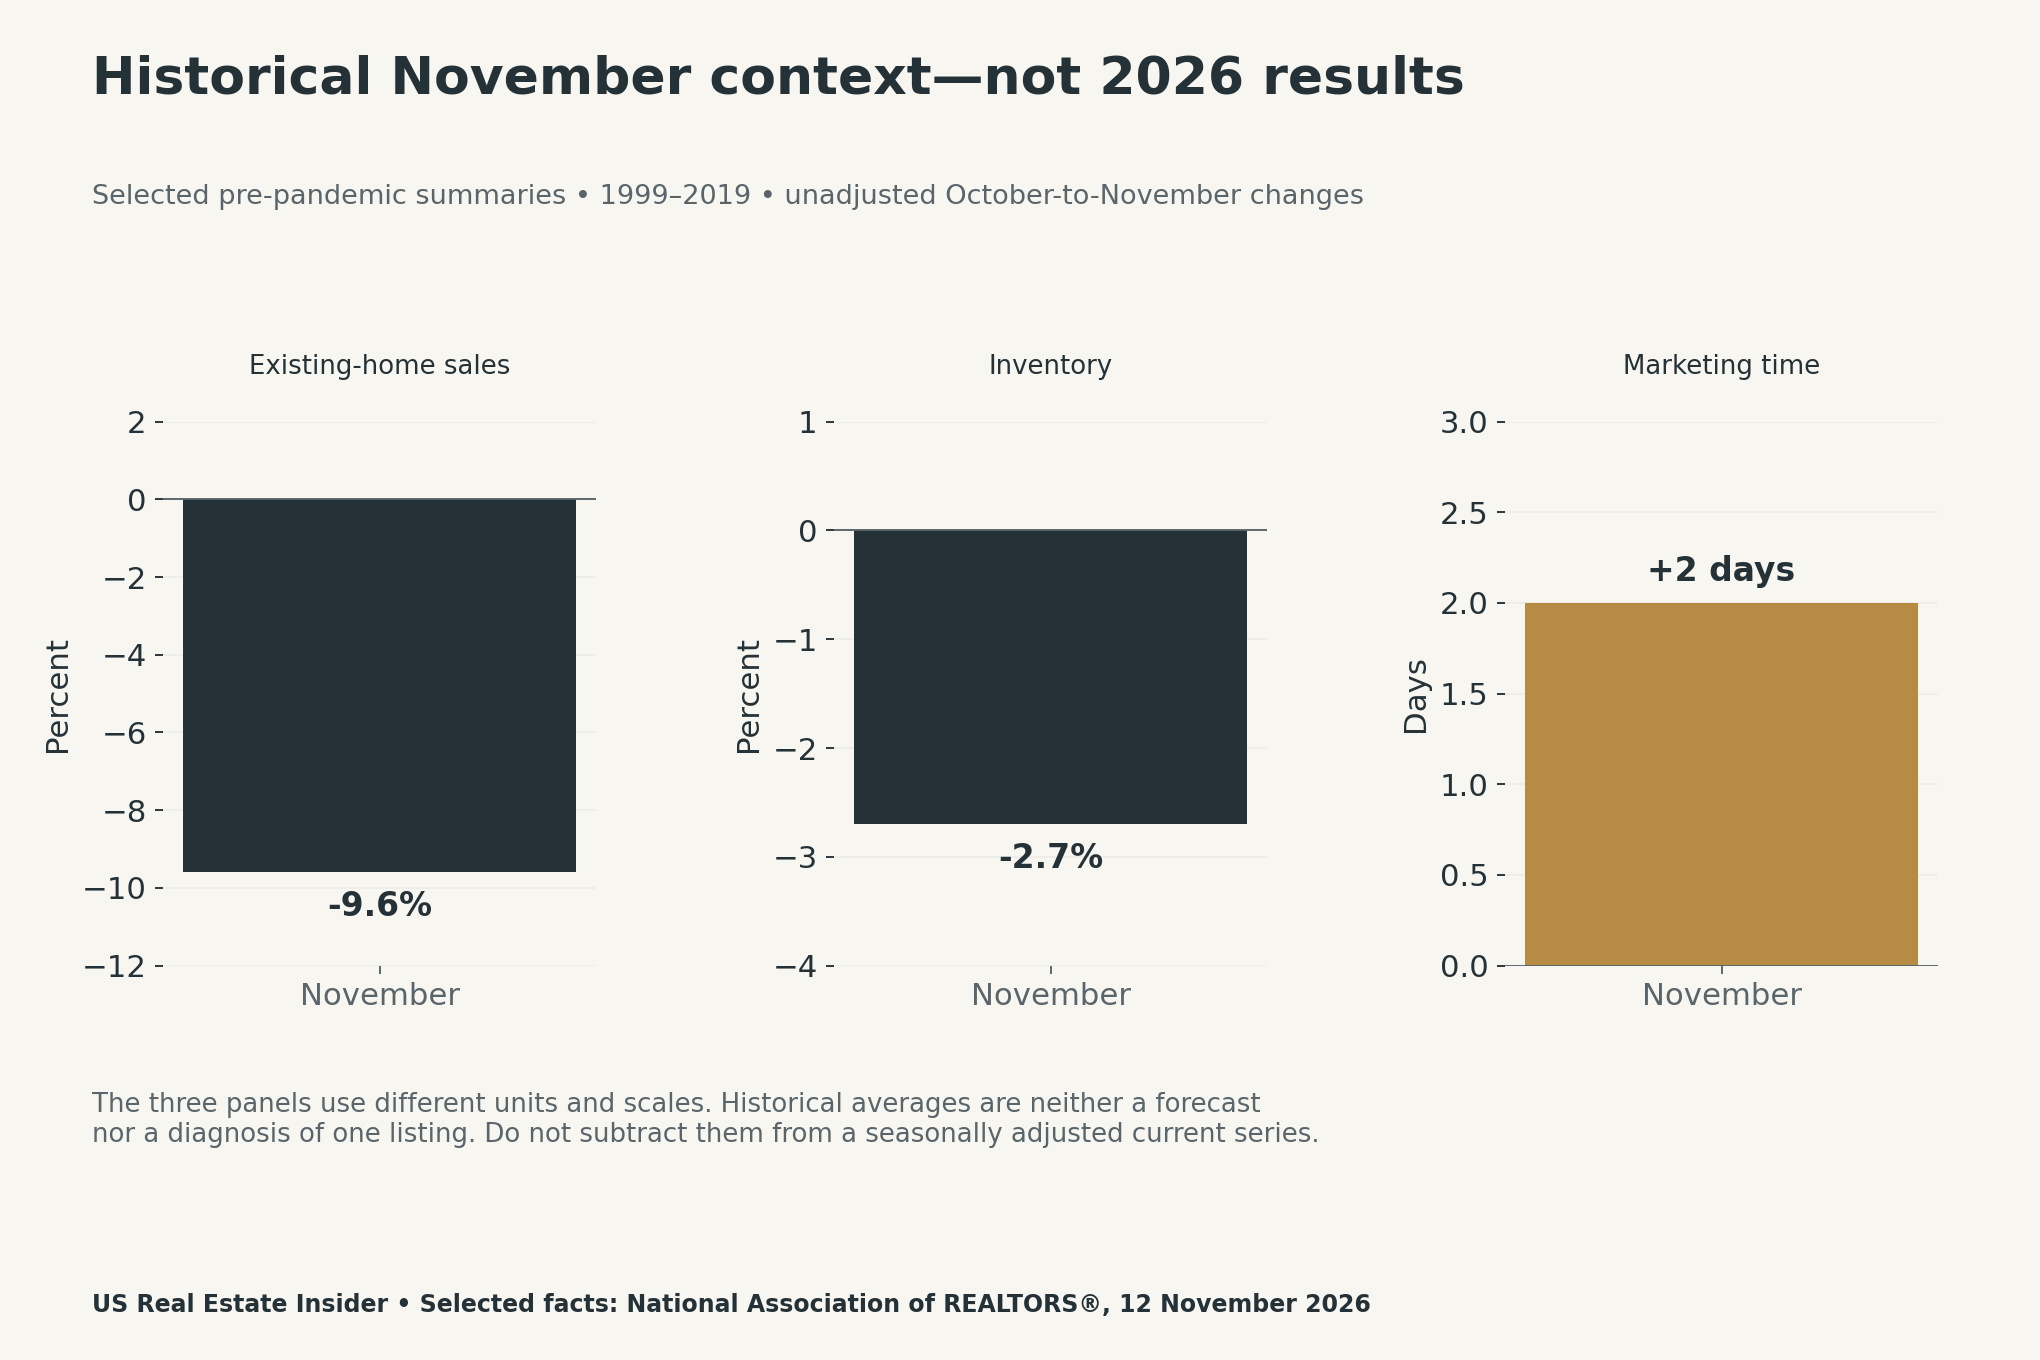
The publication date is recent; the observations behind the baseline are older. The source explicitly says its comparison with November 2026 will come later. Keeping those dates visible prevents a historical summary from becoming an invented current-month result.
Use the baseline as context, not a property diagnosis
An average can hide variation across years, places and property types. A national seasonal change therefore cannot tell you whether a particular home has an access problem, weak photographs, a repair concern or a price that needs review. It also cannot prove that any of those explanations is present.
The right next step is to define what you observed. Was it fewer inquiries, fewer showings, no offers or a delayed transaction? Those are different events with different timing. Write down the measure and dates before choosing a comparison.
Also keep adjusted and unadjusted series separate. Subtracting an old unadjusted November average from a current seasonally adjusted October change does not create a valid local or seasonal adjustment. This article performs no such calculation.
Build a relevant local comparison set
Discuss with an appropriate local professional which listings provide a meaningful comparison. Retain their geography, property characteristics, price range, availability and observation dates. A comparison set should answer the actual question rather than collect whichever listings are easiest to find.
Use consistent measures across the periods. For example, a change in the number of accessible showing days can affect a count of showings. If that information is unavailable, record the gap. Do not quietly assume that equal calendar weeks had equal exposure or opportunity.
A national context chart cannot supply missing local evidence. Likewise, an asking-price change is not the same event as a completed sale. The review log keeps these observations separate so a later reader can reconstruct what was known when a decision was discussed.
A fictional inquiry comparison shows the next question
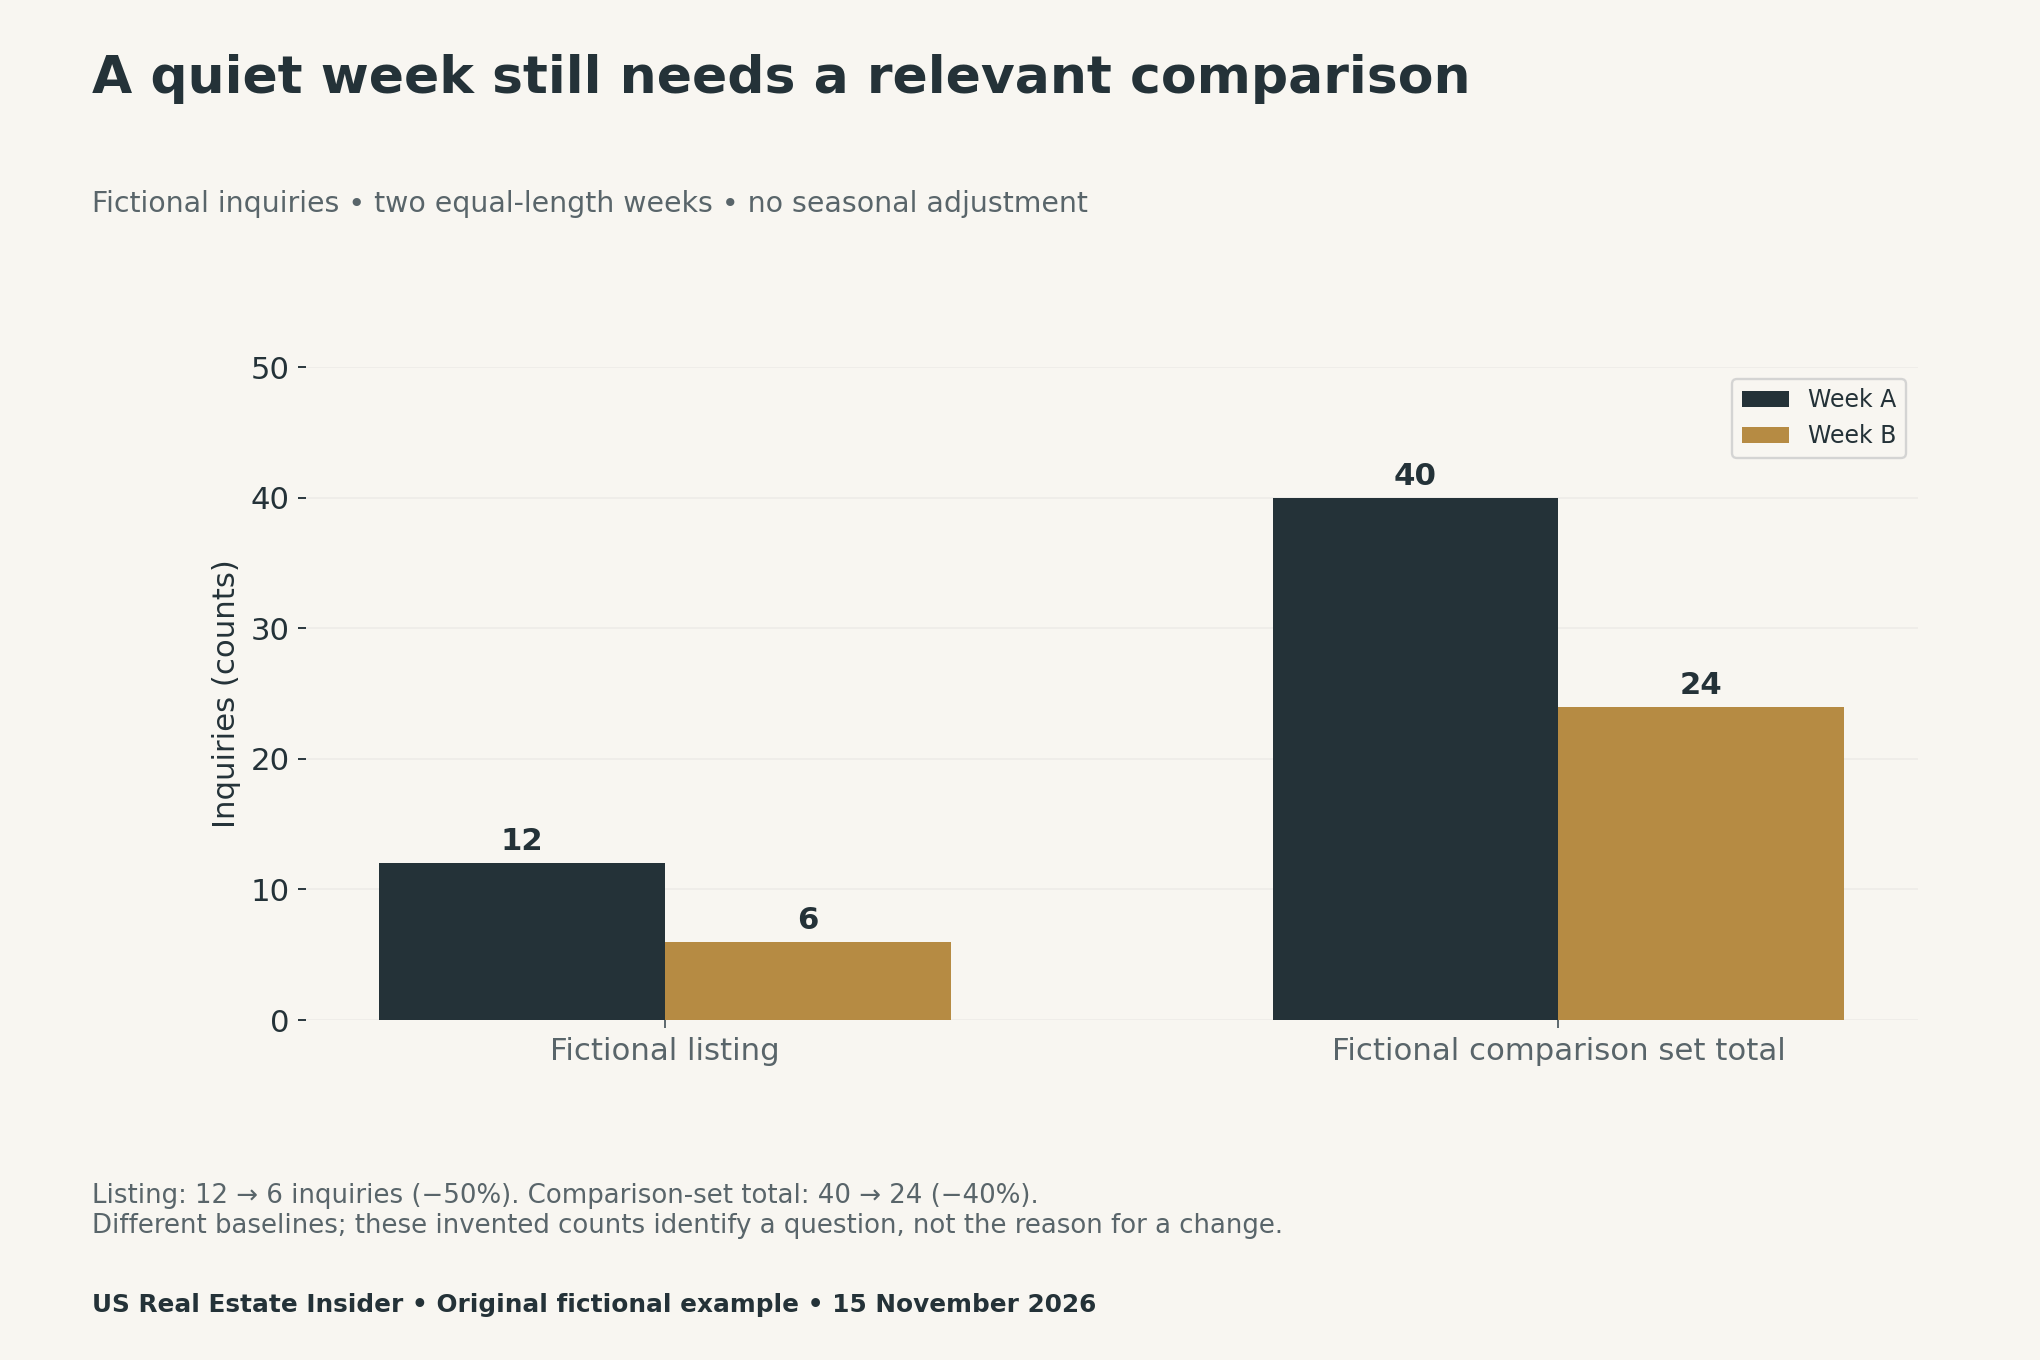
The arithmetic uses each series’ own baseline: (6 − 12) ÷ 12 = −50%, while (24 − 40) ÷ 40 = −40%. It suggests investigating why the selected listing changed differently. However, it does not establish pricing as the cause.
The comparison total also represents several listings, while the first series represents one. Its level is therefore not a target for the individual home. Before treating the difference as meaningful, review the comparison set, exposure, access and any changes in which listings were included.
Choose the next evidence route
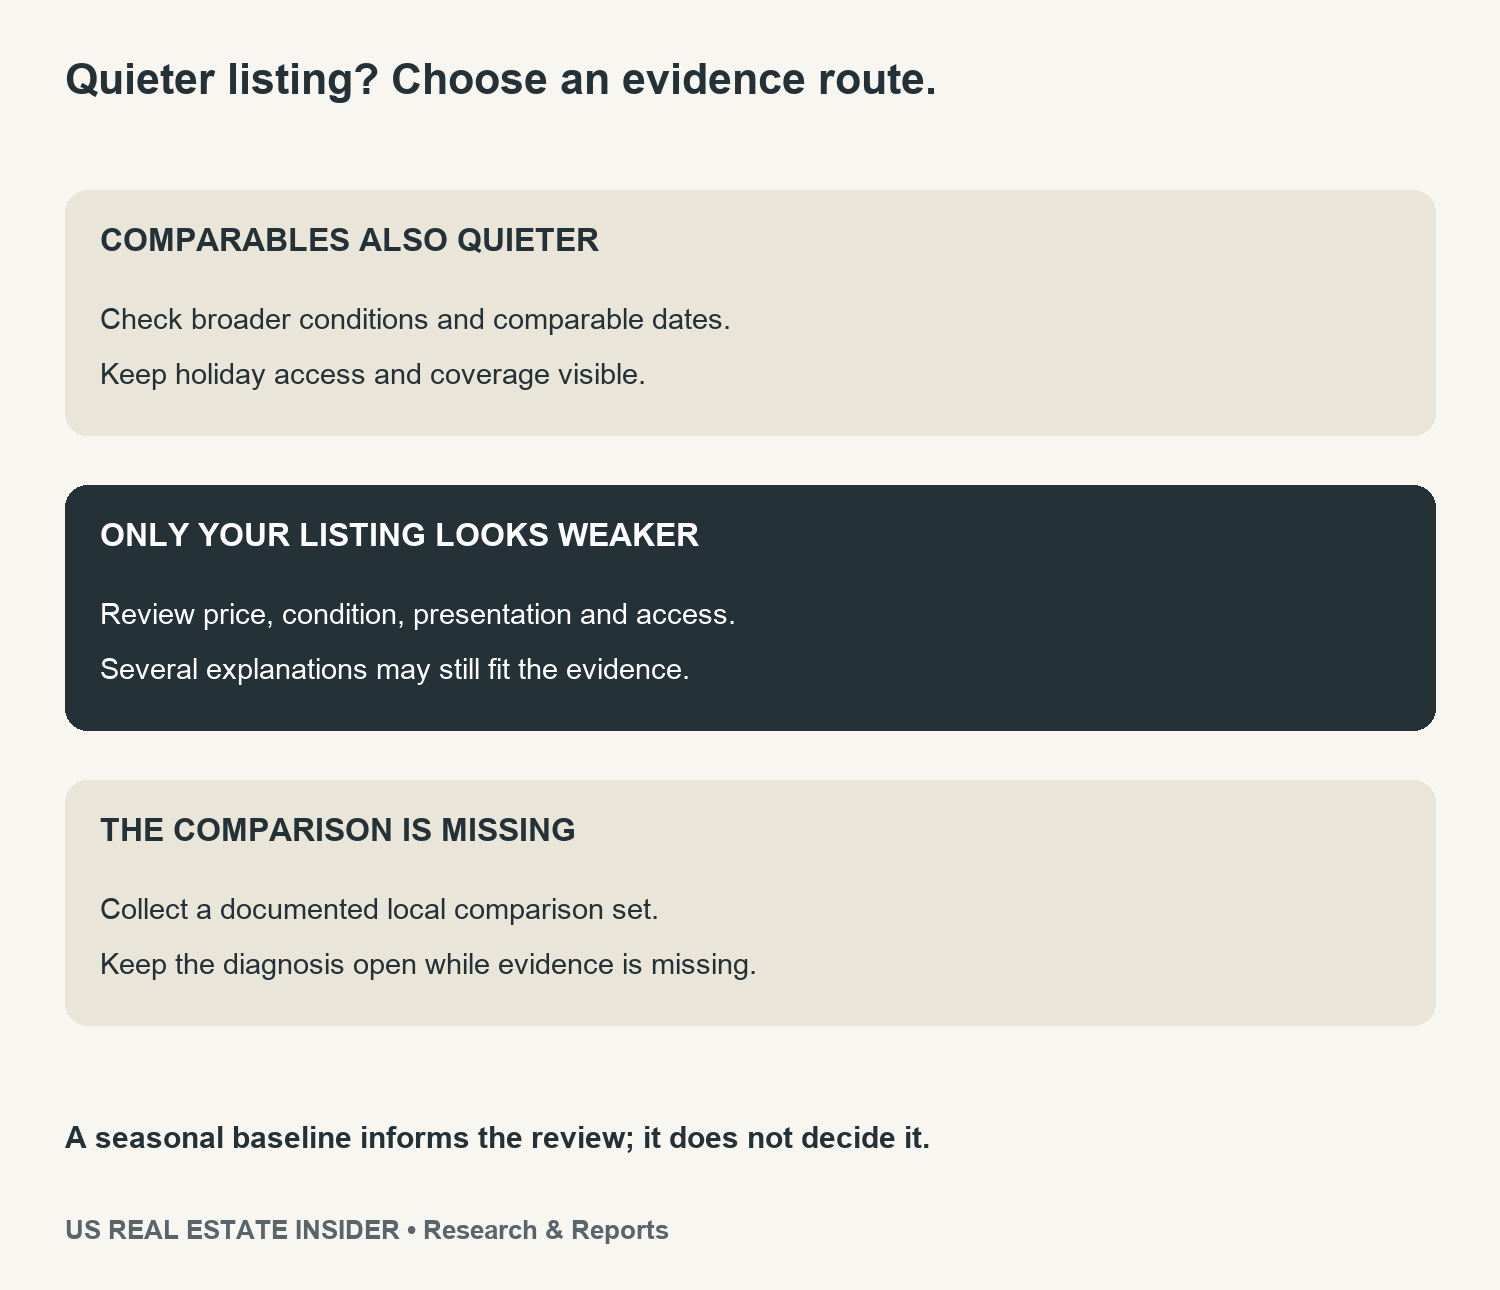
| Observed pattern | Question | Next evidence |
|---|---|---|
| Relevant listings also quieter | A broader change may be worth investigating | Check comparable dates, coverage and access |
| This listing weaker than comparables | Investigate property-specific evidence | Review price, condition, presentation and access with agent |
| Comparison evidence missing | The diagnosis remains uncertain | Collect a documented local comparison set |
If relevant listings are also quieter, investigate the broader context while checking whether the comparison really fits. If the selected home appears weaker, examine its evidence directly. When the comparison is missing, the honest result is uncertainty rather than a confident seasonal explanation.
A quiet holiday week alone should neither force a price cut nor become a reason to ignore an emerging pattern. The practical value of the map is that it makes the next question explicit and reviewable. A qualified agent can then discuss current evidence and options with the seller.
Keep a dated weekly review log
The blank log records inquiries, showings and offers separately. It also retains access days, presentation changes, price changes and the comparison definition. Notes on a major change help explain why adjacent weeks might not be directly comparable.
For instance, new photographs and wider showing access introduced together make it difficult to attribute a later response to either action alone. Record both changes and avoid claiming an isolated effect. Observational listing data often has several plausible explanations.
Review the log at a sensible agreed interval rather than responding to every isolated count. The right interval depends on current local conditions, the property and the seller’s circumstances. Our tools set no universal deadline, guaranteed sale time or optimal listing date.
Download the original review tools
- Historical-context citation and coverage register (CSV)
- Fictional weekly inquiry comparison and arithmetic (CSV)
- Blank weekly listing review log (CSV)
- Listing-review evidence map (CSV)
For another headline-to-decision distinction, see our housing-market ranking guide. Our shelter and household-budget comparison shows why a statistic needs the right question and denominator.
Methodology, attribution and limits
We checked the first-party analysis on 15 November 2026. Citation: Lux, Chris. “The Market Dynamics of November: Sales, Inventory, and Buyer Trends.” National Association of REALTORS®, Economists’ Outlook, 12 November 2026. The linked source supplies the historical context; our first figure presents only three selected facts with separate units.
We did not reproduce NAR’s original artwork, article or underlying historical data series. The downloadable source register records its citation and scope. The inquiry example and review tools are original editorial exercises, with no sampled properties or estimated seasonal model.
Pre-pandemic patterns may fit current conditions poorly. Geographic variation, changes in listing mix and small counts can also affect comparisons. This workflow improves documentation; it does not guarantee a pricing decision, a faster sale or a particular outcome.


