




A zombie foreclosure vs vacant property comparison begins with two separate questions: is the home unoccupied, and what is its documented legal status? Vacancy alone does not establish that a property is for sale, that a seller can transfer it, or that you may enter it.
ATTOM’s new national report is useful context, but it is not a list of verified bargains. This guide explains its denominator, reproduces the reported ratio and provides evidence worksheets. It also shows why an unresolved repair or carrying cost must stay unknown rather than becoming an assumed zero.
Read ATTOM’s Q4 snapshot with the right denominator
ATTOM’s 29 October 2026 release analyzes 105.1 million residential properties. It identifies 269,195 in foreclosure, including 8,040 vacant before completion. Those counts produce about 2.99%, which the source rounds to a 3% zombie rate.
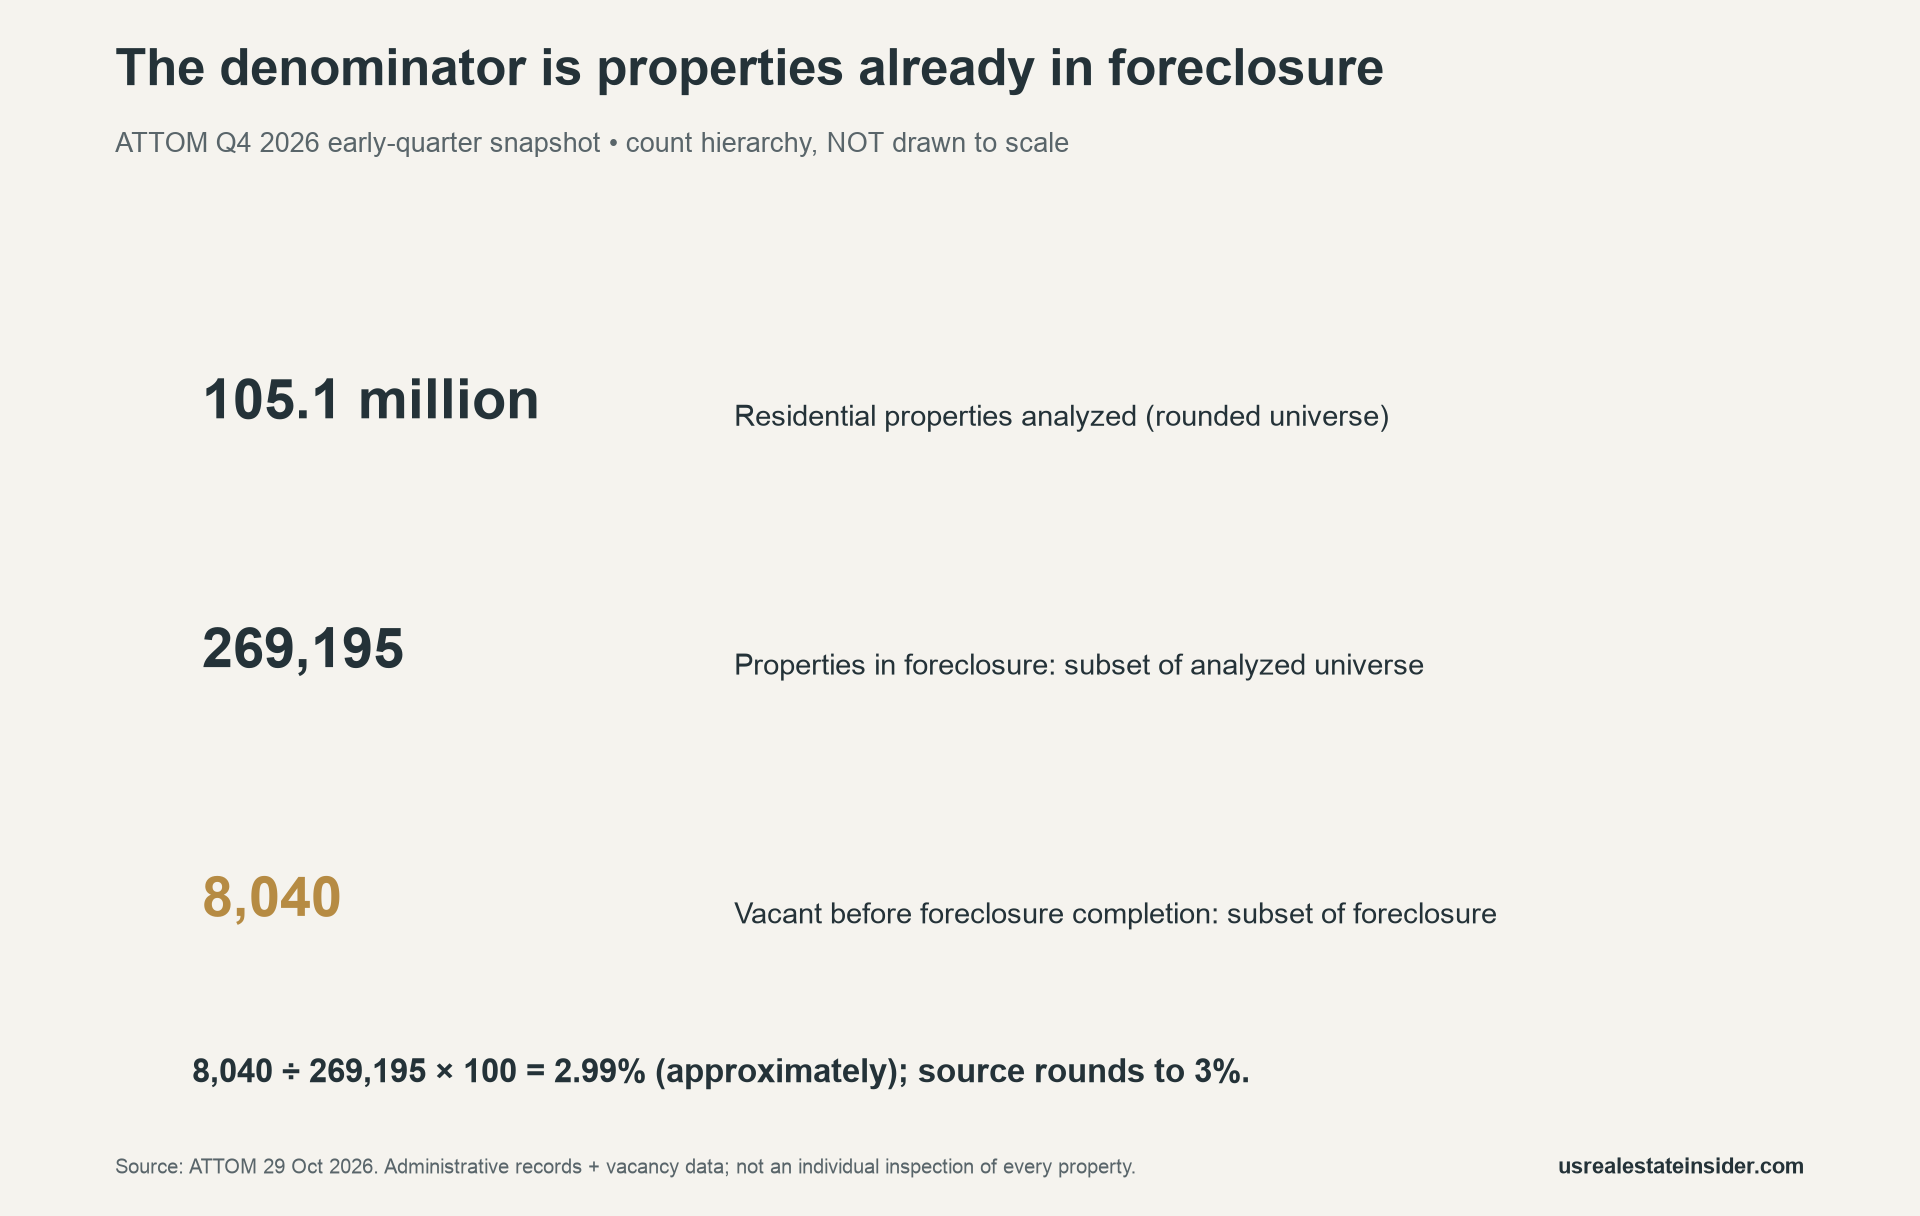
The denominator is the foreclosure subset. It is not all homes, all vacant homes or all properties available to buy. Also, the Q4 label describes an early-quarter snapshot, not observations collected through the end of December.
Keep the zombie foreclosure vs vacant property distinction clear
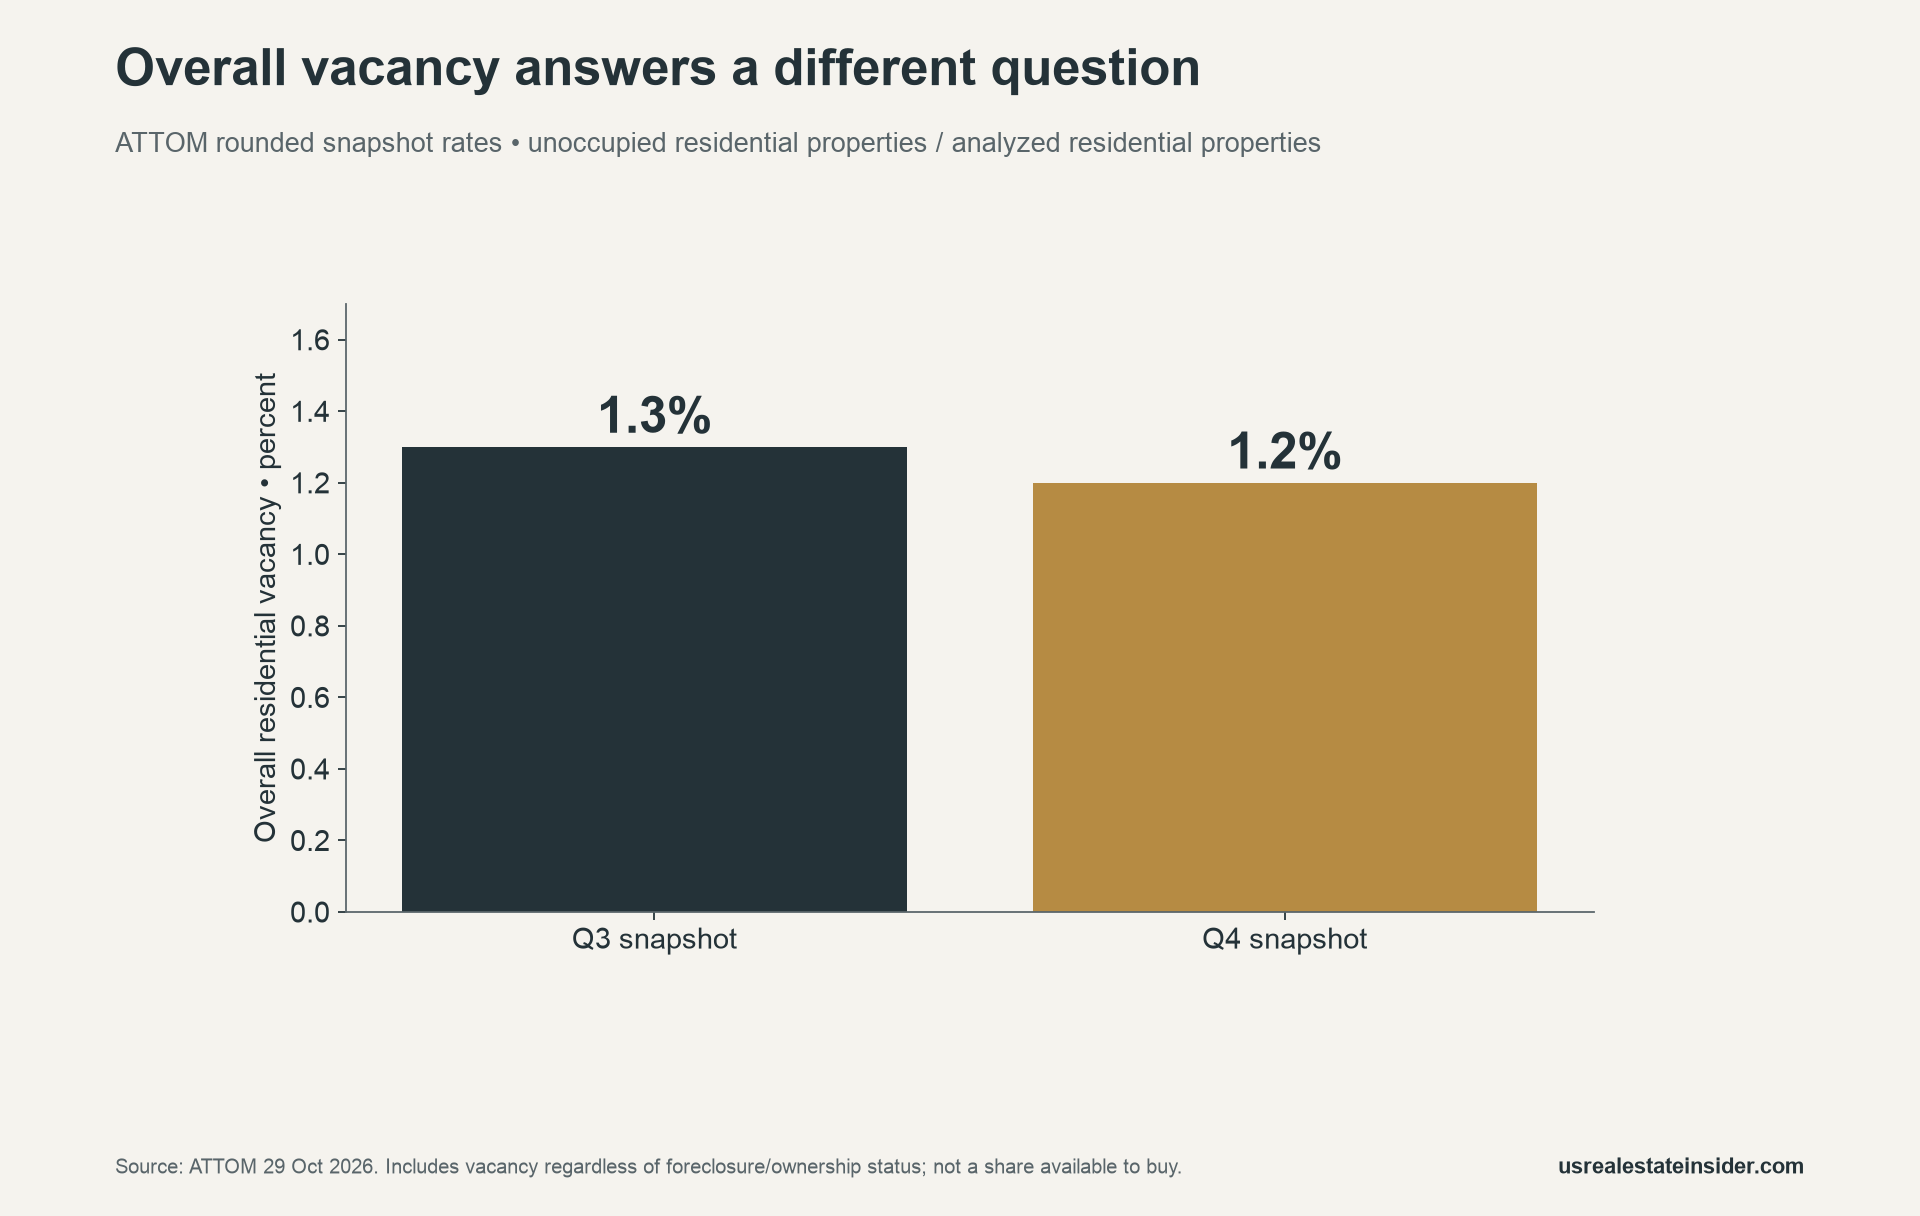
In this report, the zombie classification concerns vacancy before foreclosure completion. Overall vacancy covers unoccupied residential properties regardless of ownership or foreclosure status. A vacant bank-owned property after completion is a different status from the pre-completion subset.
Thus, an apparent vacancy signal cannot answer every legal question. A property can look empty while ownership, authority to sell and access arrangements remain unresolved. Keep those findings in separate fields and attach evidence to each one.
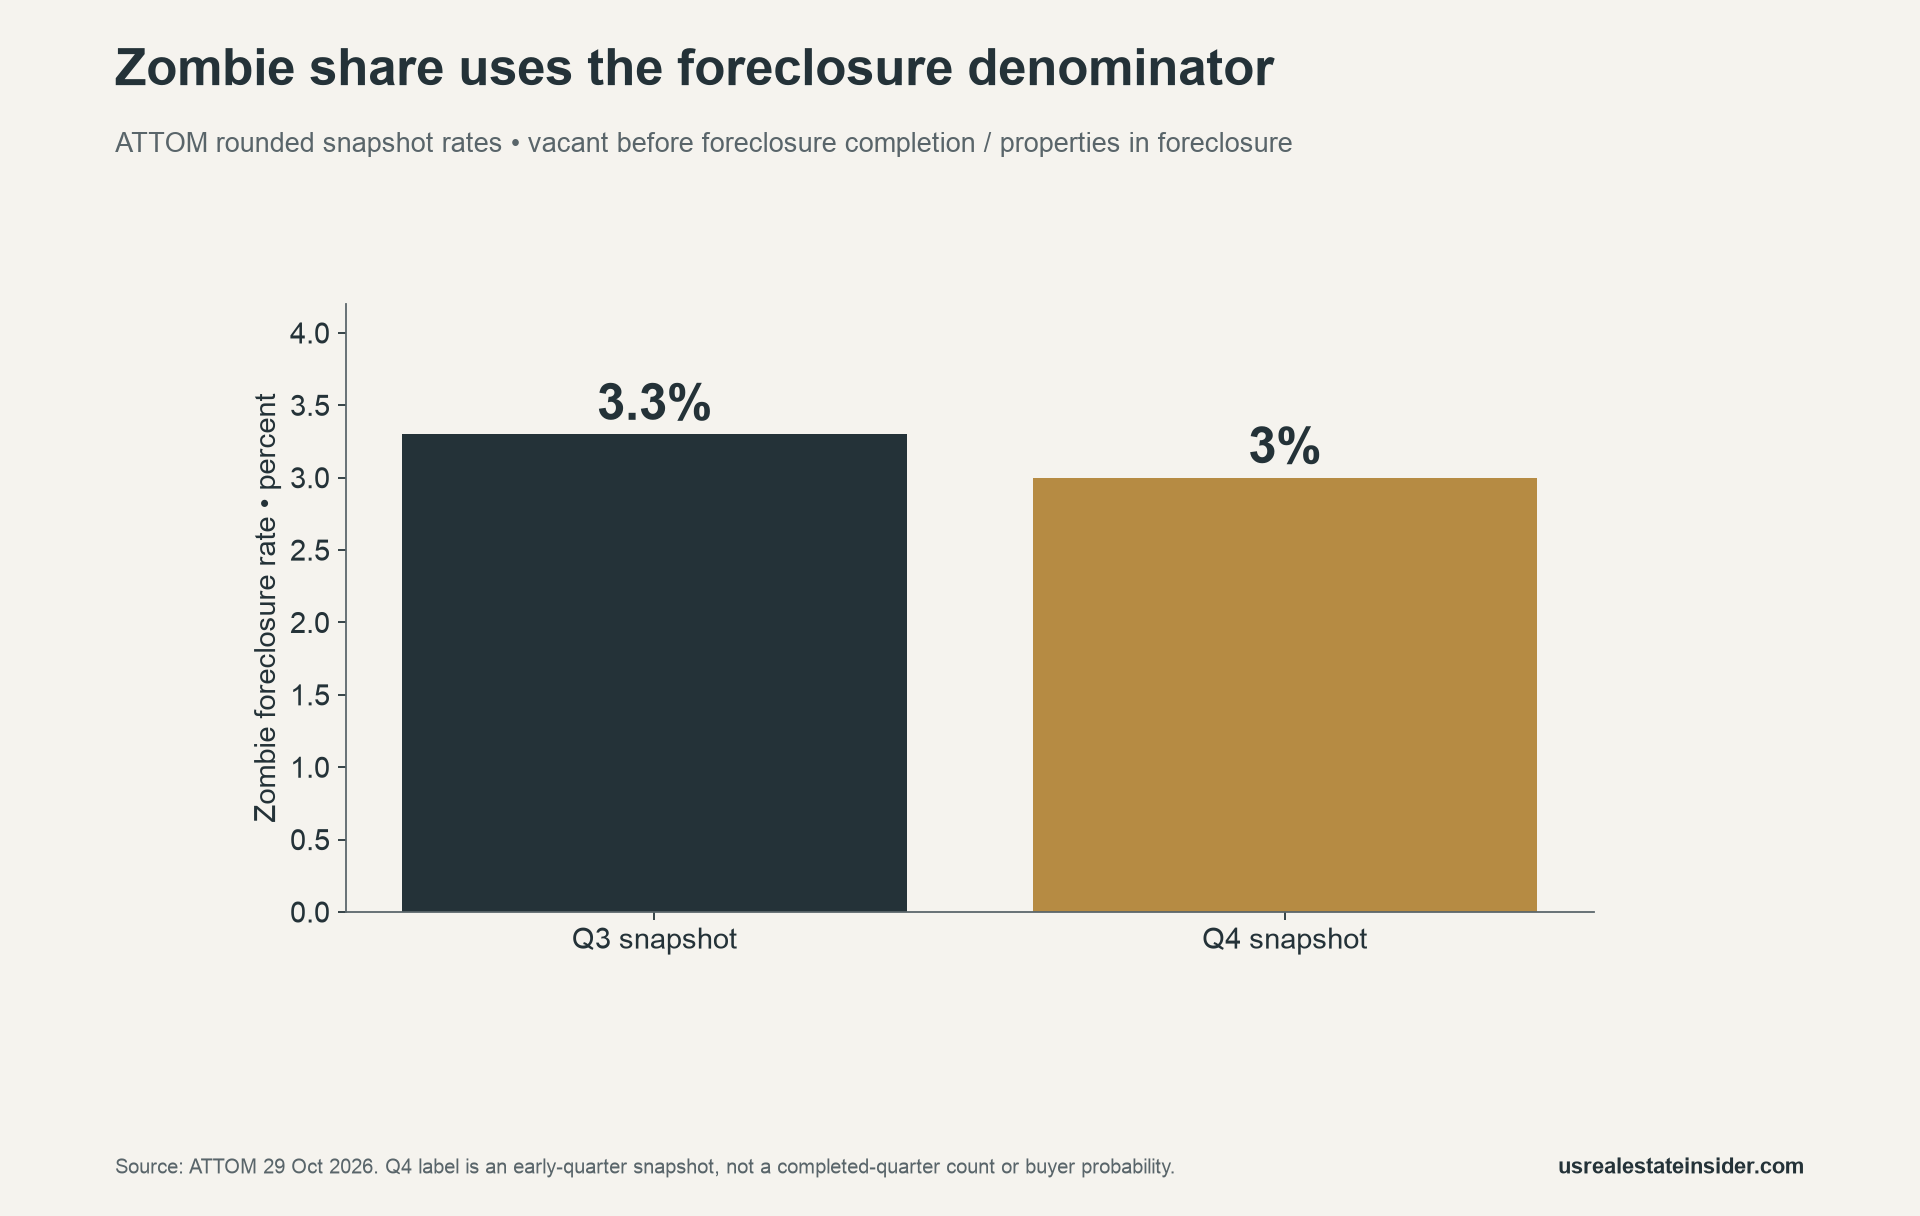
The source’s rounded zombie share fell from 3.3% in the preceding snapshot to 3%. Its overall vacancy rate moved from 1.3% to 1.2%. Those percentages use different denominators, so they should not be subtracted to infer another property category.
ATTOM matches assessor and property records with monthly updated vacancy information. That process does not mean an inspector entered every analyzed home. Administrative and vacancy signals can lag current circumstances, so an individual property still needs current verification.
Build an evidence file before assessing an opportunity
Start with a private candidate identifier, rather than publishing an owner-targeting list. Record the vacancy indication and its date. Next, obtain appropriate evidence for the recorded owner, the documented stage of any proceeding and the person or entity claiming authority to sell.
Then record the actual filing dates and the source you checked. A listing description, a vacancy flag and a title document serve different purposes. If records conflict, mark the conflict and the next question. Do not resolve it by assuming that the most convenient label is correct.
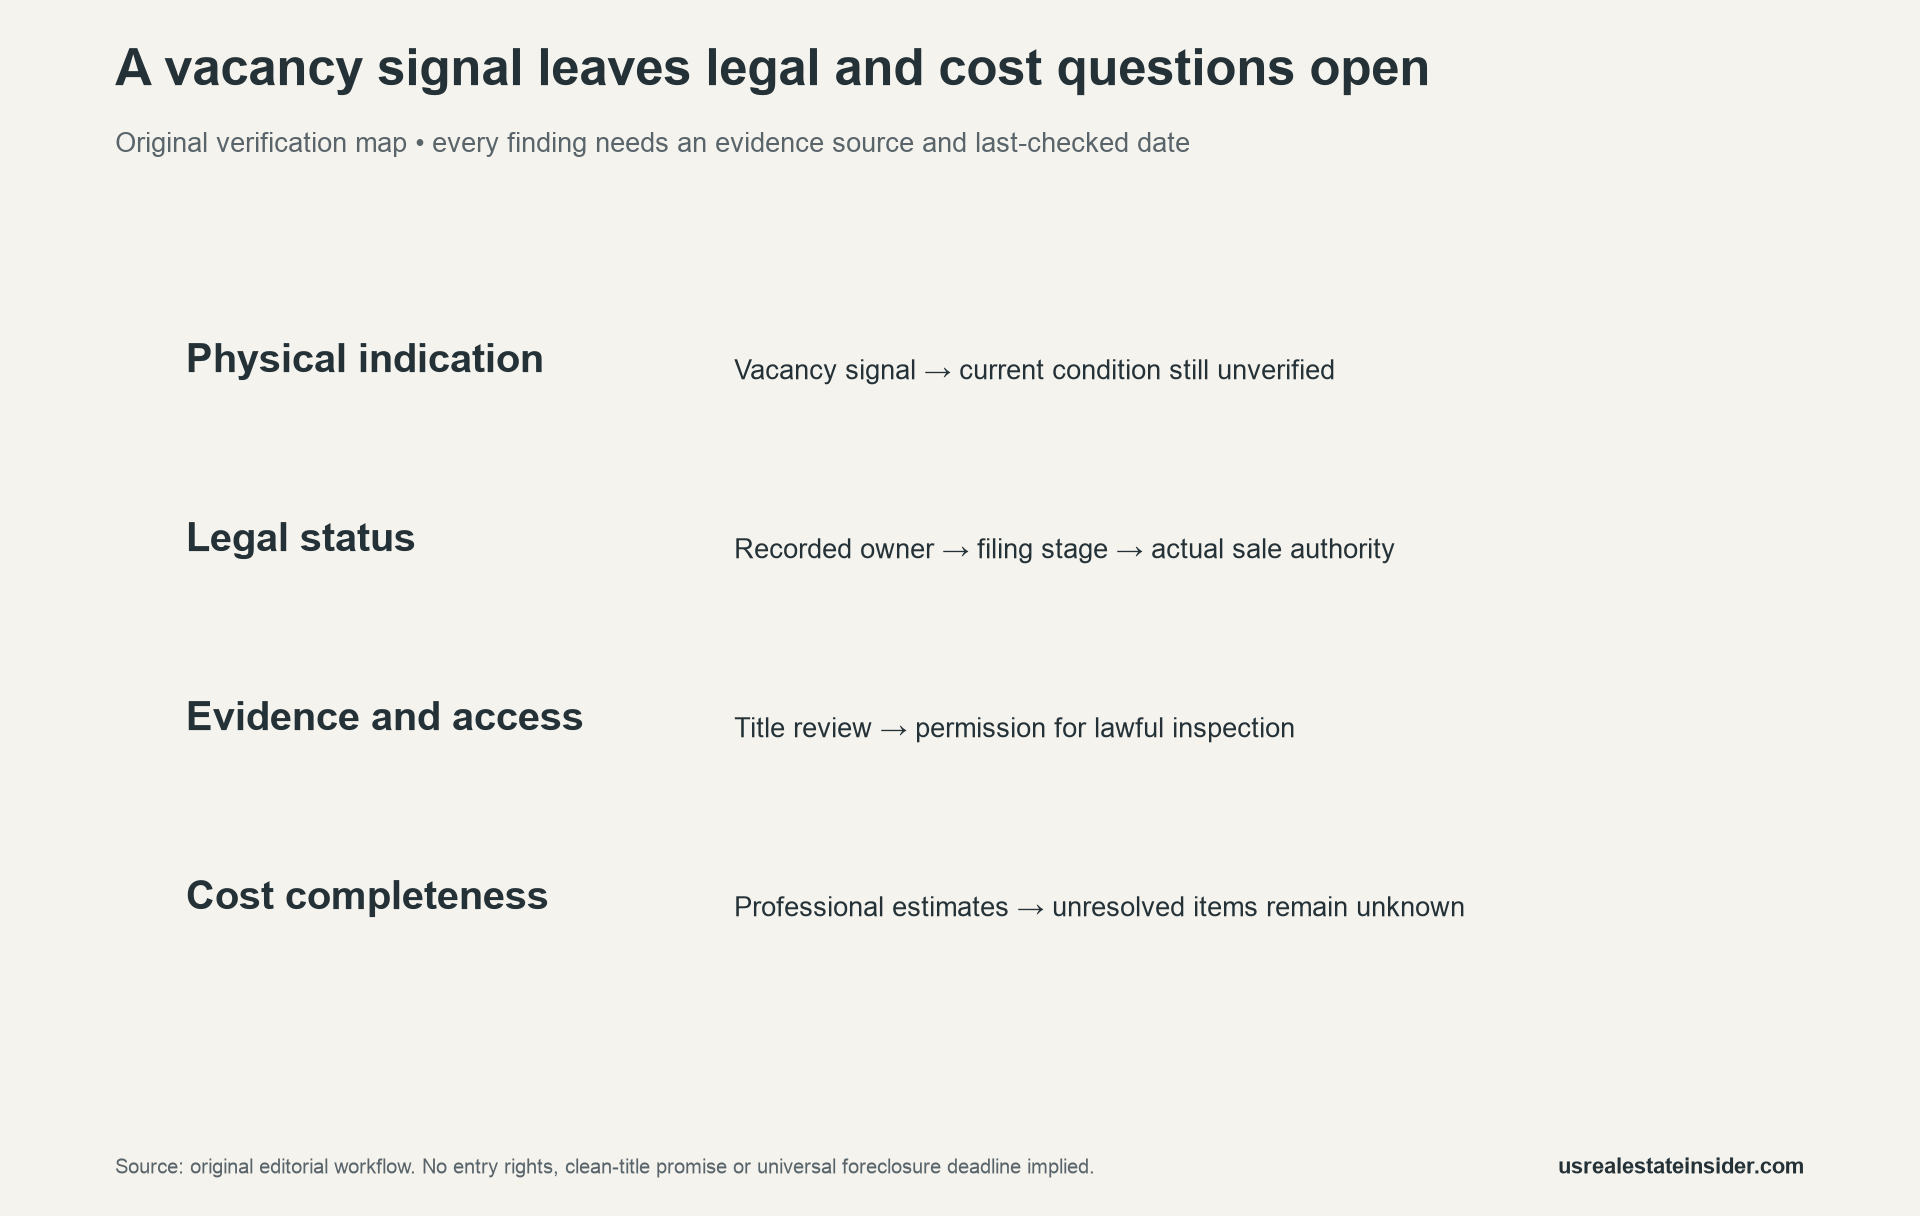
Our status worksheet separates nine evidence fields. Every field has space for the finding, source, last-checked date, responsible professional and follow-up. The starting finding is “not verified.” This makes missing evidence visible instead of disguising it as a clean result.
Verify title, authority and lawful access locally
Ask an appropriate local title professional or lawyer to review the relevant records and unresolved claims. Procedures and rights depend on the jurisdiction and the actual documents. This article does not provide a universal foreclosure deadline, determine redemption rights or interpret a particular agreement.
Likewise, obtain permission before an inspection or entry. A vacancy indication does not grant access. If lawful inspection cannot be arranged, record the limitation and its effect on the quality of any repair estimate. Do not turn an exterior impression into a verified interior condition report.

A useful professional question is specific: which record establishes the claimed sale authority, what date does it reflect, and what remains unresolved? Keep the answer with the evidence file. Avoid collecting or distributing unnecessary personal information about borrowers or occupants.
Separate missing costs from a complete scenario
The blank cost screen asks for purchase price, professional repair estimates, carrying time and monthly carrying costs. It also separates taxes, insurance, selling costs and contingency. Record whether an item is already included elsewhere to prevent double counting.
An empty cost field means the estimate is incomplete. It does not mean the cost is zero. Obtain an appropriate quote or estimate, record its scope and date, then explain any exclusions. The national vacancy report supplies none of these property-specific inputs.
Reproduce a hypothetical cost sensitivity
For illustration only, assume a $200,000 purchase, $40,000 repairs and six months of carrying costs at $1,250 monthly. Here, the carrying figure includes property taxes and insurance. Add $7,500 selling costs and $5,000 contingency, producing $260,000 in included costs.
| Invented input | Amount |
|---|---|
| Purchase | $200,000 |
| Repairs | $40,000 |
| Six months × $1,250 carrying | $7,500 |
| Selling costs plus contingency | $12,500 |
| Total included cost | $260,000 |
| Assumed exit proceeds | $300,000 |
| Residual before excluded items | $40,000 |
The $40,000 residual is not profit or an investor return. Debt costs, income taxes and other excluded items can change the outcome. Nor does the assumed exit amount establish achievable proceeds. This narrowly defined scenario is a way to inspect assumptions.
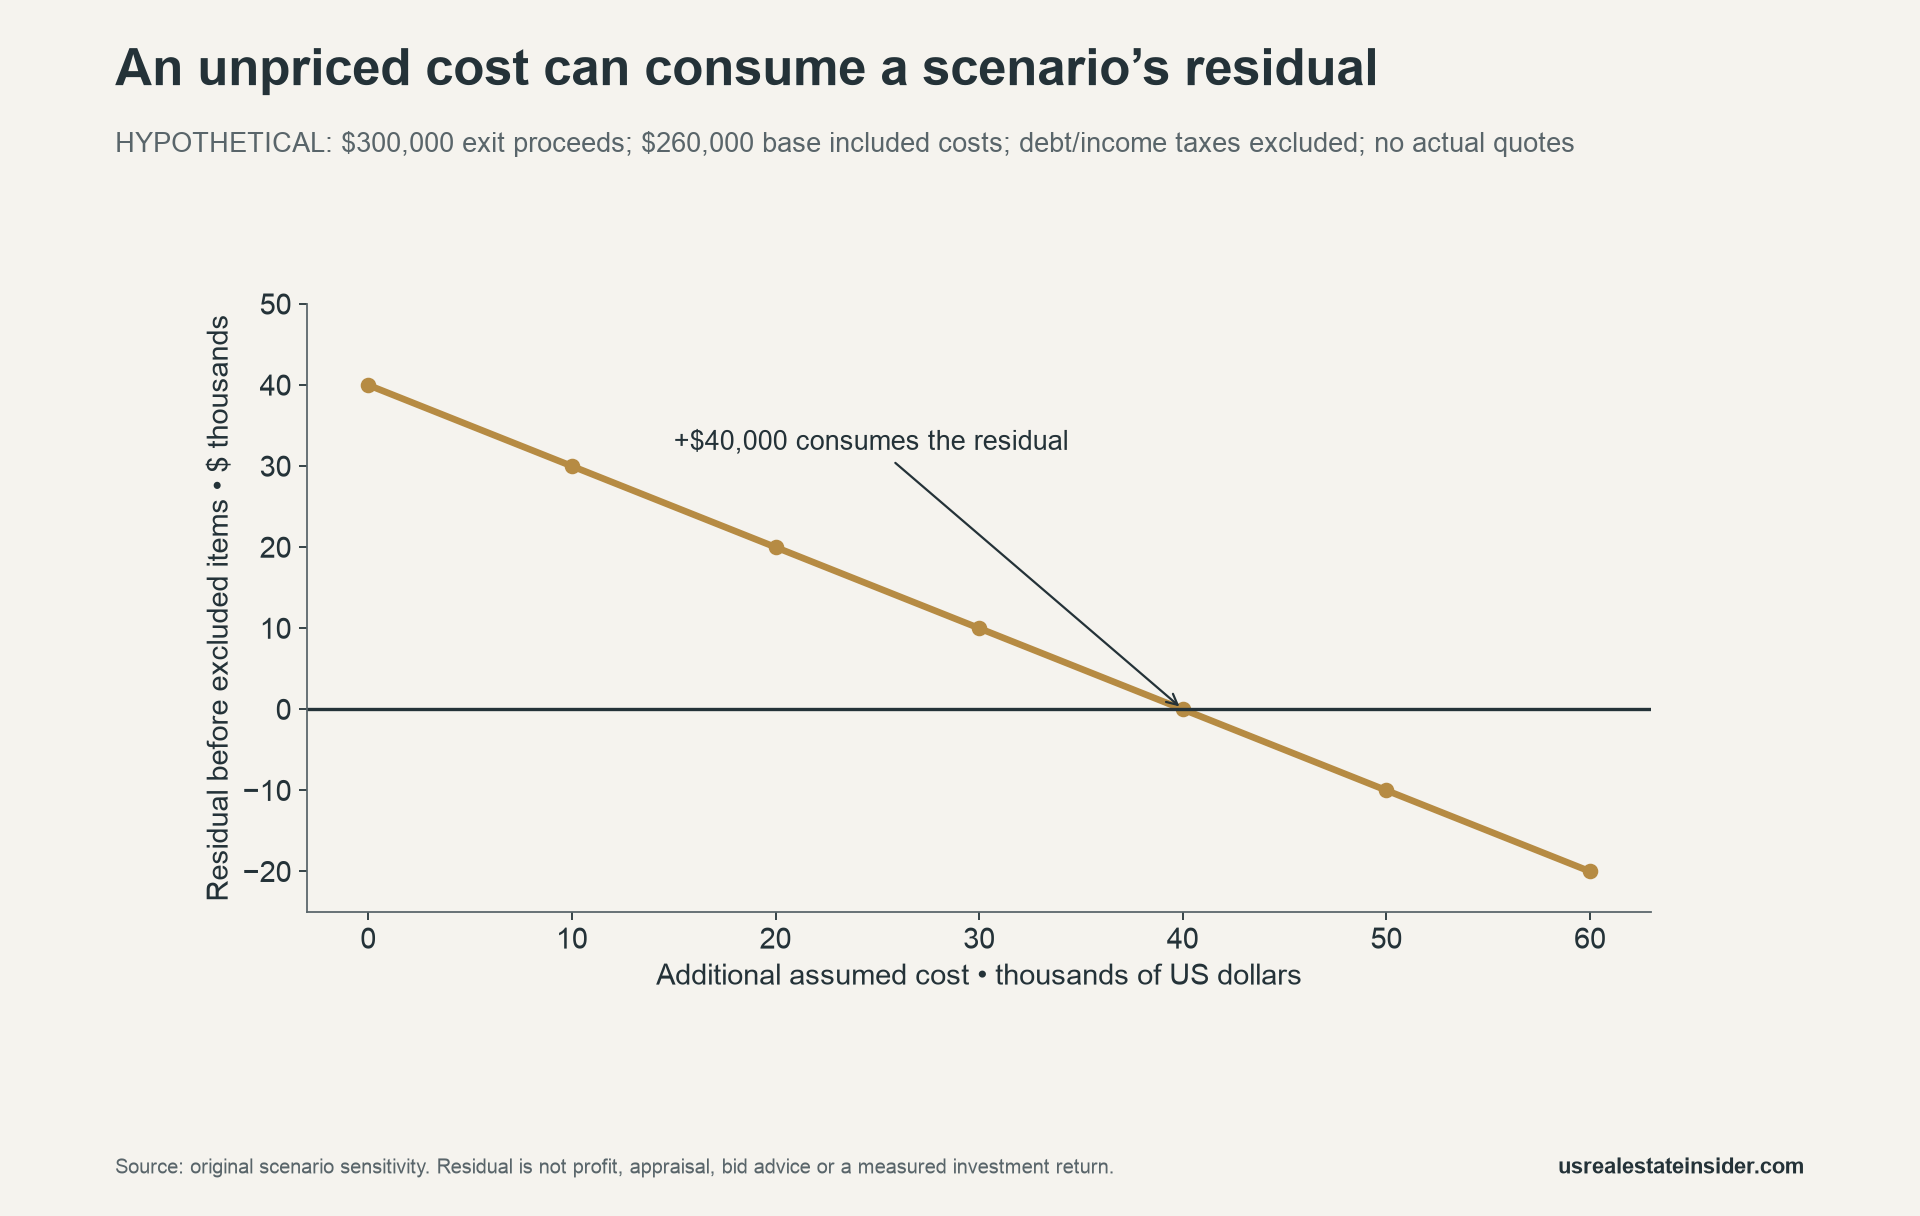
Holding the invented exit amount fixed, an additional $10,000 of costs reduces the residual to $30,000. An additional $40,000 consumes it entirely. These are sensitivity points, not estimates that any particular repair will cost those amounts.
Download the audit trail and blank tools
The dated vacancy release snapshot (CSV) preserves the counts, rates, units and denominators. Recalculate the zombie ratio by dividing 8,040 by 269,195 and multiplying by 100; round only the final result.
Use the blank status-verification worksheet (CSV) to track evidence. The blank property cost screen (CSV) deliberately leaves all amounts empty. The hypothetical cost sensitivity (CSV) retains every assumption behind Figure 5.
Method, limitations and related evidence
US Real Estate Insider retained ATTOM’s dated release and used decimal arithmetic for the original ratio and cost checks. The count hierarchy is not drawn to scale. We do not infer a precise all-property zombie share from the rounded universe, and we do not publish address-level targets.
Reject a confident deal conclusion when material authority, title, access or cost evidence remains unresolved. That is an evidence-quality rule, not a recommendation about a named investment. Appropriate local professional review remains necessary for the actual property and documents.
Our investor-share research explains another denominator problem. For valuation evidence, see the FHFA index and sale-price median comparison. Neither national measure substitutes for a lawful, property-specific evidence file.
Suggested citation: US Real Estate Insider, “Zombie Foreclosure vs Vacant Property,” 2 November 2026. Cite ATTOM for its snapshot and this article for the original calculations, verification map and reusable worksheets.


