



Columbia industrial space vacancy is a market indicator, not a list of buildings that fit your operation. A warehouse can be available and still fail a non-negotiable requirement. Our Q3 source comparison and fictional shortlist separate aggregate supply, physical suitability and occupancy obligations.
What the Columbia industrial space vacancy figures measure
CBRE’s 13 November 2026 Columbia report puts overall Q3 vacancy at 4.2%. Class A was 2.2%, Class B 5.3% and Class C 4.2%. Those rates describe segments of the reported market. They do not verify a particular building’s ceiling, power supply or readiness today.
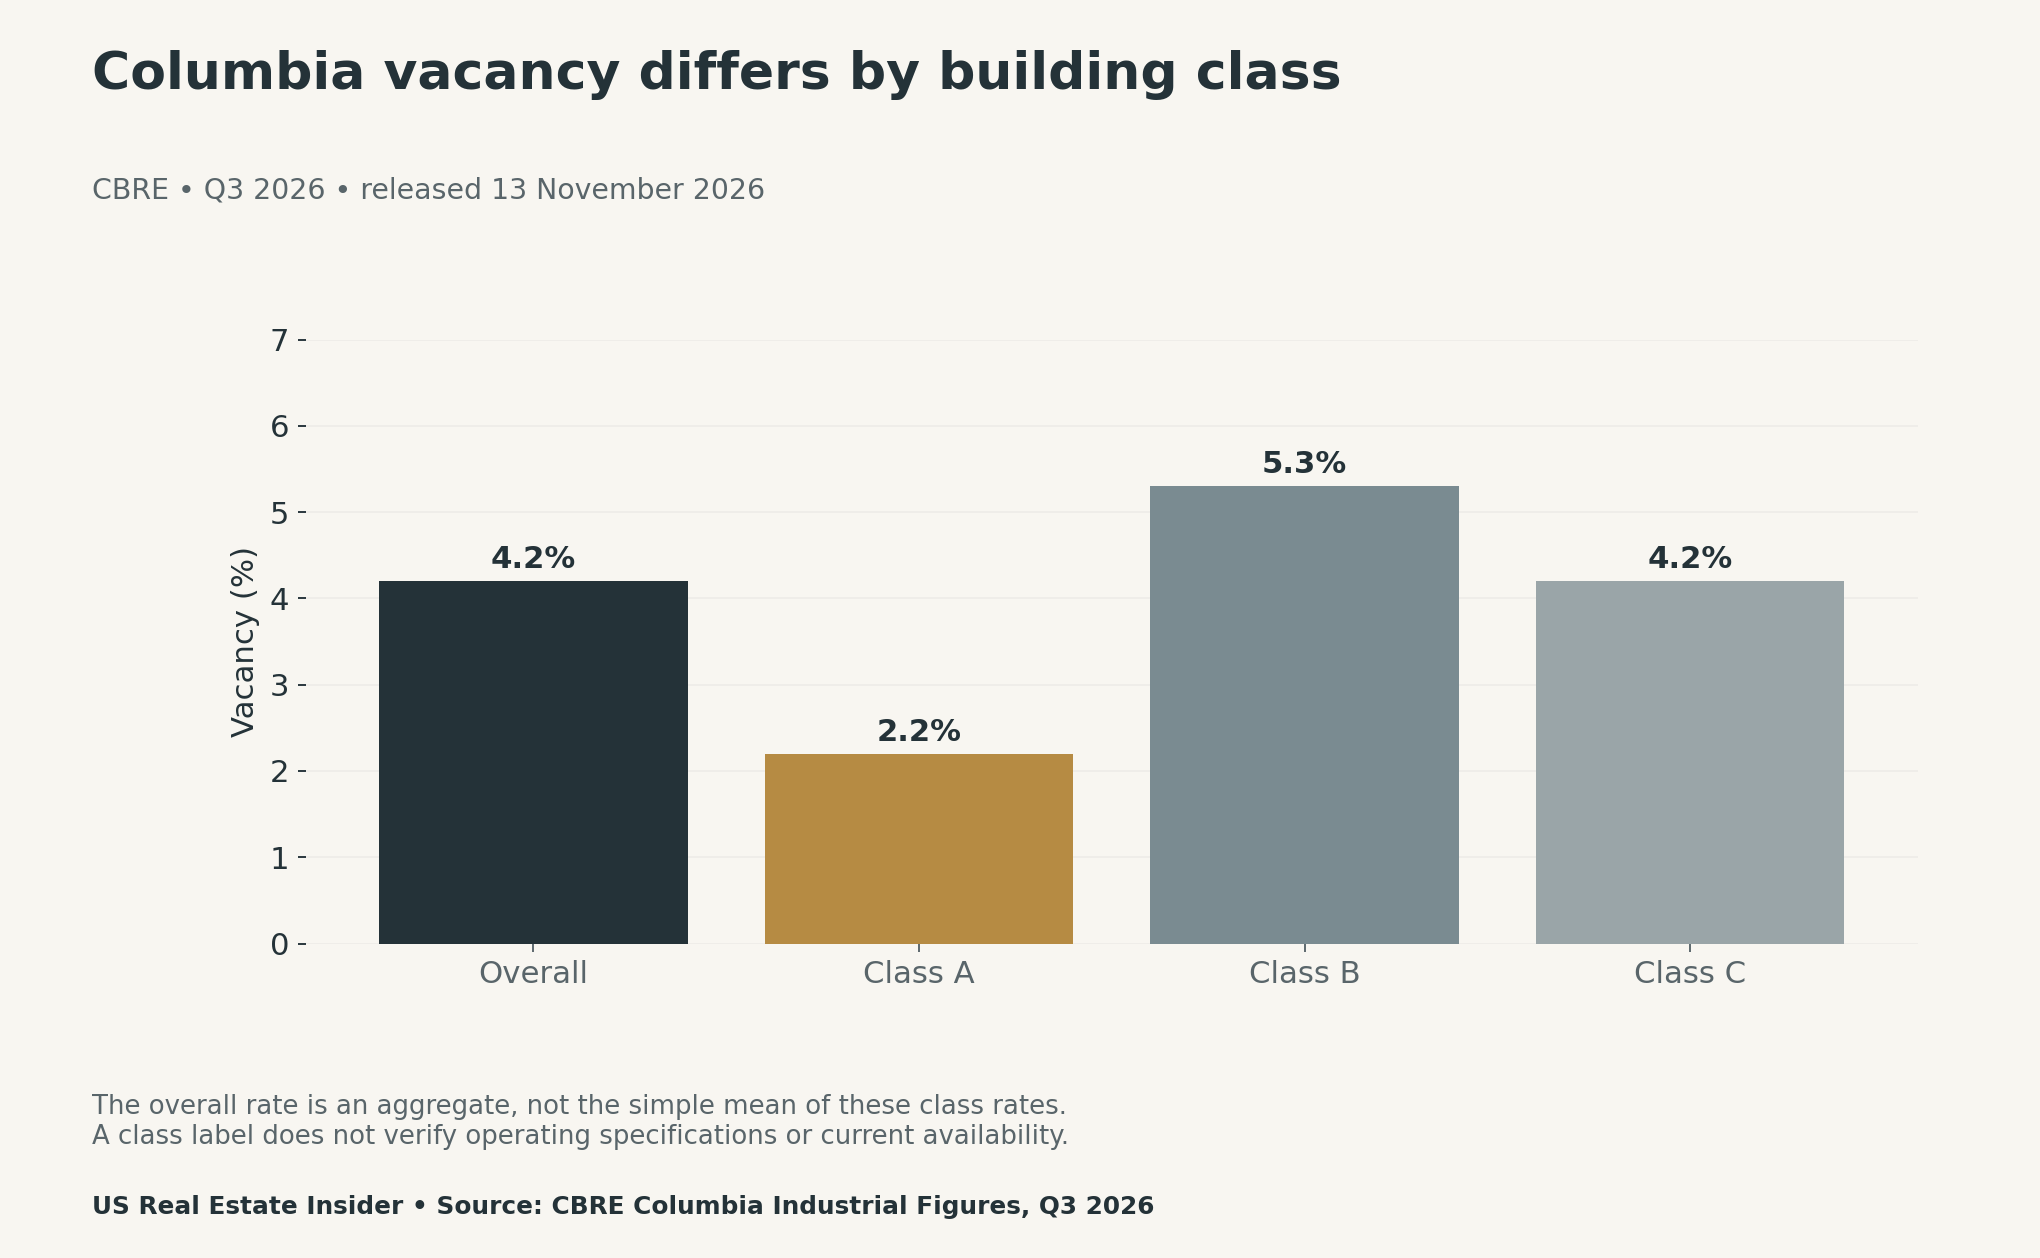
Treat the report’s date and reference period separately. A November publication can describe a quarter that has already ended. In addition, a class designation is a broad label, not proof that a specific property satisfies your specifications. Ask for current dated evidence before treating a building as an option.
Net absorption describes a change, not a stock of choices
Using CBRE’s rounded figures, Northeast Columbia and Kershaw County account for 282,000 of 367,000 square feet of net absorption. Our calculation is 282,000 ÷ 367,000 × 100, or about 76.8%. The remainder is 85,000 square feet. This is a net-change comparison, not the share of available buildings.
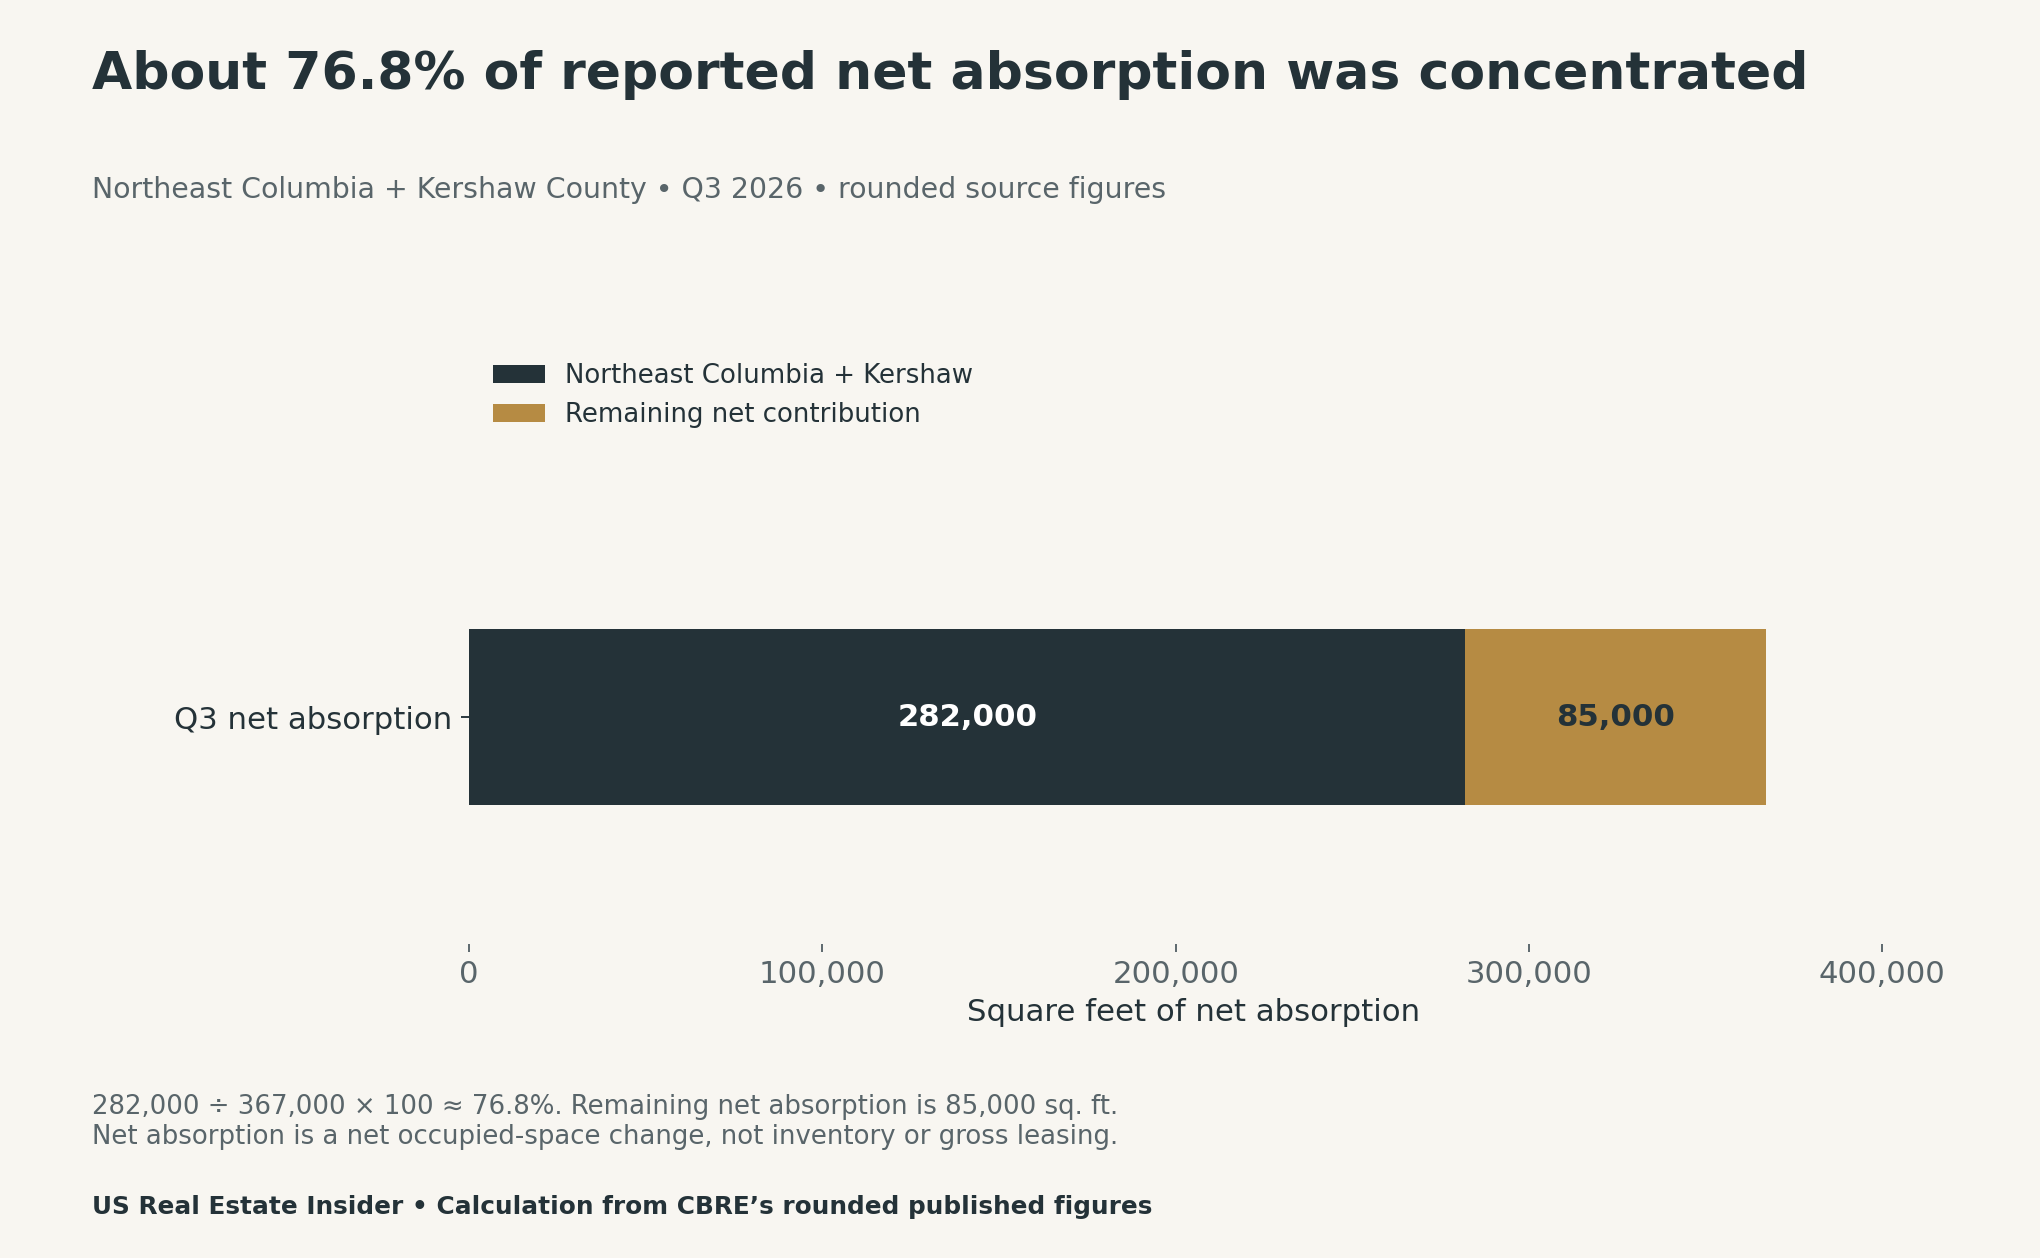
Keep stock, net change and transaction activity in separate worksheet columns. Otherwise, a positive absorption number can be mistaken for space you can lease. A building search needs current listings and property evidence, rather than an assumption that a quarterly movement creates a matching shortlist.
Define requirements before looking at the cheapest building
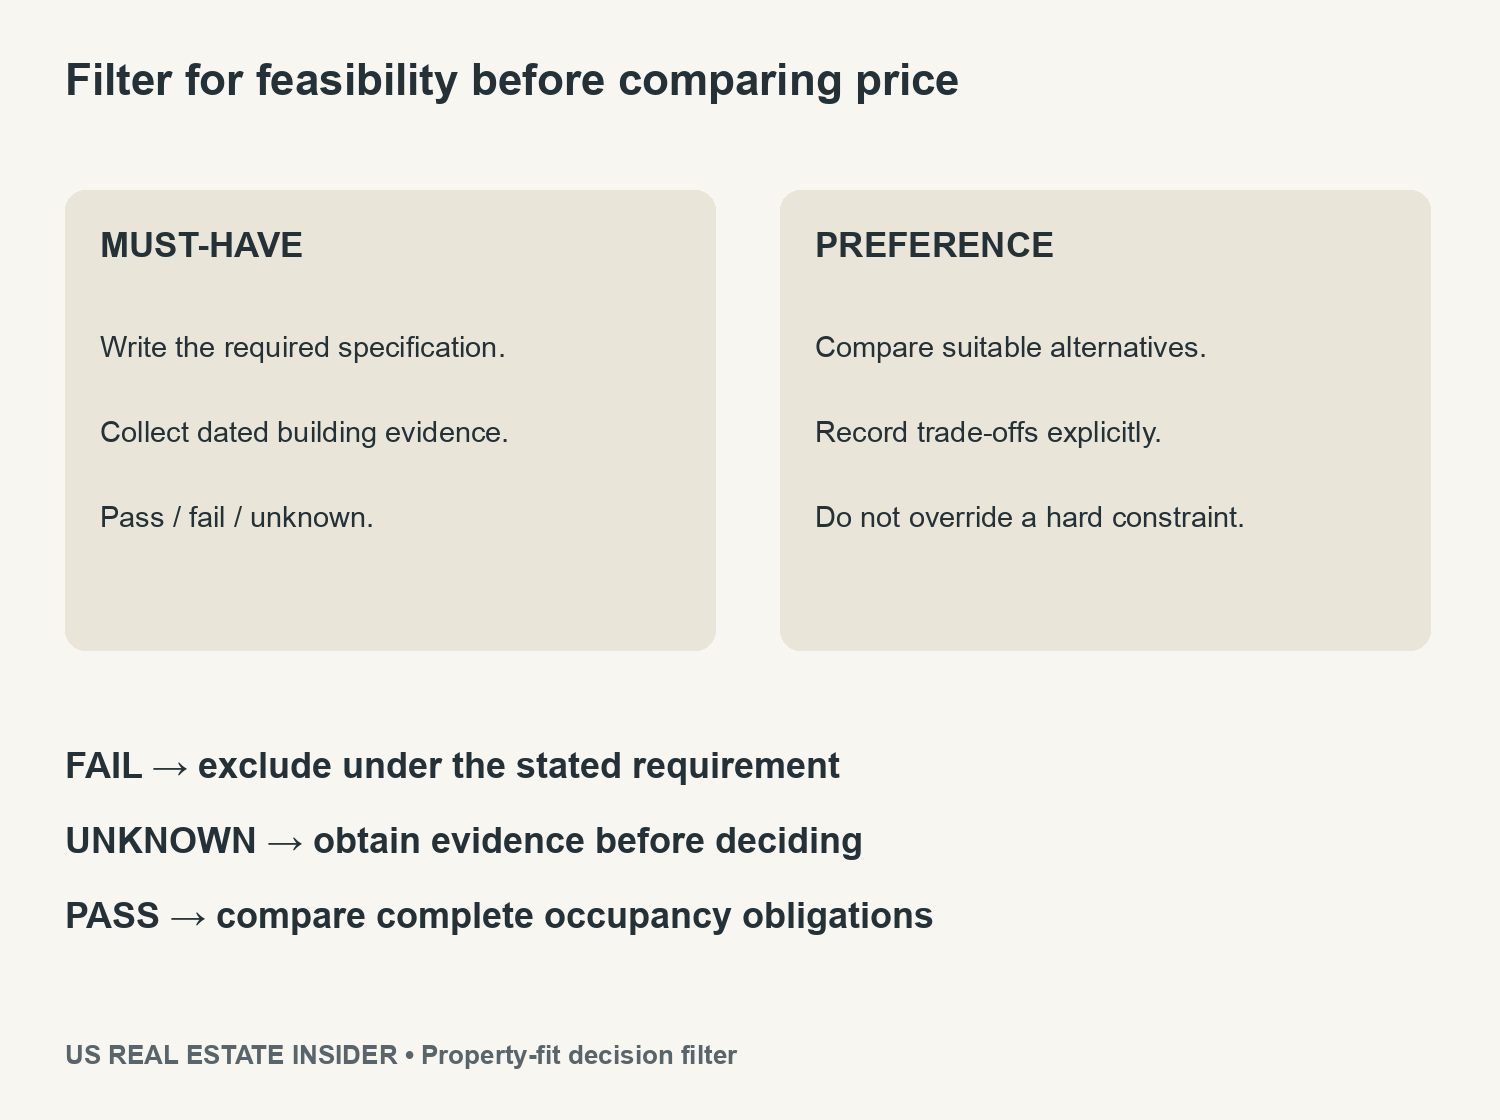
Write the operating requirements first. The worksheet covers clear height, loading, power, yard access, floor capacity, permitted use and move-in date. Separate must-haves from preferences. A hard constraint needs an explicit specification and a source that can verify it.
For example, a fictional operation requires at least 28 feet of clear height. That threshold is an editorial assumption, not a building-code rule or an industry-wide recommendation. A building below it fails this operation’s screen even if its base rent looks attractive.
Screen three fictional industrial properties
Building A has a fictional $6,000 monthly base rent and 22-foot clear height. By comparison, Building B is $7,200 with 30 feet. The third candidate, Building C, is $6,800 with 28 feet, but its power and move-in evidence remain unresolved. These are invented buildings and prices, not current Columbia listings.
| Fictional building | Height / base rent | Result under stated assumptions |
|---|---|---|
| A | 22 ft / $6,000 monthly | Fails the 28-foot minimum |
| B | 30 ft / $7,200 monthly | Passes the supplied fictional screen |
| C | 28 ft / $6,800 monthly | Power and move-in remain unknown |
The example does not label B the best real-world choice. It shows that A’s lower rent cannot cure a failed requirement, while C needs more evidence. A real shortlist also needs inspections and appropriate technical, legal and local planning checks for the proposed use.
Compare occupancy obligations after the fit screen
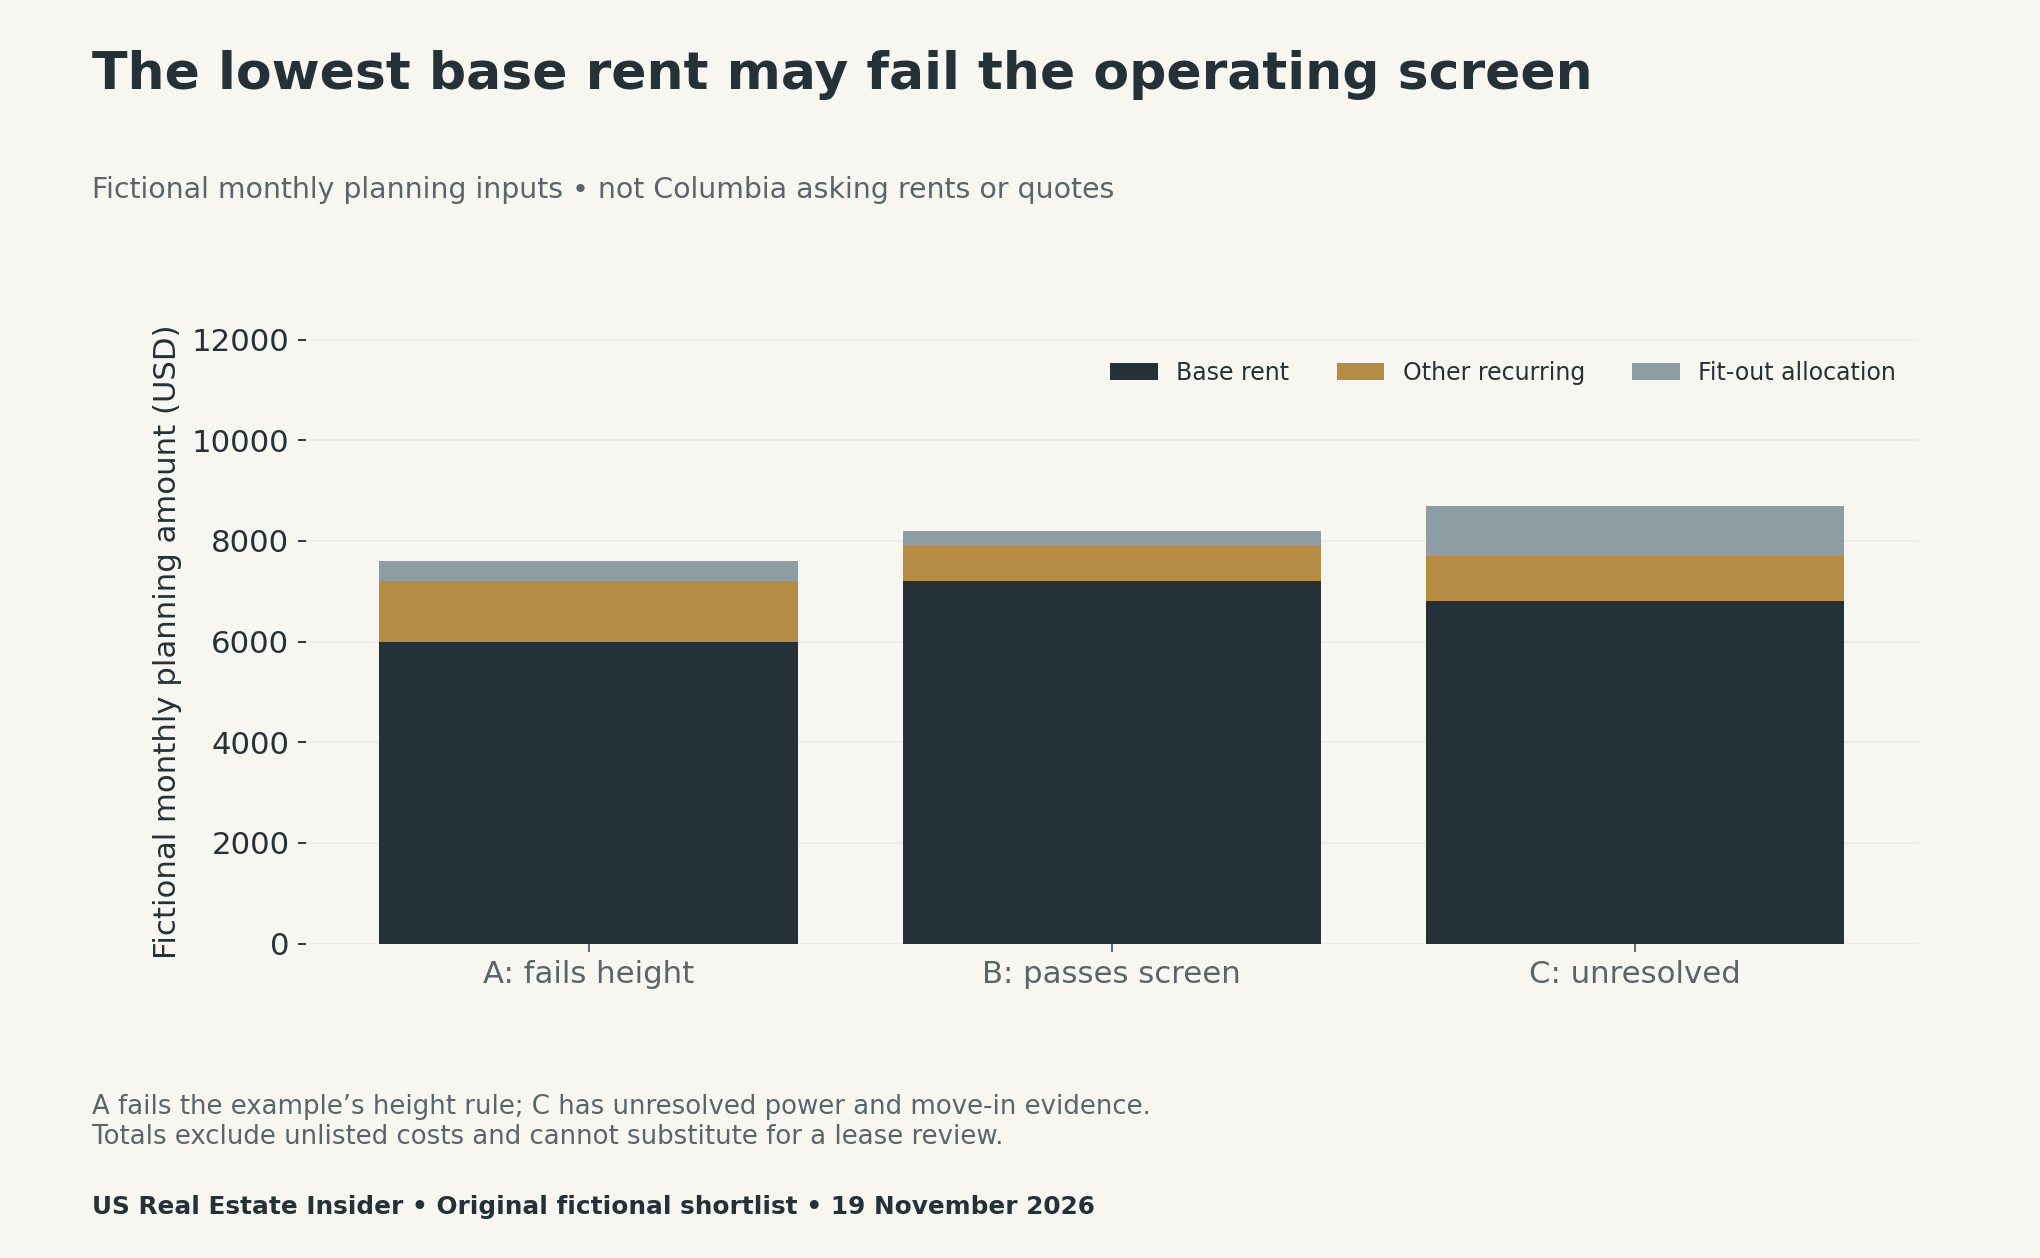
Our fictional cost table adds other recurring amounts and a monthly fit-out planning allocation. The totals are $7,600, $8,200 and $8,700. These inputs illustrate how a rent-only ranking can conceal other obligations. They do not estimate market rents, tenant-improvement costs or returns.
For a live decision, ask which expenses are included in the proposed lease and which remain the tenant’s responsibility. Record the period, escalation terms, utilities, maintenance obligations, fit-out timing and unresolved items. Use comparable time horizons rather than adding a one-time cost to a monthly amount without conversion.
Keep the search evidence current
Put the source and verification date beside every material specification. A brochure statement, a landlord response and an independent technical confirmation are different evidence types. Record who verified what, without treating an attractive listing image as proof of power capacity or permitted use.
When information changes, retain the earlier snapshot and update the relevant field. This helps an occupier see whether a candidate became unsuitable or merely needs a new check. The blank worksheet supports that process without assigning invented availability probabilities.
Download the source measures and property-fit tools
- Selected CBRE measures with reference period and source (CSV)
- Fictional three-building suitability screen (CSV)
- Fictional recurring costs and fit-out planning allocation (CSV)
- Blank industrial property-fit worksheet (CSV)
Our median-versus-value comparison covers another aggregate-versus-property distinction. Browse the Commercial Real Estate archive for related operational questions.
Methodology and limits
We checked CBRE’s first-party Q3 report on 19 November 2026. Selected vacancy and net-absorption measures retain their units and source date. The concentration percentage is our calculation from rounded inputs, not a separate survey estimate or a claim about gross leasing.
The shortlist, operating threshold and occupancy-cost inputs are fictional teaching assets. No property inspection, availability confirmation or technical certification took place. The analysis therefore provides a method for asking better questions, rather than a recommendation to lease an identified building.


