







The active listings vs new listings comparison explains an apparent housing-supply contradiction. Realtor.com’s October 2026 report shows active listings up 7.4% from a year earlier, while new listings fell 7.5%. More homes were available even though fewer fresh listings arrived. That can happen because a pool of available homes and the flow entering it answer different questions. To understand your local market, you need to follow both entries and exits, rather than treat either headline as a complete supply diagnosis.
Research date: November 7, 2026. Reporting period: October 2026. Primary release: Realtor.com Economic Research, November 4. Our contribution combines a source-linked regional comparison, a clearly fictional stock-and-flow example and four reusable CSV tools.
Active listings vs new listings: two distinct measures
The October housing report lists 1,183,520 active listings and 357,268 new listings nationally. Its year-over-year comparisons point in opposite directions. These counts should not be added together: some homes newly listed during the month also belong to the available pool measured by the active statistic.
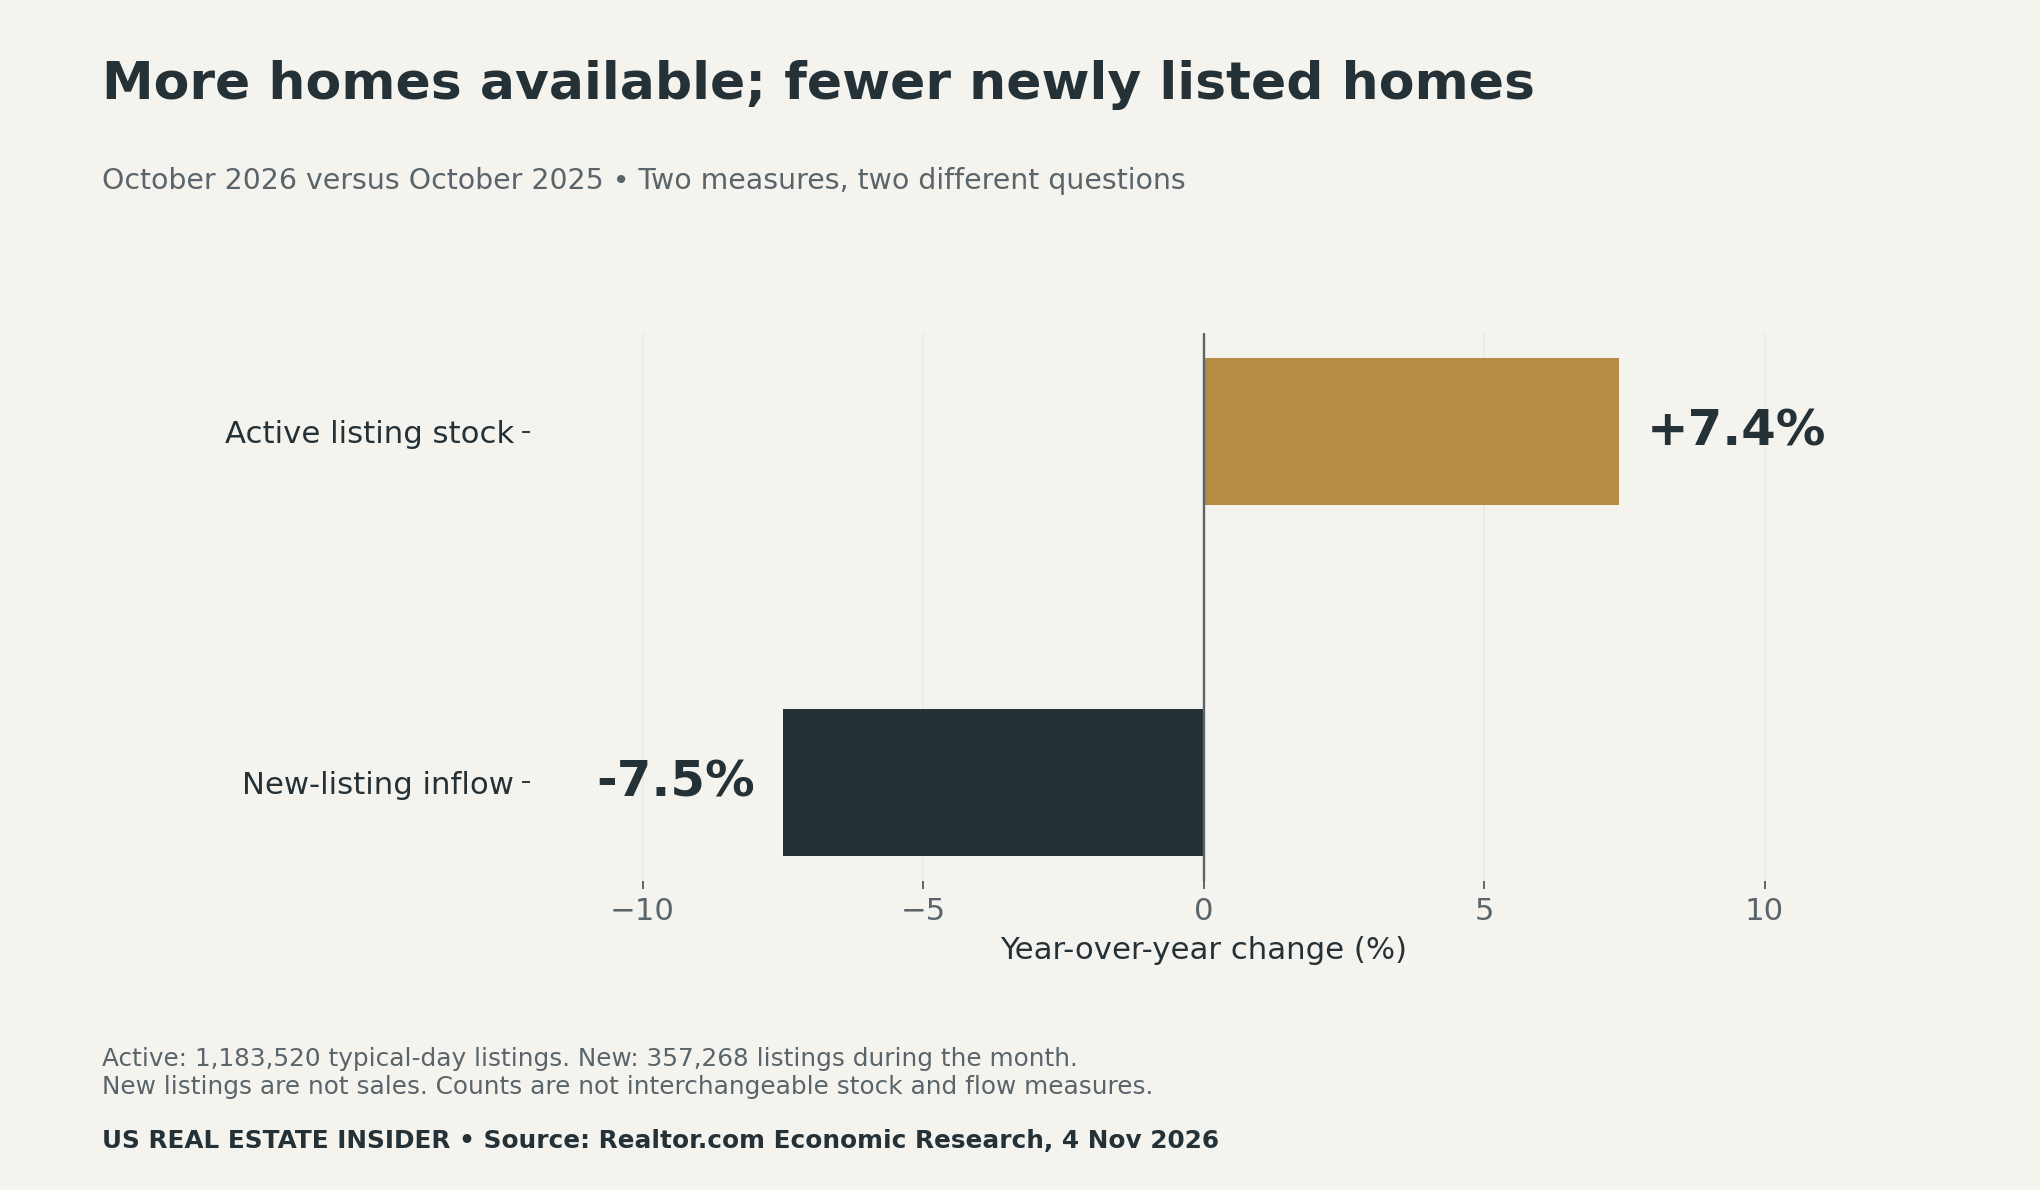
The publisher’s data library and dictionary describes active inventory as a snapshot of the for-sale listings expected on a typical day of the month. Pending listings are excluded where pending status is available. New listings count arrivals during the month. Neither measure is the same as completed sales.
Think of a waiting room. The number of people in the room is a stock. The number arriving over an hour is a flow. Fewer arrivals do not guarantee a smaller room population if departures also slow. The analogy explains the arithmetic possibility; it does not prove why the national listing figures changed. Listing status rules and the observation window still matter.
Regional evidence separates the two directions
All four regions in the report had higher active inventory than a year earlier. However, only the Northeast had positive new-listing growth. The two-axis chart keeps each region’s pair together, so a large active-inventory increase is not mistaken for an equally large increase in incoming sellers.
| Region | Active listings, YoY | New listings, YoY |
|---|---|---|
| Northeast | +16.5% | +0.6% |
| Midwest | +13.8% | −4.8% |
| South | +3.8% | −6.5% |
| West | +9.0% | −10.8% |
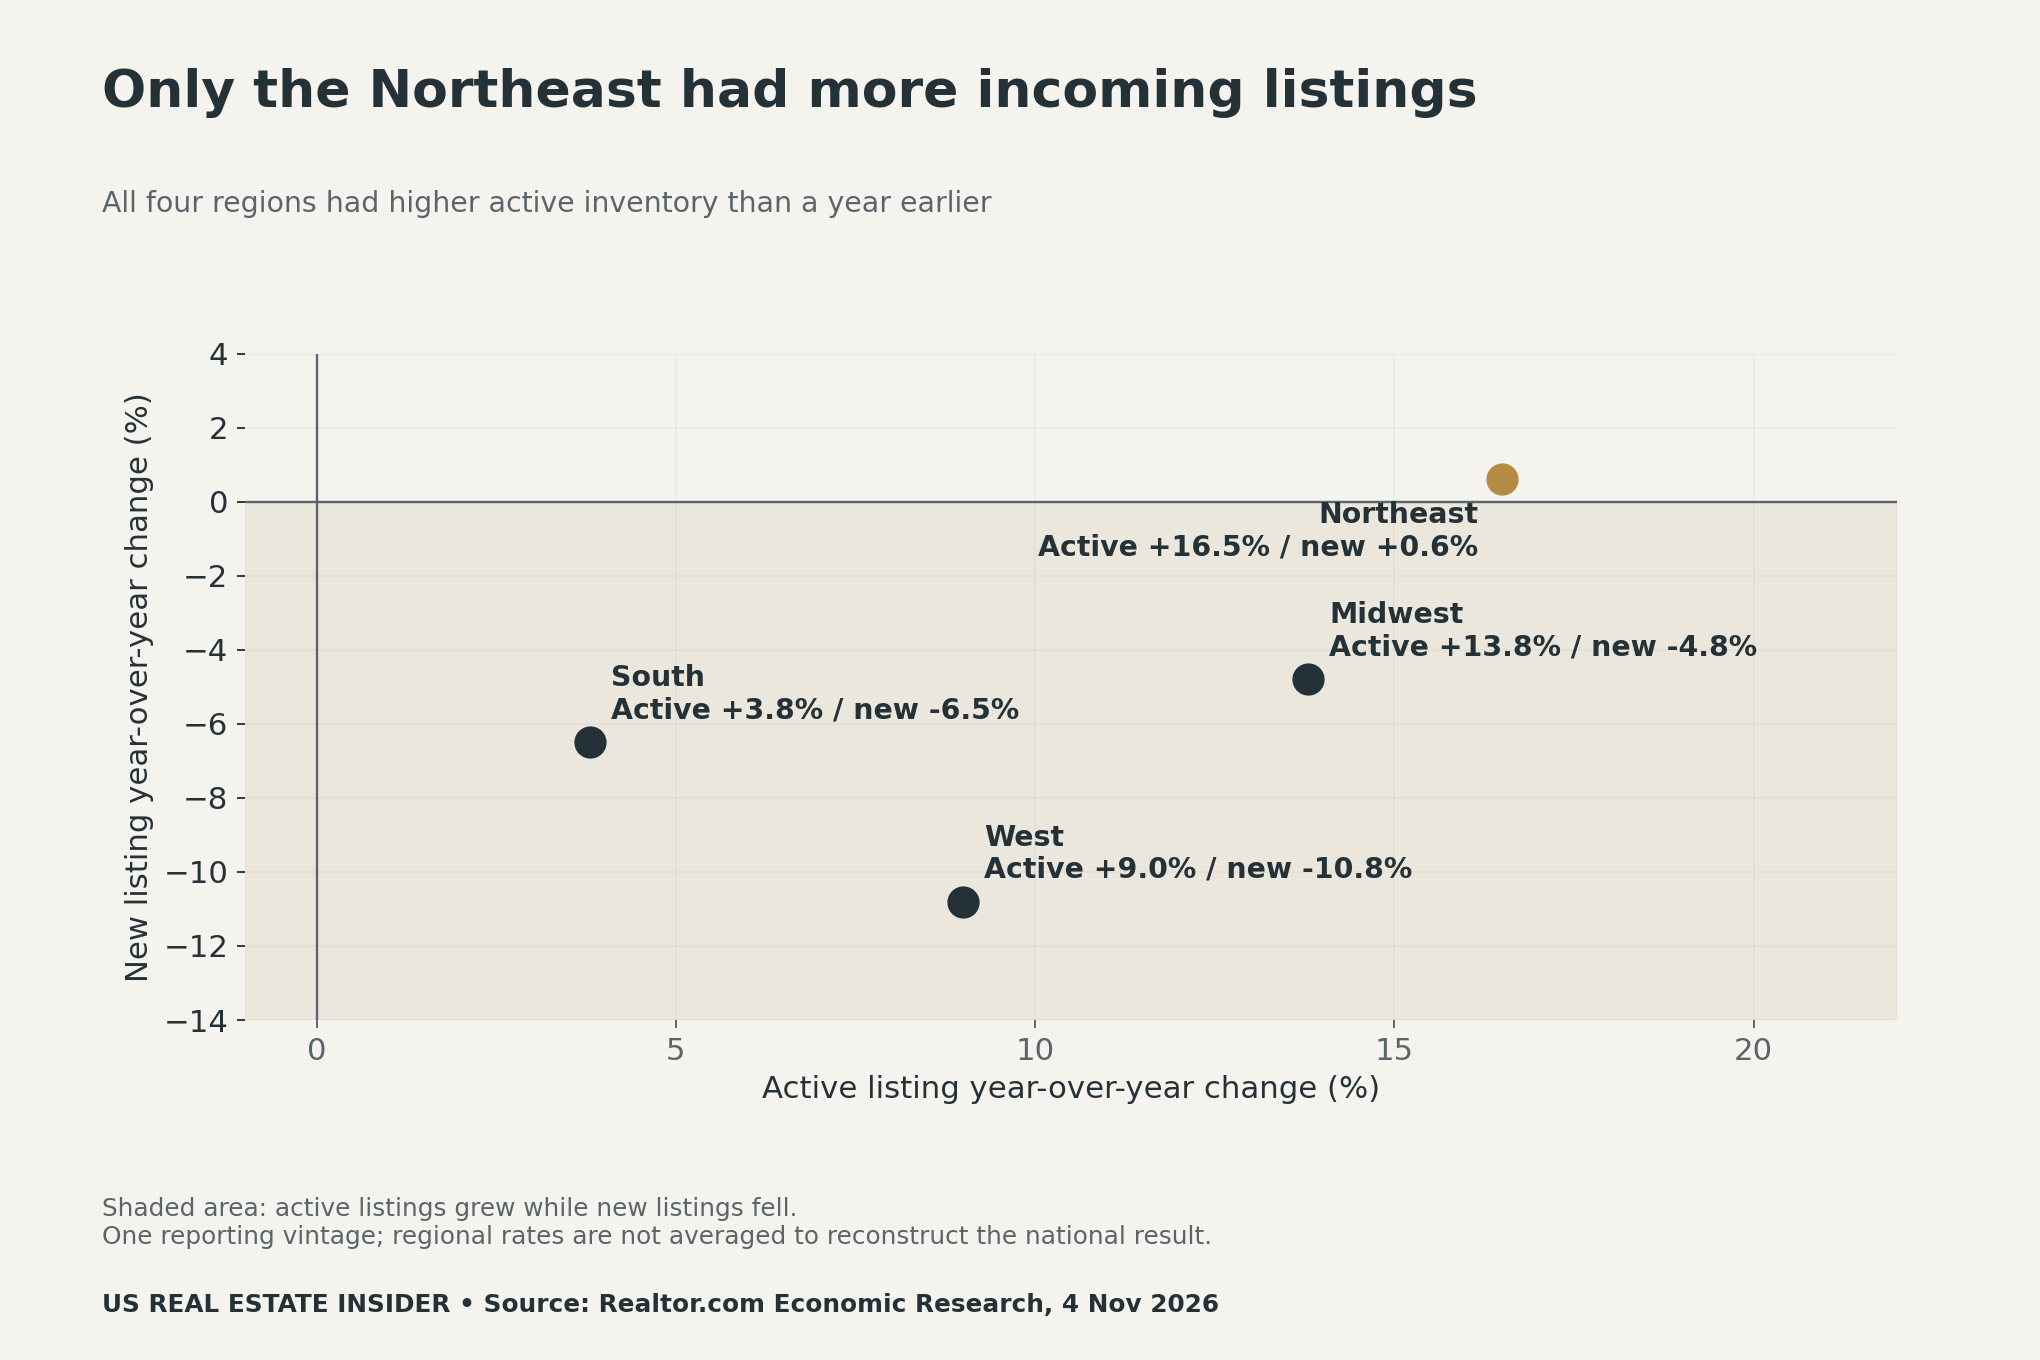
The Northeast’s pair answers a different question from the West’s pair. Yet neither pair tells a buyer that suitable homes are affordable or a seller that a specific price will work. Regional totals cover many neighborhoods and property types. A home can face tight competition within a region whose overall active inventory is growing.
A fictional ledger shows how the pool can grow
Consider two independent teaching scenarios. Both start with 1,000 active listings. In scenario A, 100 listings enter and 80 leave, so the closing stock is 1,000 + 100 − 80 = 1,020. In scenario B, entries fall to 90, but exits fall further to 60. The closing stock becomes 1,000 + 90 − 60 = 1,030.
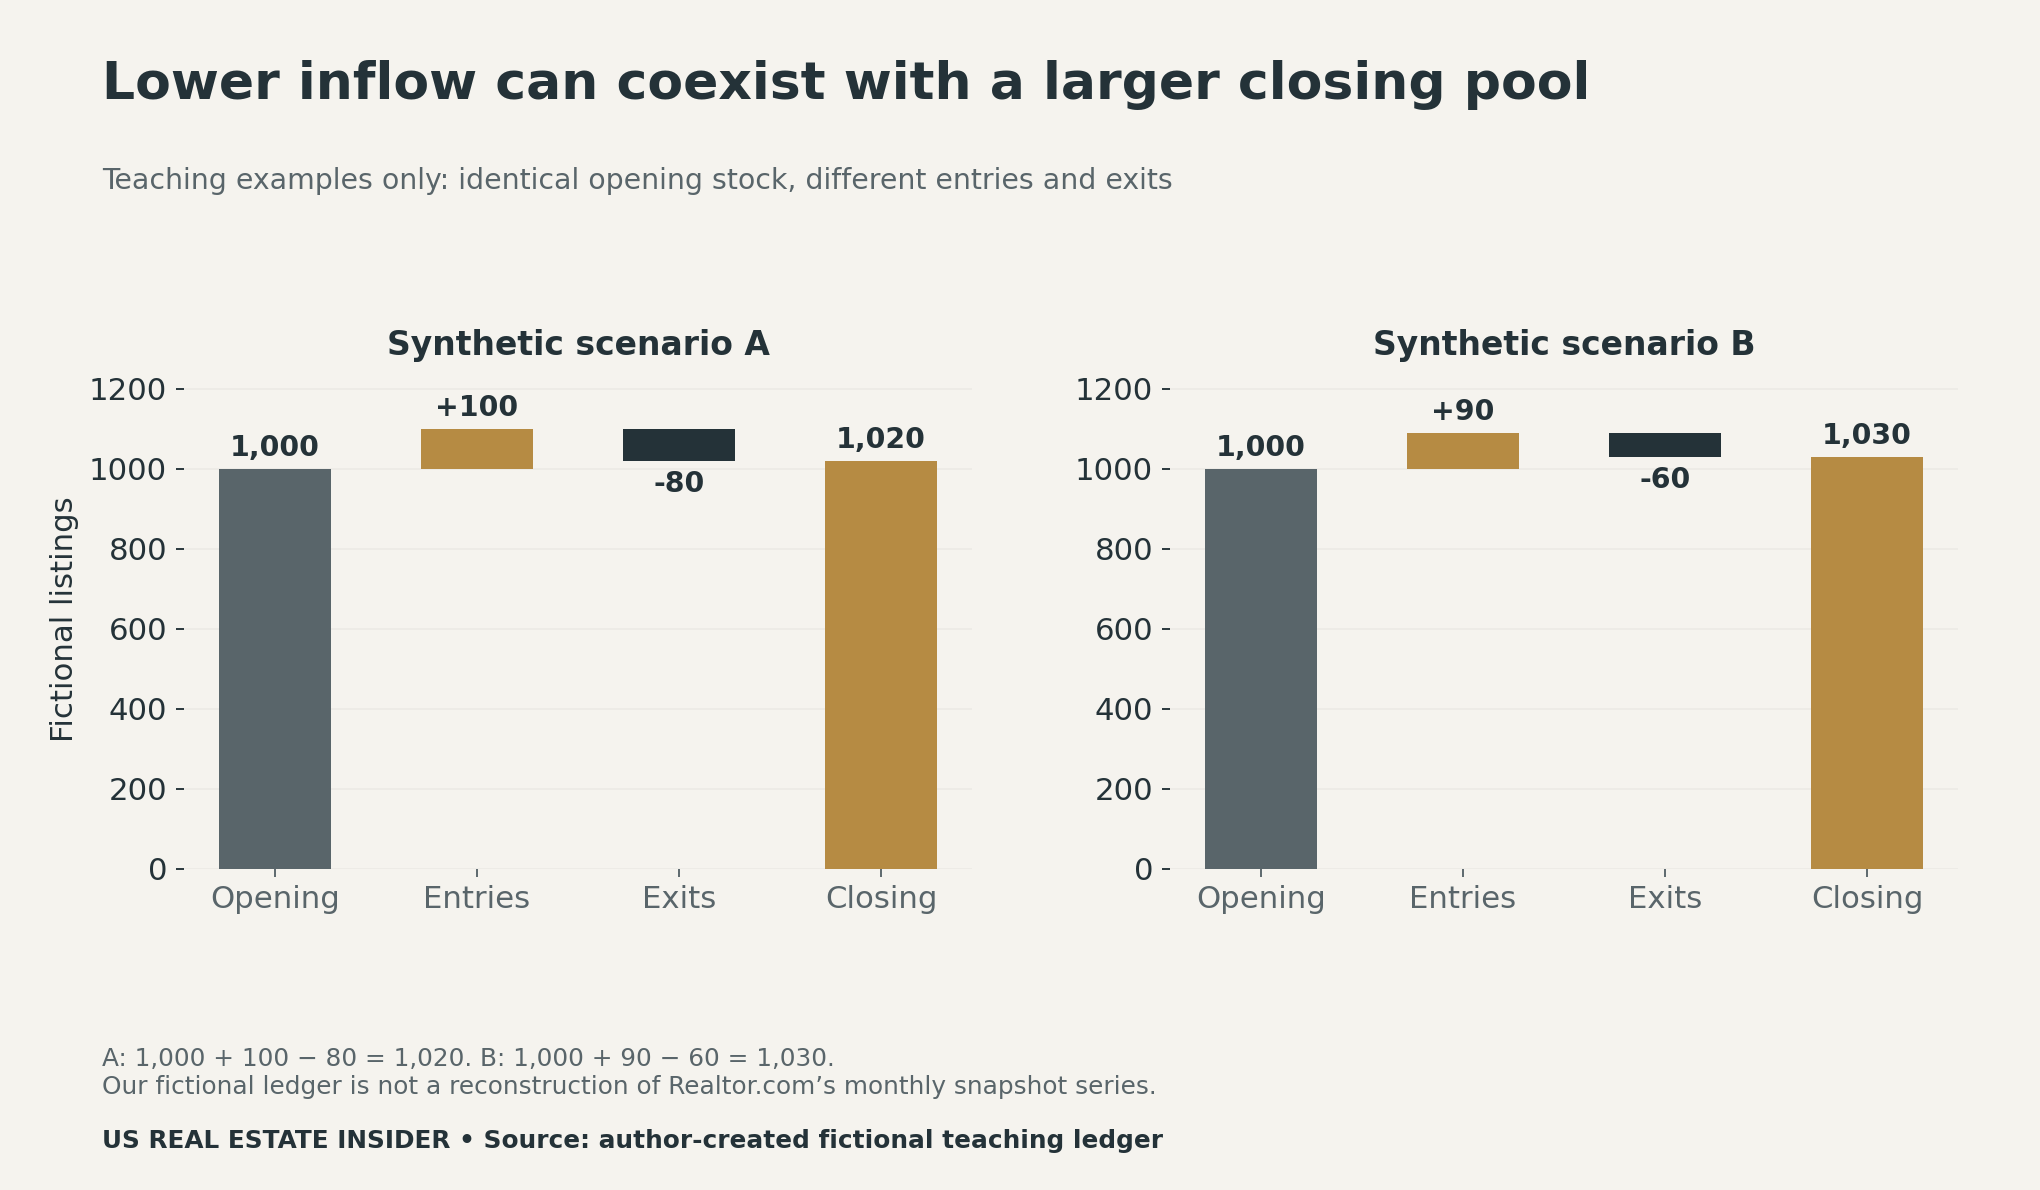
These scenarios are not a reconstruction of Realtor.com’s October dataset. Our ledger uses an explicitly defined opening stock, period entries, period exits and closing stock. The published active statistic is a monthly snapshot measure. You cannot plug its national count into this ledger and infer missing exits without matching the publisher’s timing and status definitions.
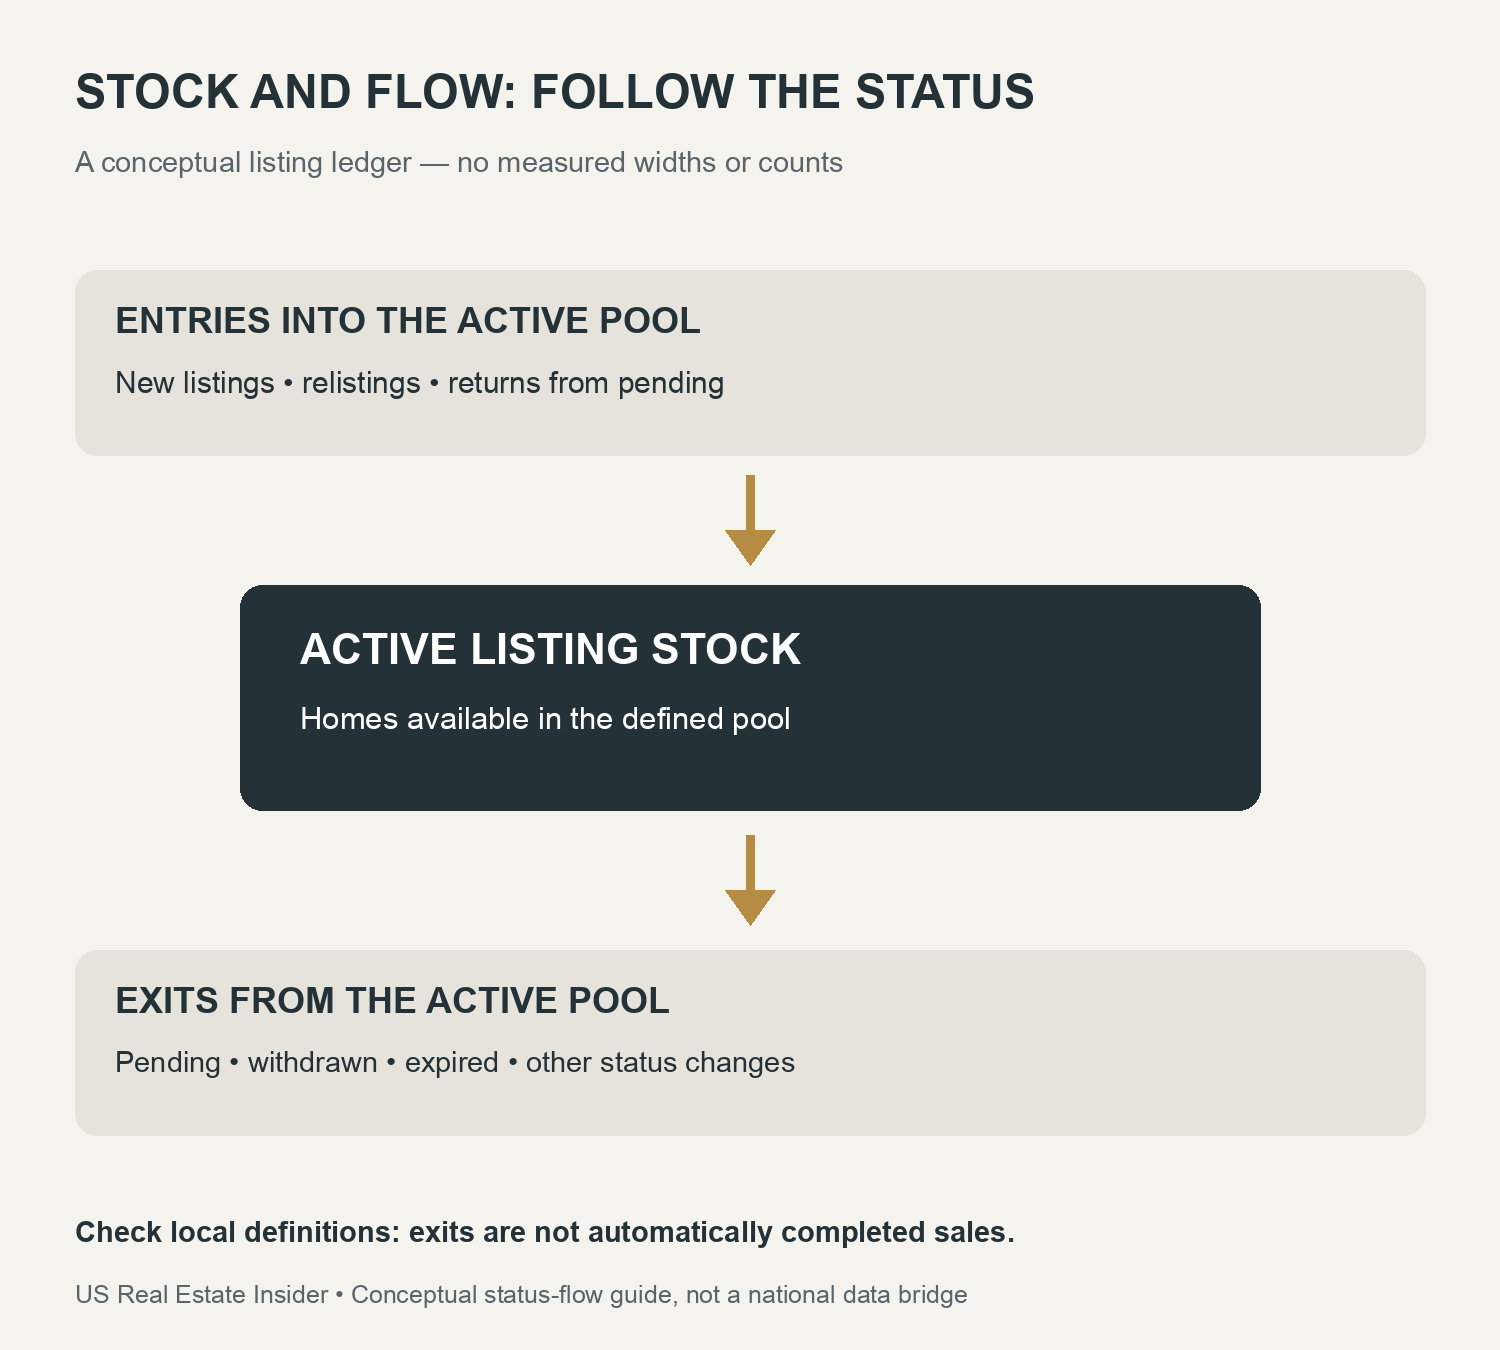
For example, a home returning from pending can re-enter an active pool without being a first-time listing. A withdrawn property can exit without selling. A change in cleaning rules can also alter a series. Good local reporting identifies these movements separately instead of labeling every departure a completed sale.
Three shortcuts to avoid
First, do not divide active listings by new listings and call the result months of supply. The denominator in that calculation would be incoming listings, rather than a defined sales pace. A plausible-looking ratio does not become the housing-market measure simply because both inputs count homes. Use the publisher’s specific months-of-supply definition and sales series.
Second, do not infer property-level time on market from these two national counts. A stock can change through several routes, and these aggregates do not track the same property through every status. If your question concerns selling time, obtain the relevant time-on-market series and read its start, end and inclusion rules.
Third, do not treat higher inventory alone as proof of affordability, distress or bargaining power. A buyer still needs suitable comparables and full ownership costs. A seller still needs current evidence for the home’s location, condition and price bracket. Our price-index versus median-price guide explains another case where two valid statistics answer different questions.
Audit your local listing report
Start with geography and property type. Then write down the status definitions and observation dates. Ask whether active stock is a month-end count, a daily average or another snapshot. Check how relistings, returns from pending and withdrawals are handled. Finally, compare the same month across years using the same reporting vintage.
The blank worksheet below gives each question its own evidence field. If a definition is missing, leave the answer unresolved and ask the data publisher. Do not fill a gap with an assumption based on how another MLS reports the same label. For buyer-specific preparation, our first-time buyer analysis offers a separate readiness worksheet. The builder cancellation-rate guide also shows why a reported ratio is not an individual outcome probability.
Downloads, methods and limits
We transcribed the national and regional annual changes from one dated report. We did not combine old downloaded vintages, estimate missing property movements or fit a causal model. The publisher revises historical series, and its report notes differences between some cleaned report series and legacy downloads. This article therefore keeps the selected report values together and avoids unresolved pre-pandemic comparisons.
- National stock and inflow evidence (CSV)
- Four-region annual-change comparison (CSV)
- Two fictional stock-and-flow ledgers (CSV)
- Blank local listing-report audit worksheet (CSV)
Our three charts serve different purposes: the national divergence, the regional comparison and the fictional reconciliation. The separate infographic explains status movements. Keep the fictional examples labeled if you reuse them, and retain Realtor.com Economic Research attribution and the reporting date when citing its figures. No individual home, sale probability or investment return is modeled here.
Suggested citation: US Real Estate Insider, “Active Listings vs New Listings: October 2026’s Supply Paradox,” November 7, 2026. Published figures: Realtor.com Economic Research, November 4 report, October 2026 versus October 2025. The stock-and-flow ledgers are original fictional teaching examples.


