




September 2026 housing starts reached an estimated 1.221 million units at a seasonally adjusted annual rate. Yet the headline monthly decline has a wide uncertainty range. Our analysis separates that estimate from the clearer question for buyers and property professionals: which kind of supply is moving through each stage?
Checked October 25, 2026. This report combines a permit-mix comparison, an uncertainty chart and a local project worksheet. It keeps national construction rates separate from actual homes available in your neighborhood. Five charts show what the latest releases can support and where readers need more evidence.
September 2026 housing starts: read the units first
The Census Bureau and HUD October 20 release reports permits, starts and completions at annualized, seasonally adjusted rates. These are not the number of homes built during September. An annual rate describes a pace after seasonal adjustment; it is not a forecast or a count of homes ready for sale.
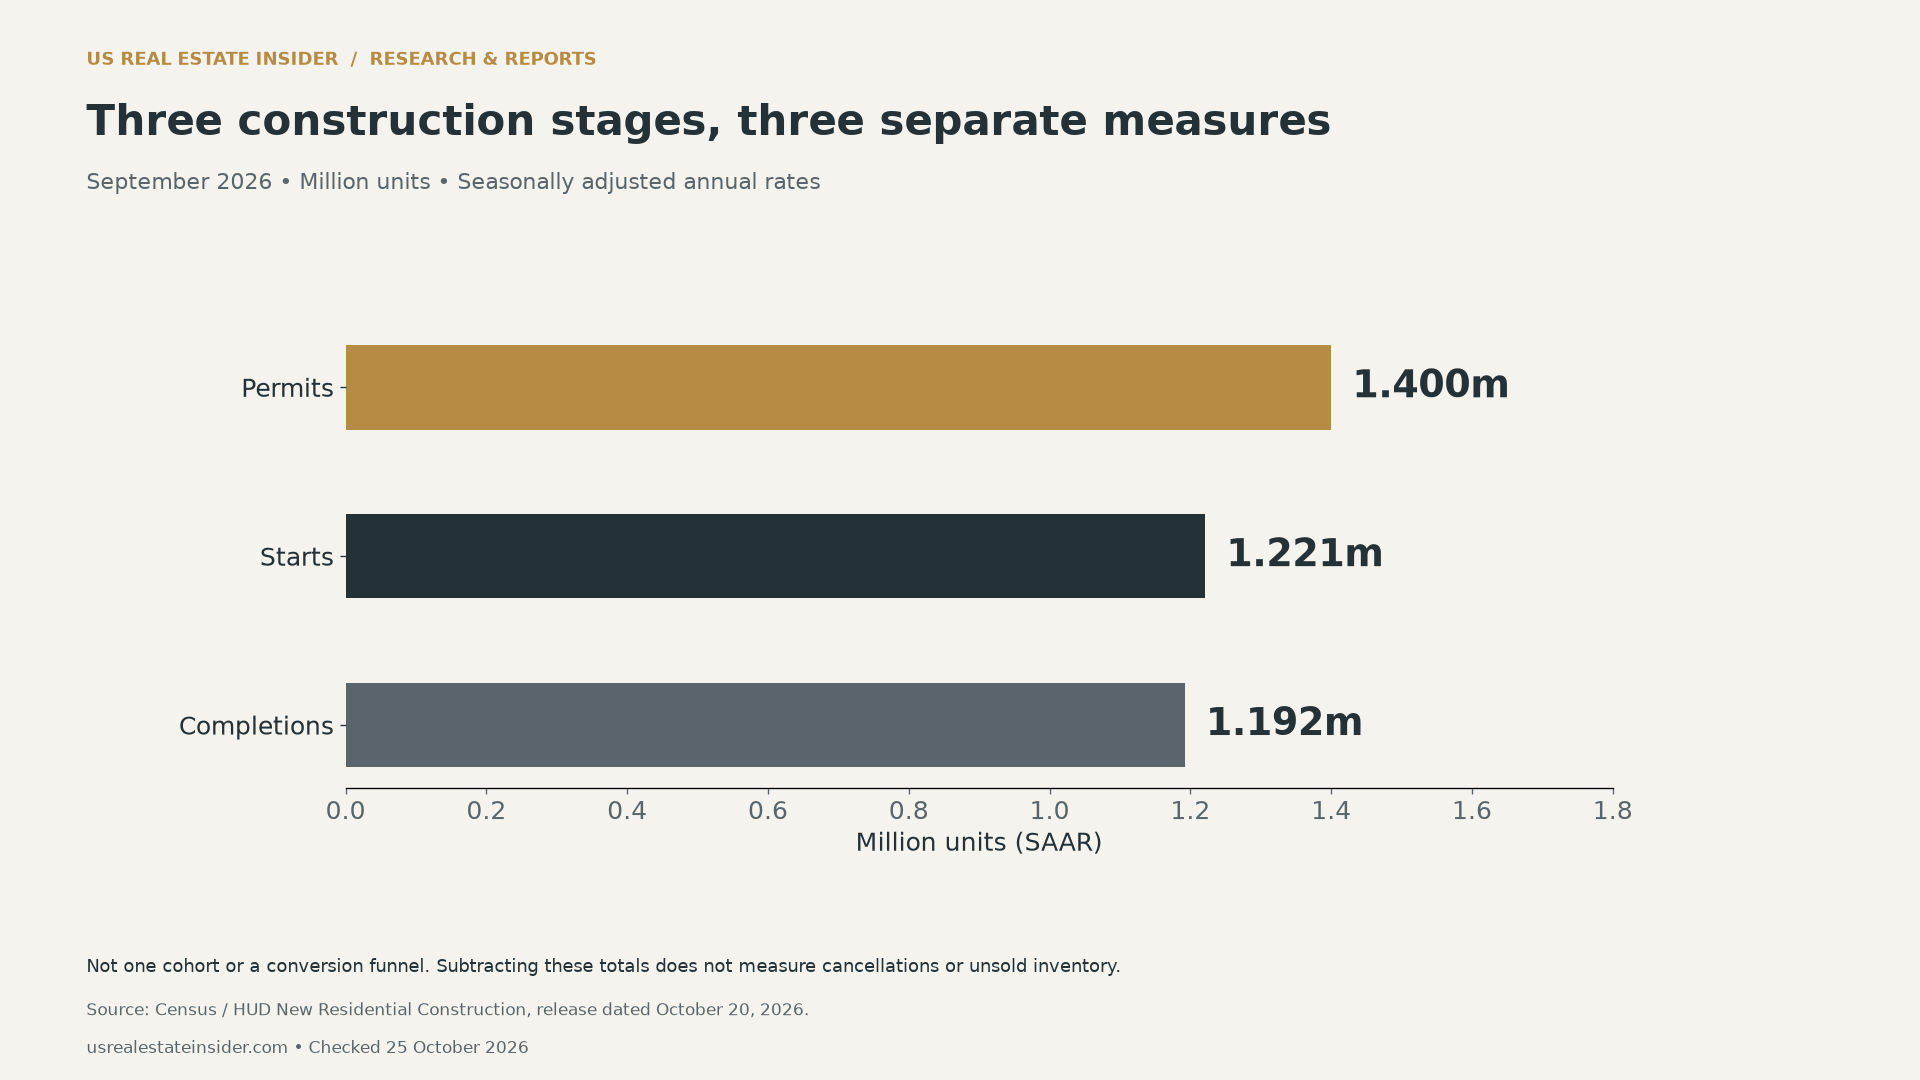
Think about the decision each measure can inform. Permission to build is different from work beginning. A completed building is different again. A household looking for a home available next month needs project-specific availability. A developer considering future competition needs evidence about timing as well as approvals.
Do not subtract these three national totals to calculate cancellations, unsold stock or a conversion rate. They do not track the same set of projects through September. A project authorized earlier can start or finish much later. The stage comparison is a snapshot, not a project history.
The September 2026 housing starts uncertainty matters
The estimated monthly starts change was −5.2%, with a stated margin of ±11.8 percentage points. This gives a 90% confidence interval from −17.0% to +6.6%. It includes zero. The release therefore does not establish whether the underlying monthly change was an increase or decrease at that confidence level.
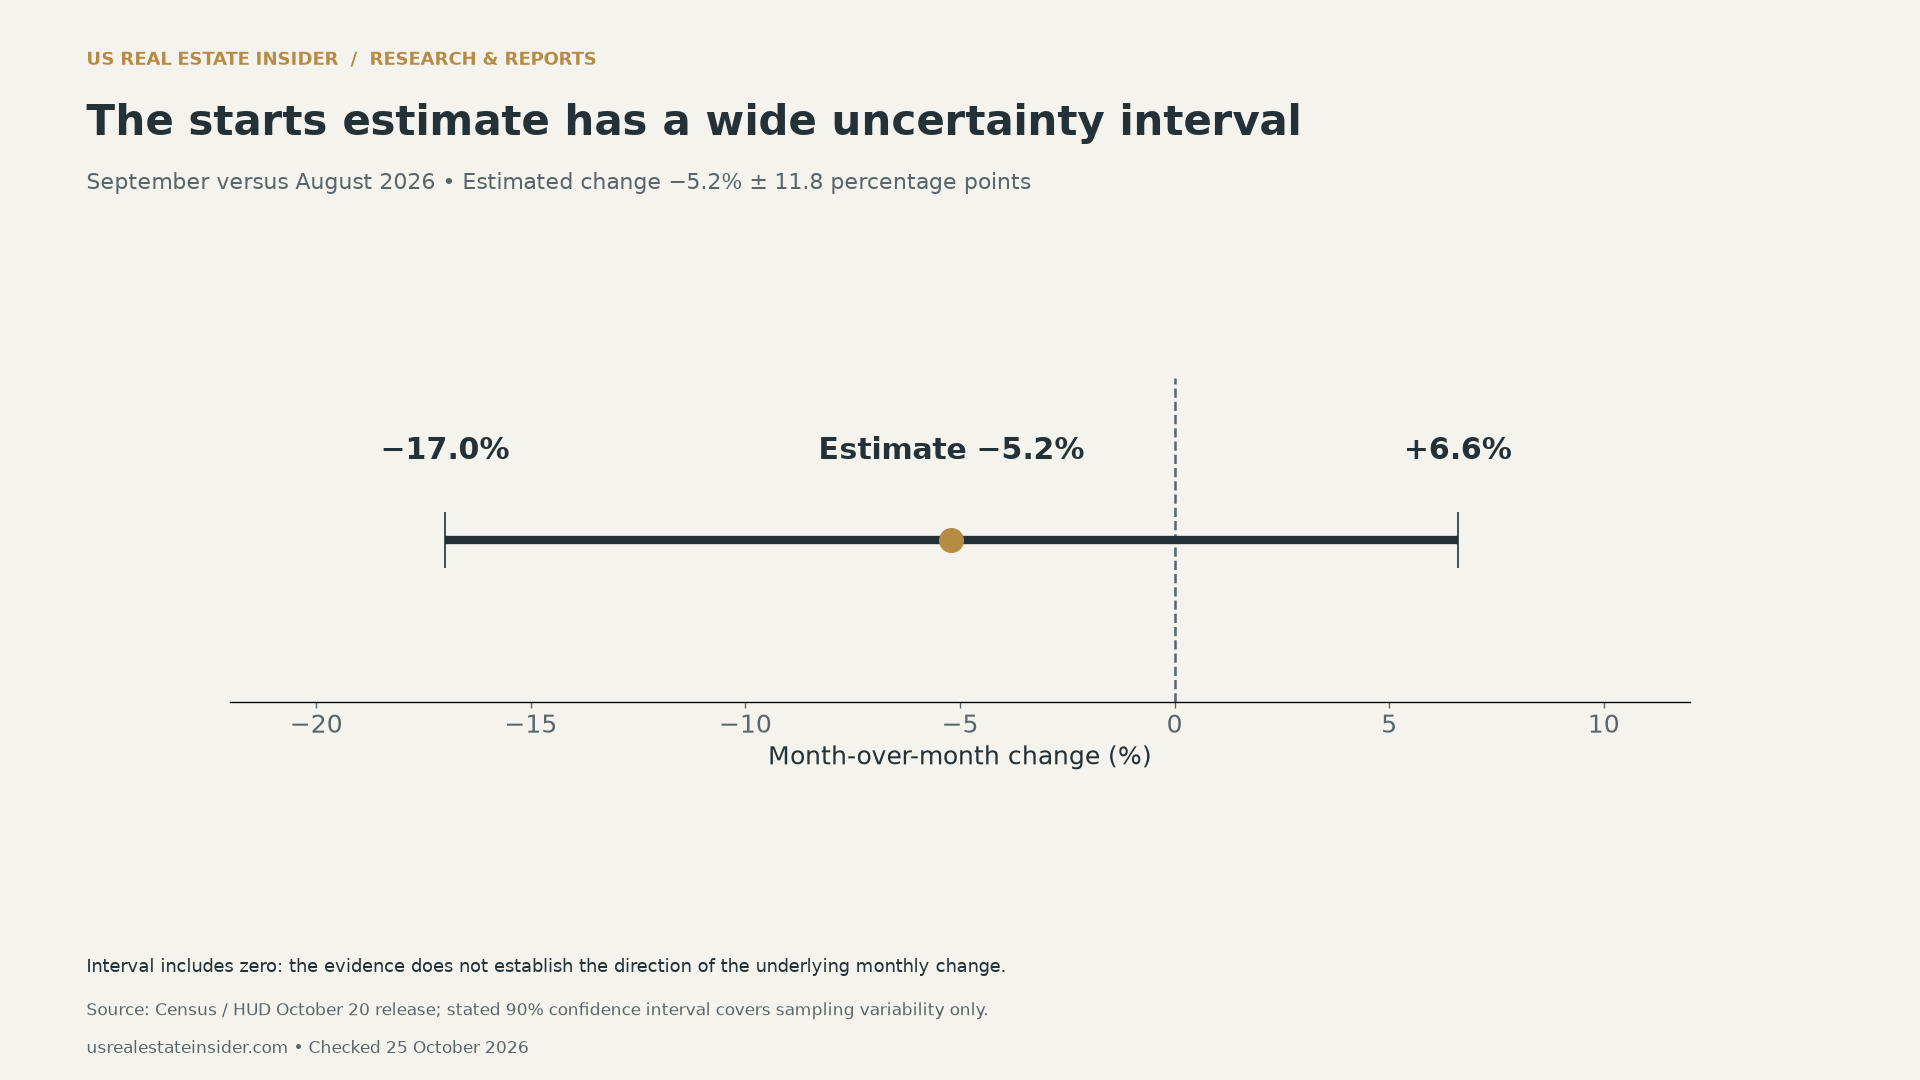
That is a reason to qualify the headline, rather than ignore the estimate. A useful description gives both the central estimate and its uncertainty. It avoids turning one noisy monthly result into a confident claim about a lasting national trend. Preliminary figures can also change as the publisher receives more information.
Permit mix: a different story beneath the total
The release tables and explanatory notes (PDF) show contrasting permit movements by building size. The nine-month comparison below uses the values printed in Table 1a. It retains the release’s annualized units and the preliminary September and revised August markers.
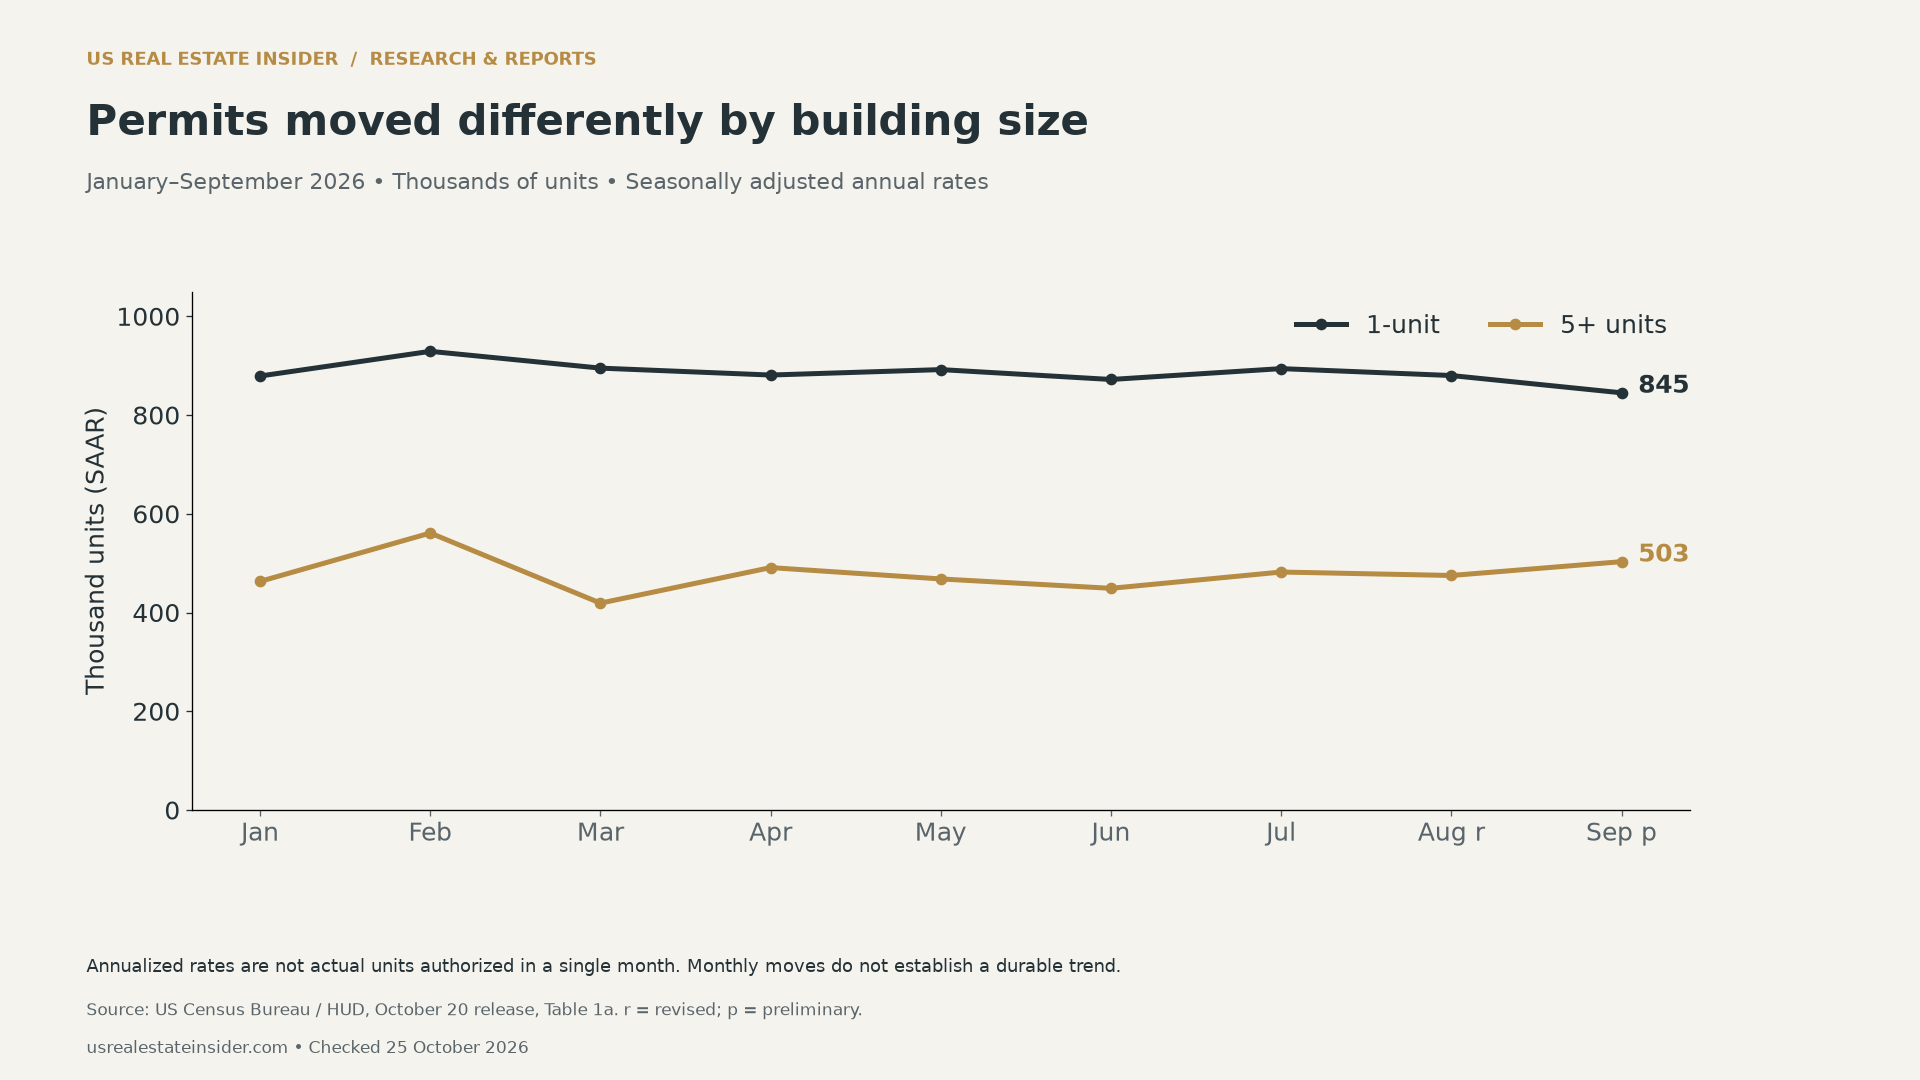
The mix matters because different homes serve different local needs. A larger apartment project does not automatically replace a detached home in a buyer’s search area. Likewise, a permit does not establish when units will be finished, whether they will be rentals or what they will cost.
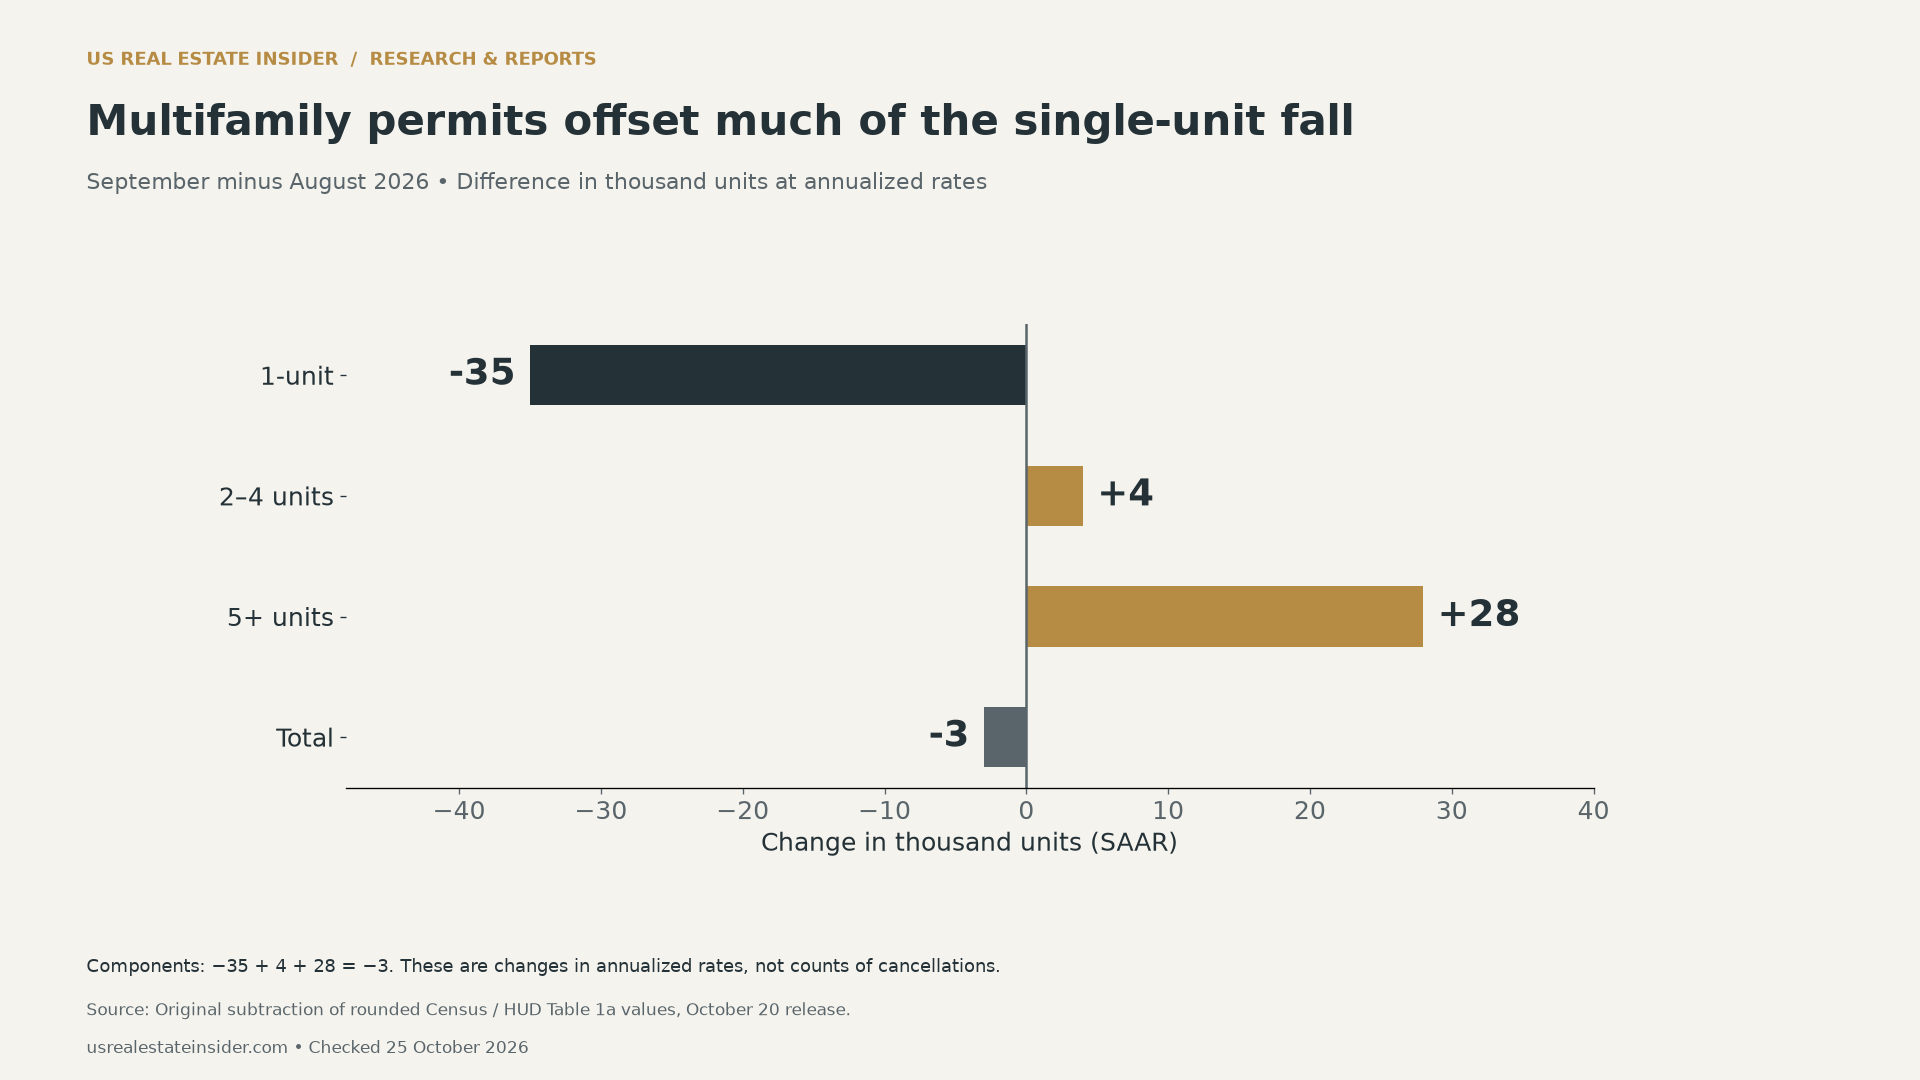
Subtracting the table values shows how much the component movements offset each other. The total changes little while the one-unit and larger-building components move in opposite directions. This is a composition observation. It does not measure canceled projects, predict completions or demonstrate that one housing type caused the movement in another.
Builder incentives add context, not a supply forecast
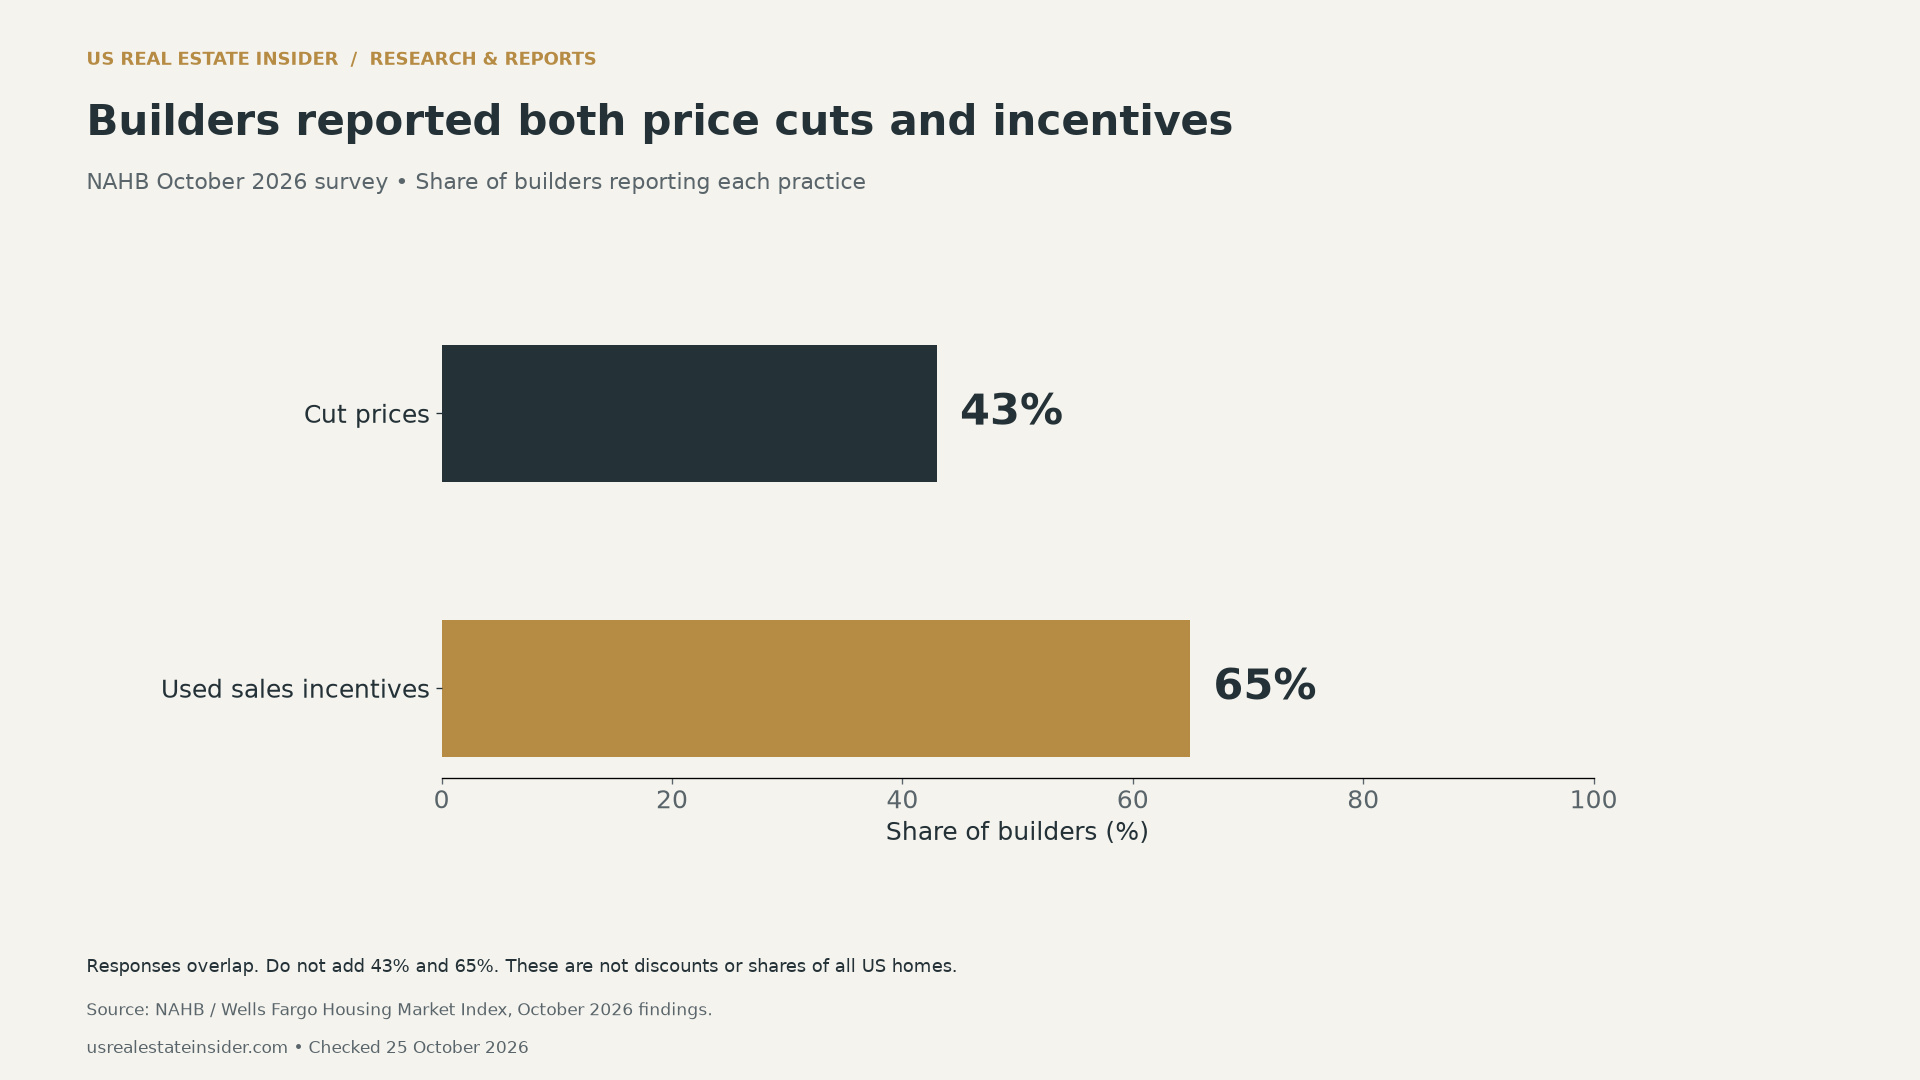
The NAHB/Wells Fargo October 2026 findings report a confidence index of 29, down three points. Separately, 43% of surveyed builders reported cutting prices and 65% reported using sales incentives. Those practices can overlap. Neither percentage is the size of a discount.
A buyer can use this context to ask better questions about a specific new-home offer. Request the full price, the terms attached to any incentive and a current loan estimate. A headline concession might affect closing cash, borrowing terms or selected upgrades. Compare the actual documents rather than assuming all incentives have equal value.
Our mortgage payment analysis at 7.32% provides a transparent loan example. The pending-sales buyer leverage report explains why weaker demand still requires a property-level negotiation case. Neither national construction figures nor builder sentiment establishes what a particular household can afford.
Turn national supply evidence into a local project check

Start by choosing a location, property type and decision window. For example, a renter comparing apartments available this winter needs a different list from a developer considering competition several years ahead. Keep those questions separate so an early permit does not appear as an immediately available home.
For each local project, record an identifiable source and the date you checked it. Capture the building size, approved unit count, evidence of construction and expected completion date. Mark estimated dates as estimates. Ask whether the source describes permission, active work, a completed building or units actually available to occupy.
Next, compare supply with the type of home you need. Bedroom count, tenure, location, transport and price all affect whether a project is a realistic alternative. A national total cannot establish these details. Avoid converting an apartment unit into a detached-home equivalent simply to make a local supply total larger.
Finally, keep an explicit list of unknowns. A delayed project, a changed plan or an unconfirmed opening date can alter the comparison. Recheck important claims before relying on them. This workflow provides a documented local investigation, rather than a numerical score that implies precision the evidence cannot support.
Downloads, method and limits
Download the permit observations (CSV) to reproduce the building-size charts. Use the blank local project worksheet (CSV) to collect your own dated evidence. The worksheet contains no measured projects, prices or availability claims.
We transcribed the displayed release vintage and calculated differences by subtraction. Figures use rounded published inputs, so calculations can differ slightly from changes based on the publisher’s unrounded data. The starts interval comes from the stated estimate and margin. It includes sampling uncertainty only; the release discusses other limitations and revisions.
This analysis does not estimate a housing shortage, forecast rents or infer causation from the two publishers. The construction observations concern September, while the builder survey concerns October. Keeping these periods visible prevents a later sentiment reading from appearing to be a measured explanation of an earlier monthly change.
Suggested citation: US Real Estate Insider, “September 2026 Housing Starts: What the Supply Data Shows”, checked October 25, 2026. Cite Census/HUD and NAHB for their respective observations. Cite this report for the component comparison, uncertainty visualization and local project worksheet.


