




A mortgage payment at 7.32% comes to $2,198.18 a month for a hypothetical $400,000 home with 20% down and a 30-year fixed loan. That is principal and interest only. Taxes, insurance and other ownership costs still need their own budget lines.
Research date: October 25, 2026. The rate benchmark is dated October 22. Our original calculations translate three published rates into the same $320,000 loan, then test price and down-payment scenarios. These examples are illustrations, not lender quotes or estimates of what a particular household can afford.
Mortgage payment at 7.32%: the key comparison
The latest Freddie Mac Primary Mortgage Market Survey gives a 30-year fixed average of 7.32%, versus 7.40% the previous week and 6.19% a year earlier. It is a national application-based benchmark for selected conventional conforming purchase loans. An individual offer can differ.
| Benchmark used | Rate | Monthly principal and interest |
|---|---|---|
| Year earlier | 6.19% | $1,957.82 |
| Previous week | 7.40% | $2,215.62 |
| October 22, 2026 | 7.32% | $2,198.18 |
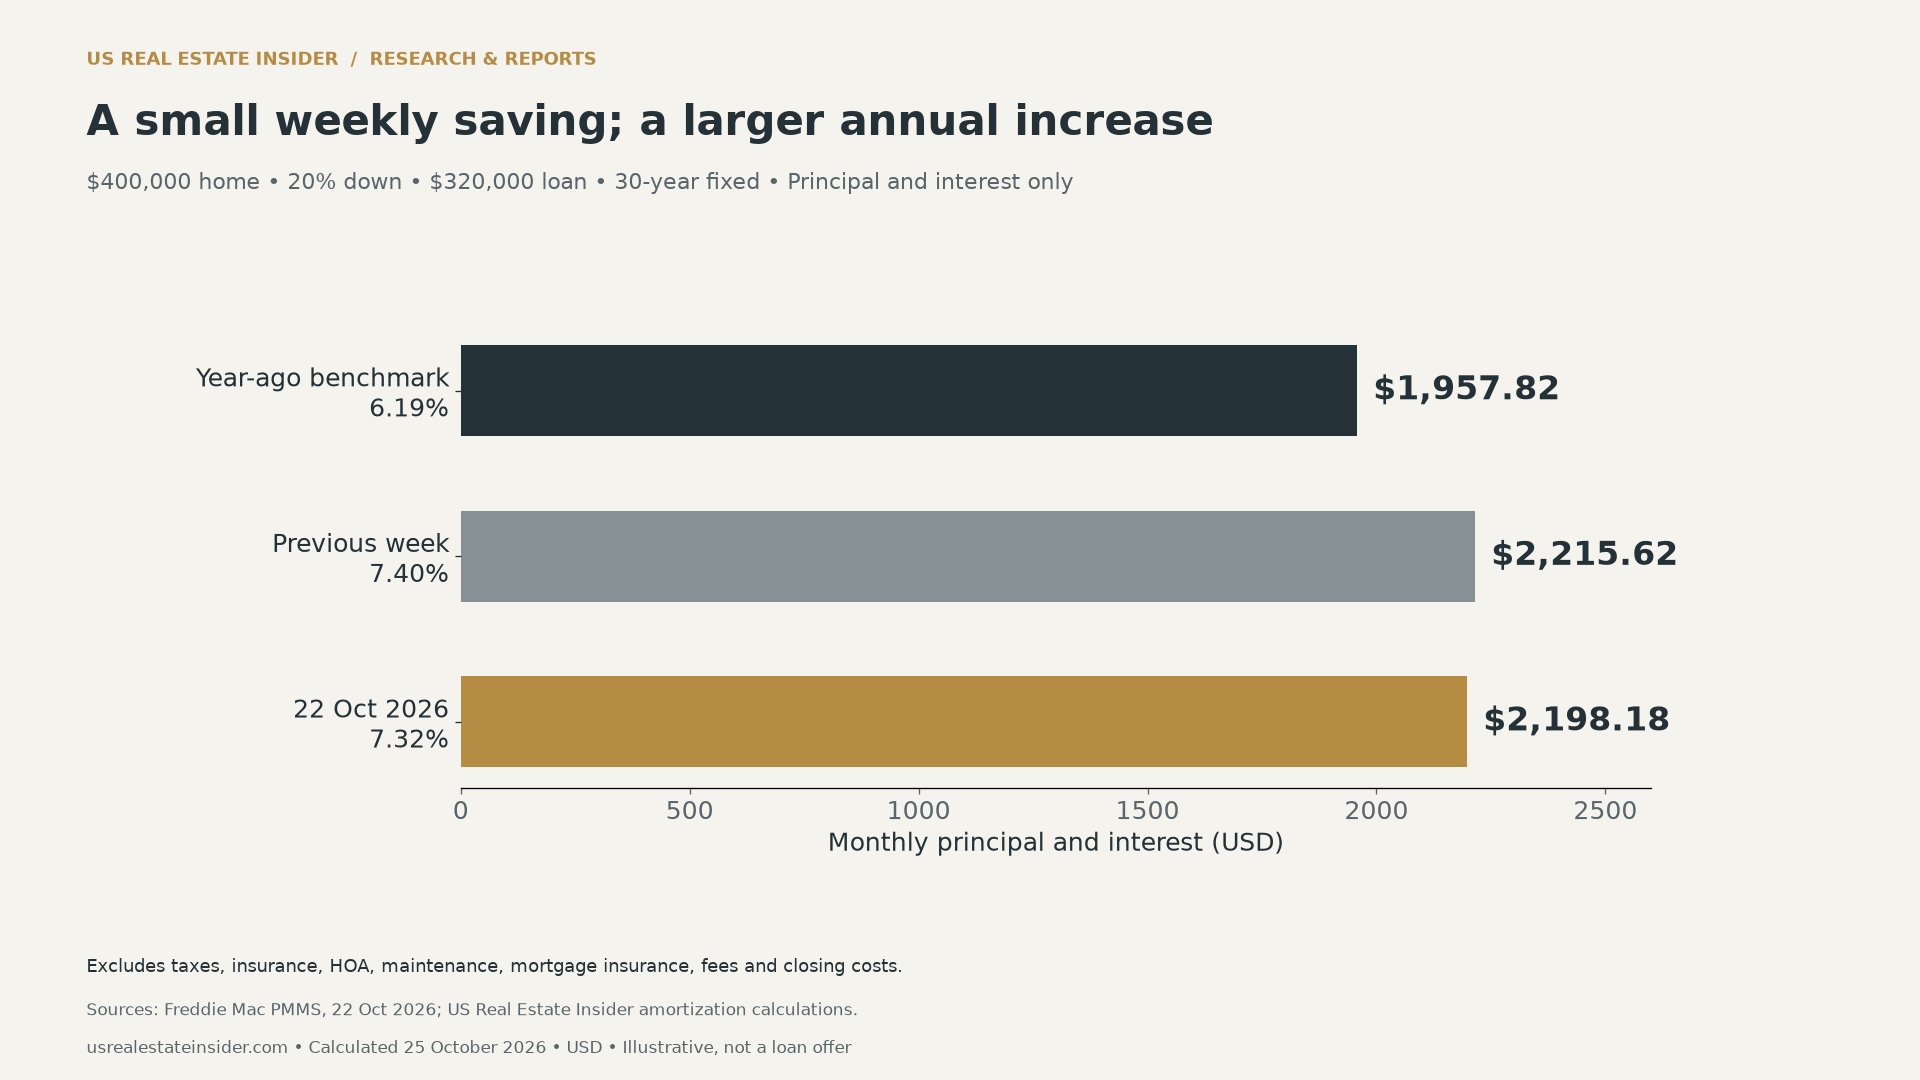
The weekly rate decline saves $17.44 a month in this example. However, the payment remains $240.35 higher than the same loan at the year-earlier benchmark. Both statements can be true: a recent improvement can coexist with a larger increase over a longer period.
The rate change is 0.08 percentage points, or eight basis points, below the previous week. It is 1.13 percentage points above the year-earlier rate. Those changes describe interest rates; the dollar differences describe the modeled payment. Keeping the units separate avoids an easy comparison error.
How the mortgage payment at 7.32% is calculated
Start with a $400,000 purchase price. A 20% down payment is $80,000, leaving a $320,000 initial loan. We assume 360 equal monthly payments, a fixed nominal annual rate, standard monthly amortization and no extra payments. We do not add financed fees to the loan balance.
The equation is M = L × r ÷ [1 − (1 + r)−n]. Here, M is the monthly principal-and-interest payment, L is the initial principal, r is the annual percentage rate input divided by 1,200, and n is 360. For 7.32%, the monthly rate input is 0.0061. This interest-rate input is not the disclosure APR, which reflects additional loan costs.
The unrounded result is $2,198.1779859. We round displayed payments to cents only after calculating differences. Subtracting already rounded figures can occasionally produce a one-cent discrepancy. The downloadable scenario file retains extra precision so another writer can reproduce the arithmetic.
Price and rate sensitivity: compare the same assumptions
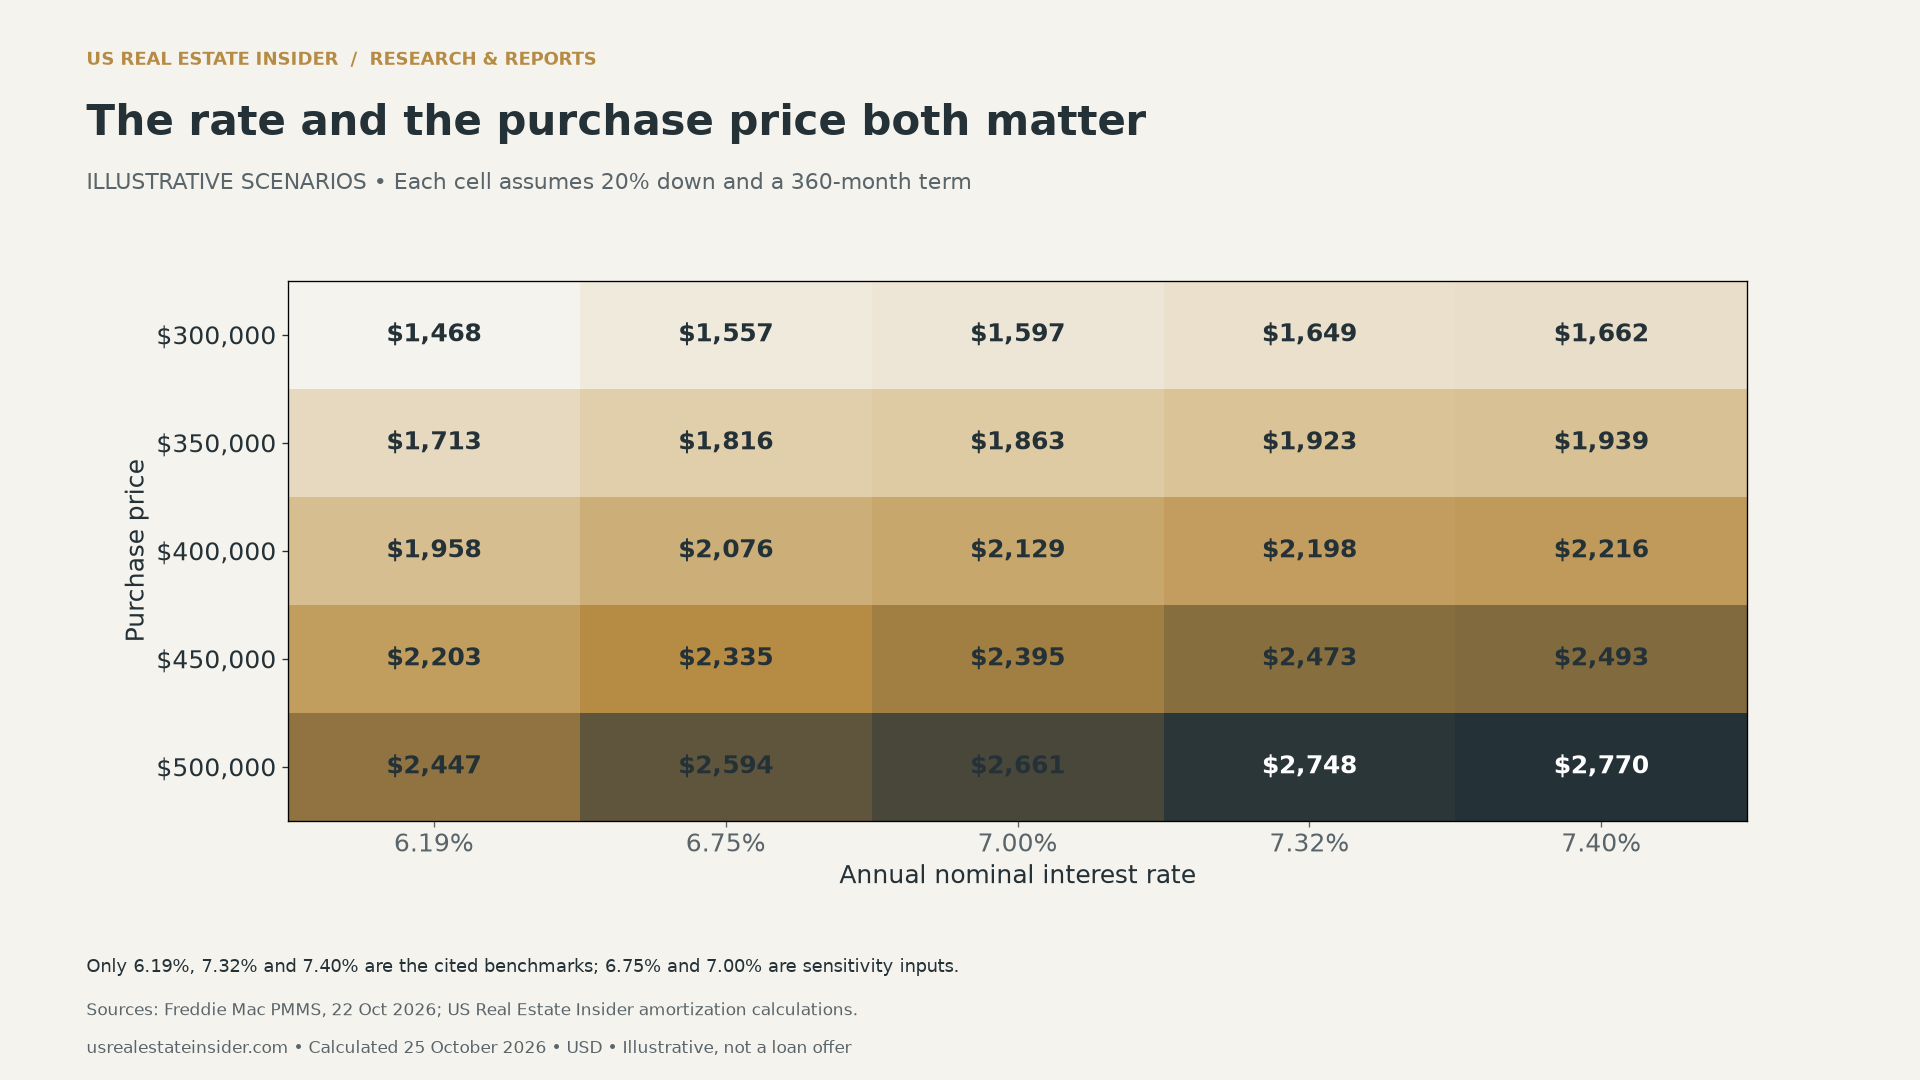
Every row changes the purchase price while keeping the down-payment share at 20%. Every column changes the rate while holding the price fixed. Therefore, a higher price also means a larger cash down payment. The grid does not assume that the same household can obtain every listed rate.
At $300,000 and 7.32%, the same method produces about $1,649 in monthly principal and interest. At $500,000, it produces about $2,748. These are rounded chart labels. Property taxes, insurance and association charges can also differ between homes, so the payment gap alone is not the complete budget gap.
A price reduction versus a small rate improvement
Consider a second hypothetical purchase at $380,000, which is 5% below $400,000. With 20% down, the buyer would provide $76,000 and borrow $304,000. At 7.32%, principal and interest would be $2,088.27 a month, or $109.91 less than the $400,000 example.
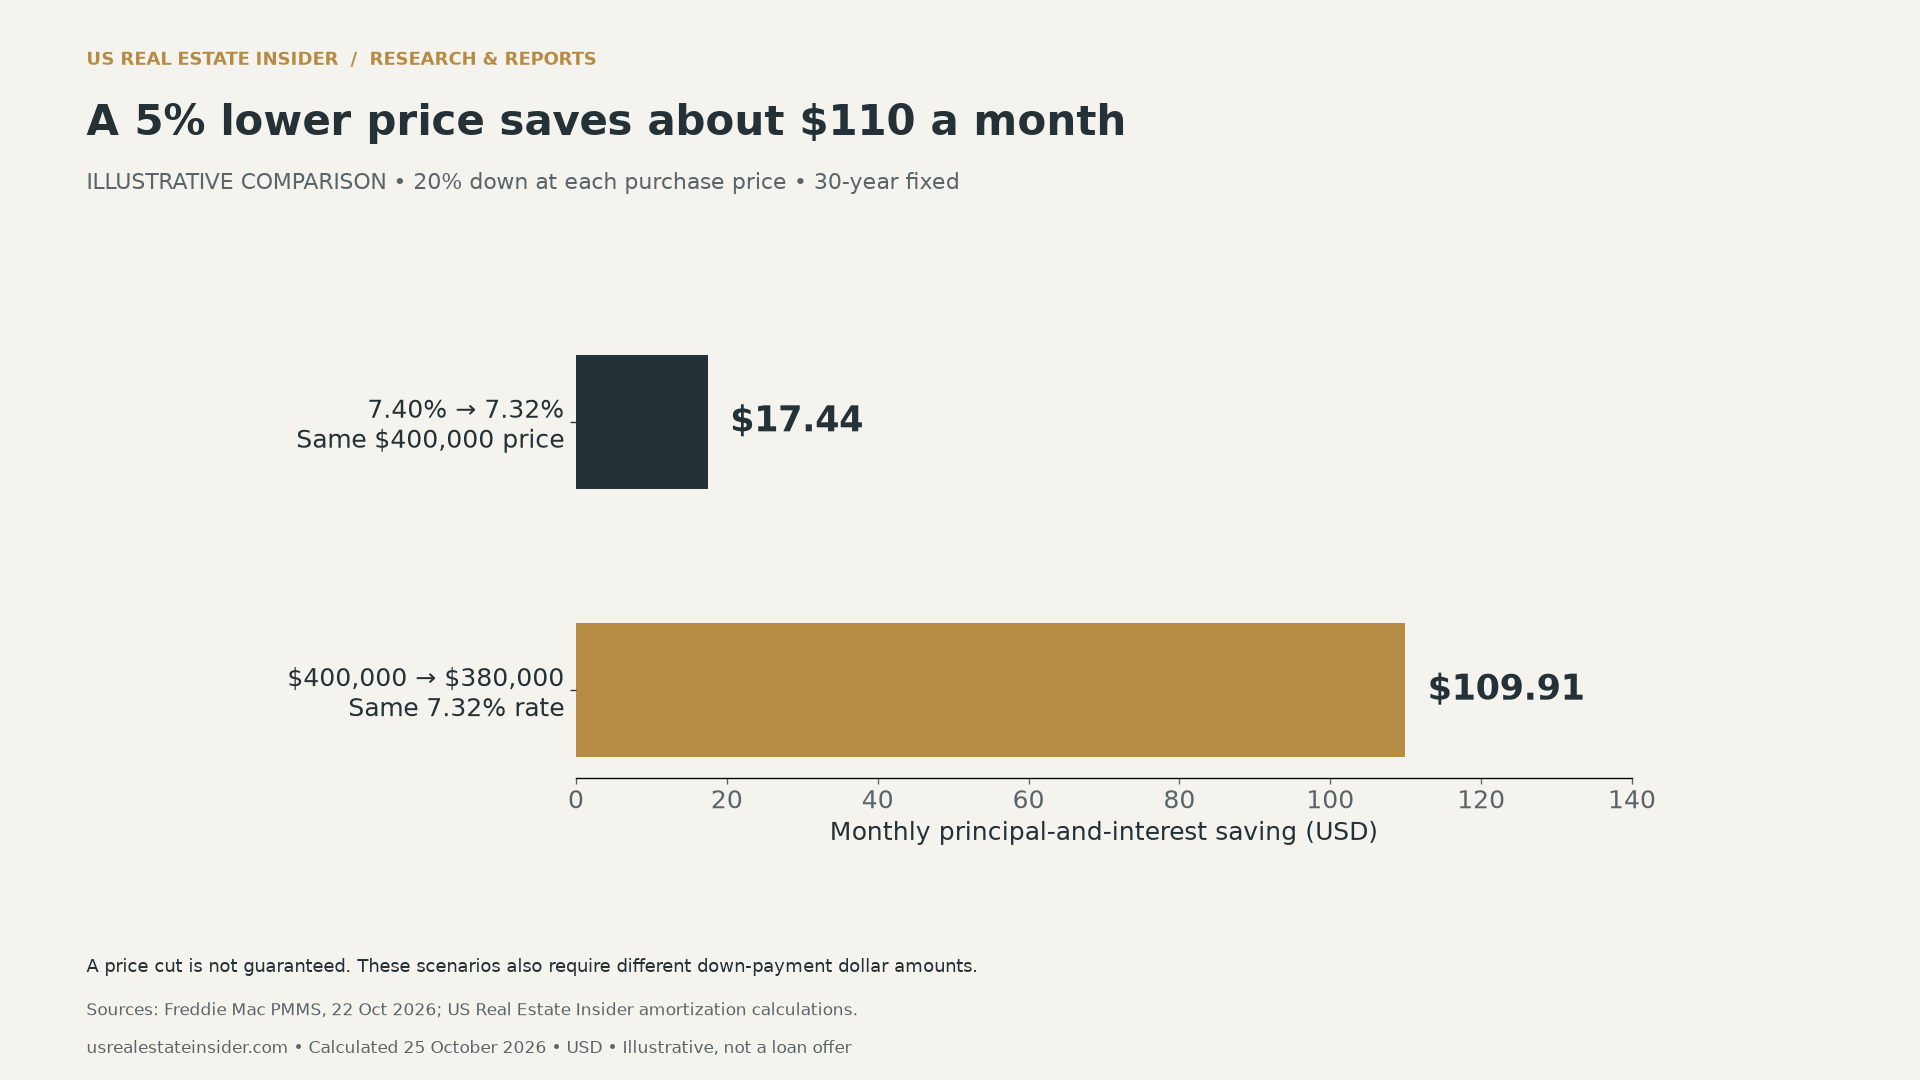
That comparison helps explain why the contract price deserves attention alongside the interest rate. It does not establish that a seller will accept a lower offer. Nor does it make a seller credit, a permanent price cut and a temporary rate buydown interchangeable. They affect different cash flows and can have different conditions.
Down payments trade monthly borrowing costs for cash
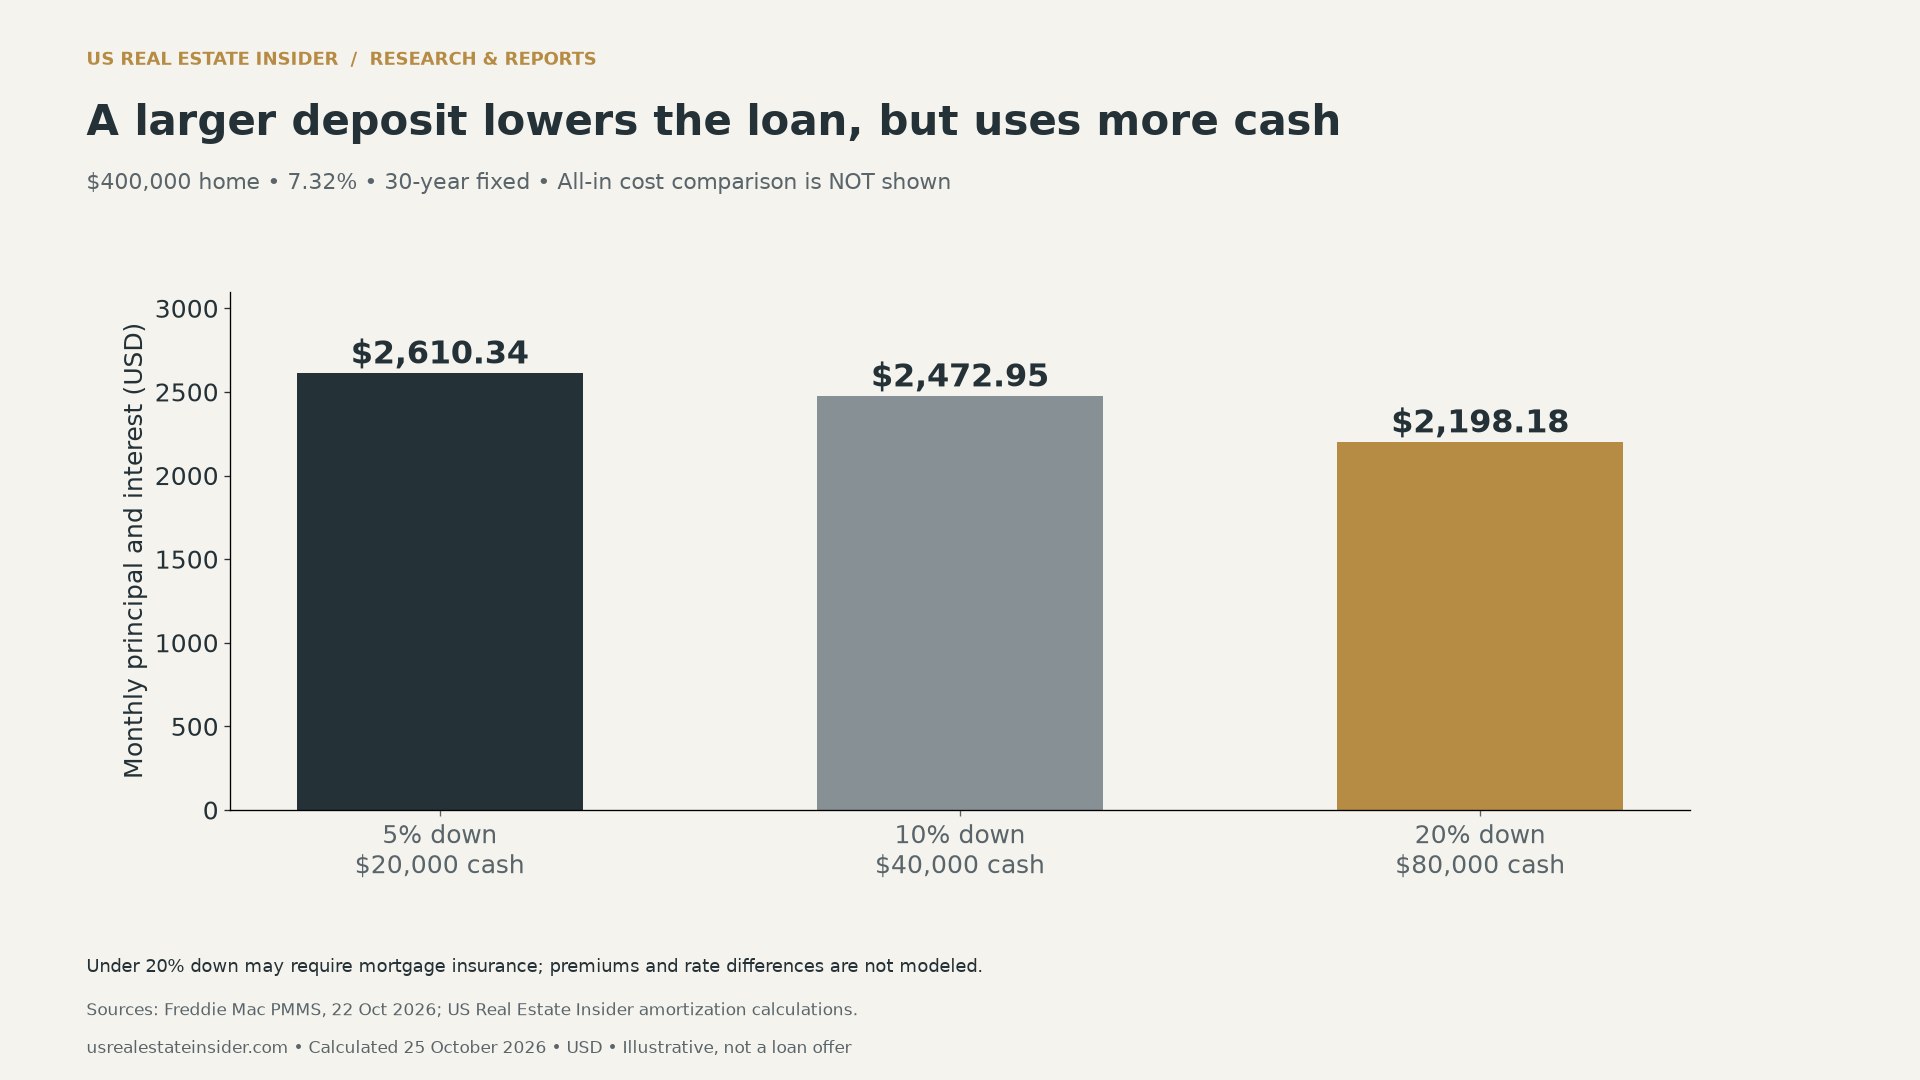
A 5% down payment in this model uses $20,000 in cash and leaves a $380,000 loan. Moving to 20% down requires another $60,000 upfront and reduces modeled principal and interest by $412.16 a month. The comparison excludes returns on retained cash and any financing differences.
Do not read the lower payment as a universal instruction to put more cash down. Closing costs, emergency reserves and other obligations also matter. Conversely, do not interpret the 5% scenario as a complete low-deposit quote: mortgage insurance and lender pricing are deliberately outside this model.
Why the full cost exceeds principal and interest
The CFPB Loan Estimate explainer separates principal and interest from estimated total monthly payment and cash to close. Use the actual lender document to identify escrow, mortgage insurance, fees and any costs paid outside escrow. Compare like-for-like estimates, including their loan terms, rate-lock status and fees.

| Budget item | Where to obtain the property-specific figure |
|---|---|
| Principal and interest | Written lender estimate for the actual loan |
| Property taxes | Local tax authority and lender estimate |
| Homeowners insurance | Property-specific insurer quote |
| Mortgage insurance, if applicable | Lender estimate and loan terms |
| HOA or condominium charges | Association documents |
| Maintenance and repairs | Inspection findings and a household reserve plan |
| Closing cash | Lender cash-to-close calculation and transaction documents |
The CFPB payment guide also notes that HOA charges are commonly separate from the mortgage-company payment. Avoid counting escrowed taxes twice. A fixed interest rate does not freeze insurance premiums, taxes or repair needs.
We have not filled these lines with national averages. Doing so could make an apparently precise total misleading for a home in a different tax district, insurance market or physical condition. Collect the actual figures before treating the $2,198.18 base payment as a household decision number.
What amortization adds to the picture
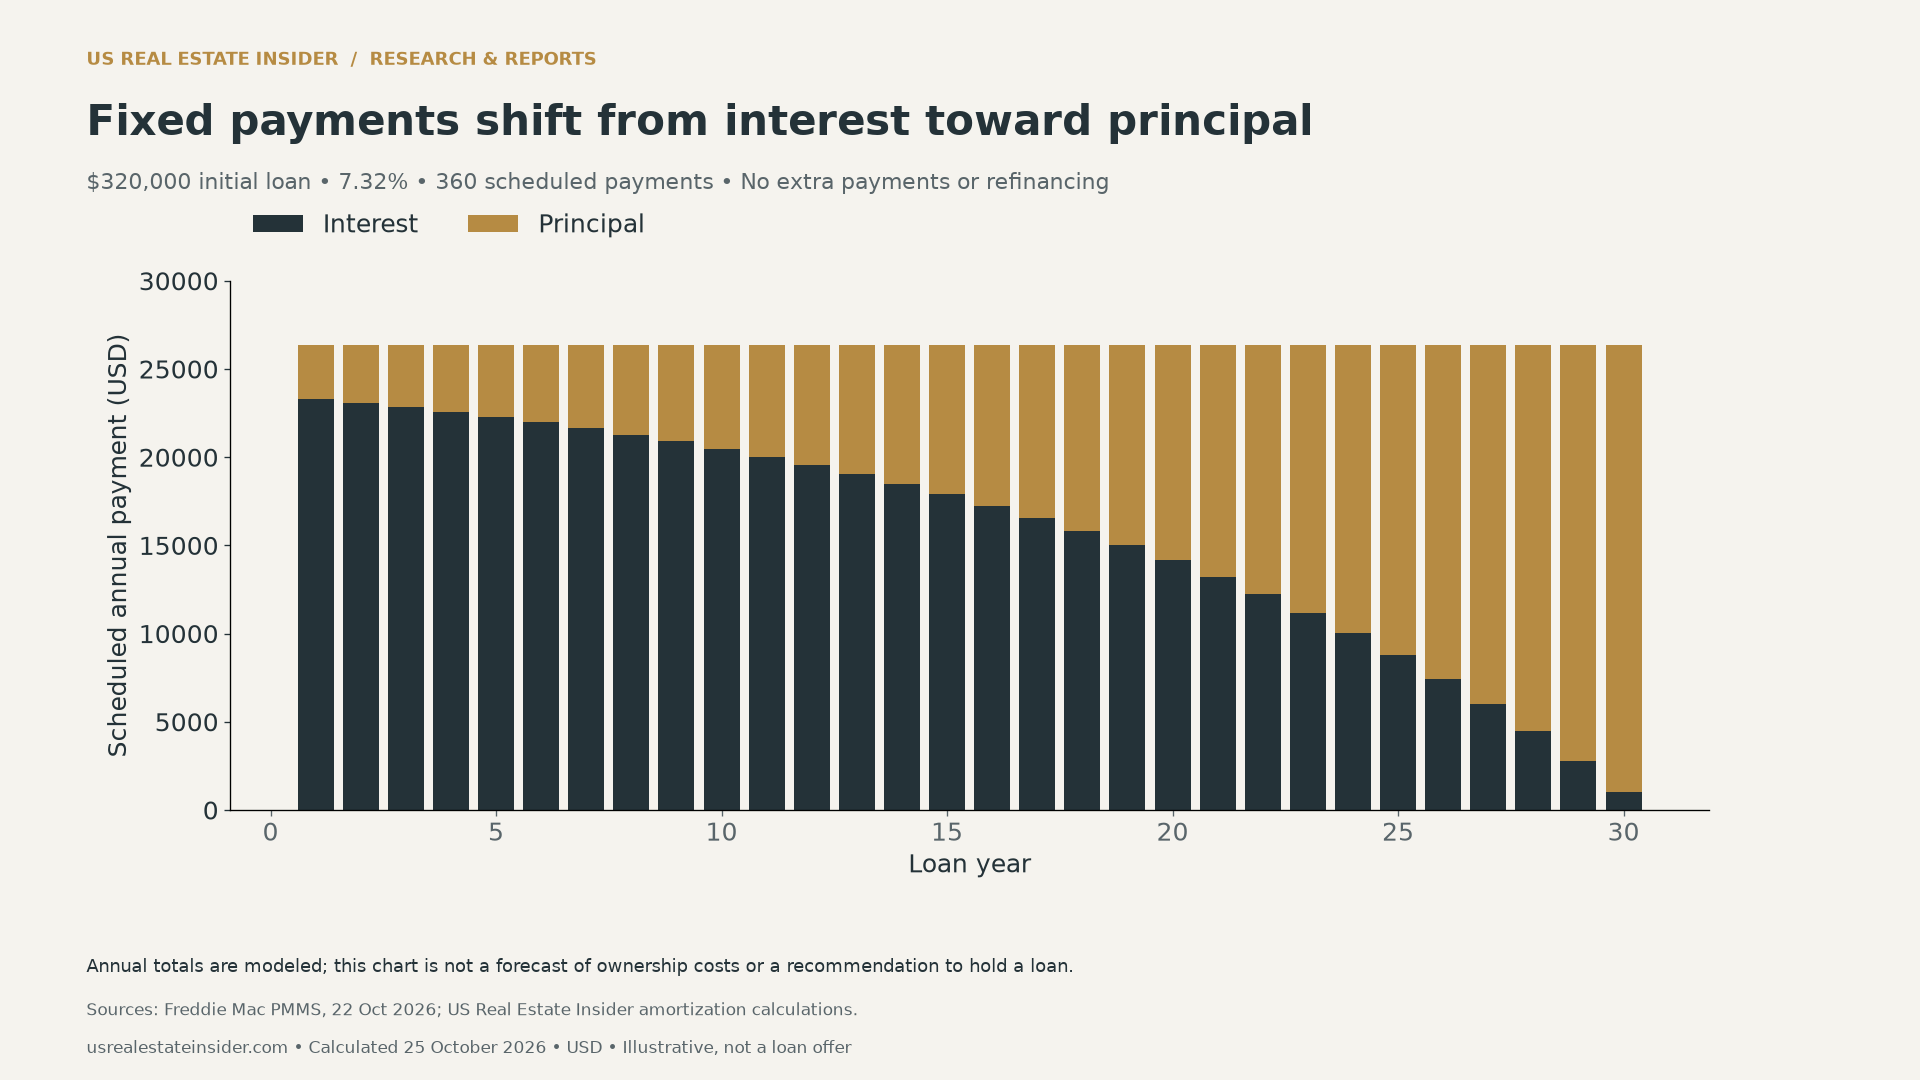
In the first modeled year, about $23,322.85 goes to interest and $3,055.29 reduces principal. The ending balance is about $316,944.71. Later scheduled payments allocate more to principal because the interest calculation applies to a smaller remaining balance.
This is a mechanical schedule, not a forecast that a buyer will keep the loan for 30 years. Selling, refinancing, making additional principal payments or changing the financing terms would alter it. No future refinancing saving is assumed in the affordability comparison.
Downloads, methods and limits
Use the mortgage payment scenarios (CSV) to reproduce the benchmark, price-cut and down-payment examples. The separate annual amortization schedule (CSV) contains principal, interest and ending balances by loan year.
All dollar values are US dollars. Rate inputs were checked on October 25, 2026. Our calculations are original illustrations based on the displayed October 22 benchmarks. They do not measure the number of buyers affected, predict house prices or establish eligibility for a loan. Changing any input changes the result.
For more context, explore our Home Buying Tips coverage. Use current official lender and regulator information for the terms of a specific transaction. This report provides reproducible comparisons, rather than a personalized borrowing recommendation.
Suggested citation: US Real Estate Insider, “Mortgage Rates at 7.32%: What a $400,000 Home Really Costs,” calculated October 25, 2026. Credit Freddie Mac for the reported rate benchmarks and this report for the hypothetical amortization calculations. Link to the methodology and retain the assumptions when reusing a chart.


