




Pending home sales September 2026 data shows a sharper slowdown in contract activity. NAR reports a 7.3% monthly decline and an 11.3% annual decline. For a buyer, that raises a practical question: does weaker demand create room to negotiate a better deal?
Checked October 25, 2026. This report separates September’s monthly evidence from a later four-week Redfin window. It also provides an original property-review framework and a fully labeled budget illustration. National weakness can improve the negotiating backdrop without making a particular home affordable.
What pending home sales September 2026 measures
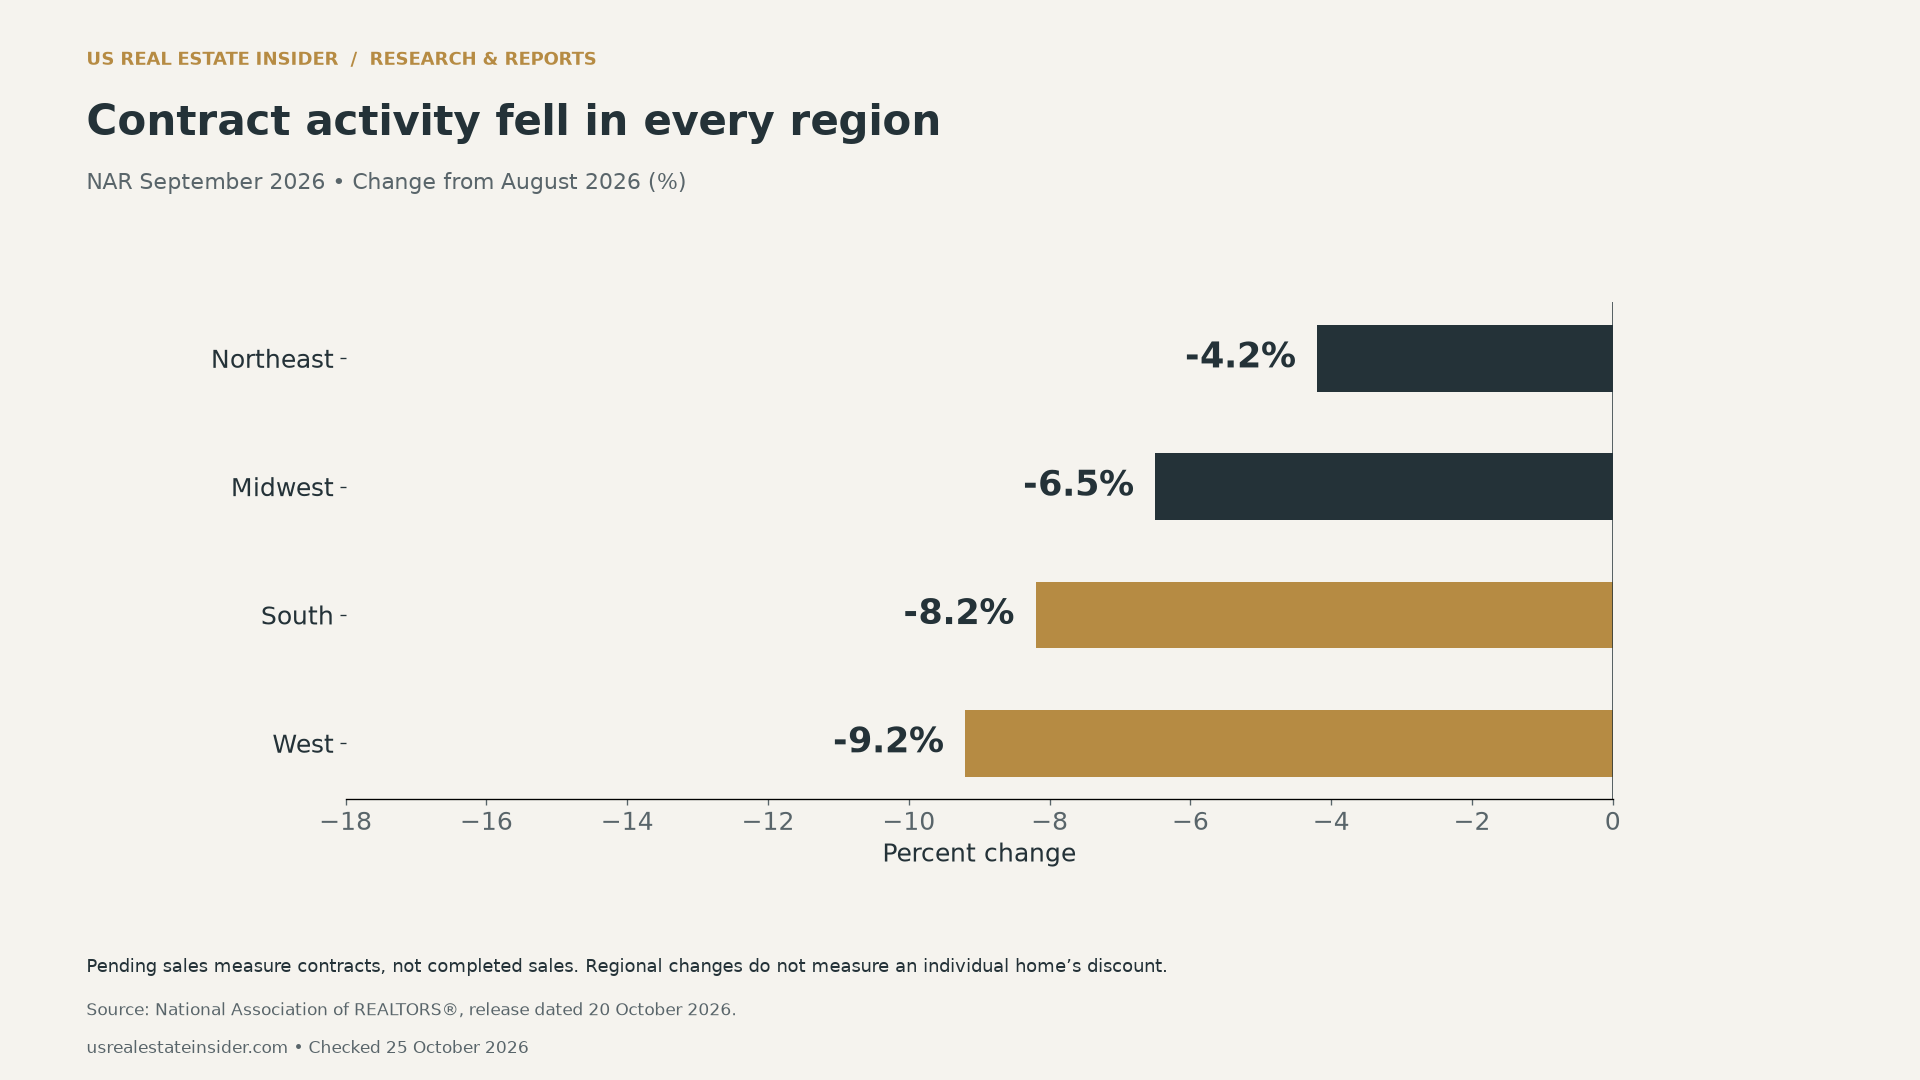
The NAR October 20 release measures existing-home contracts. A pending sale is not a completed sale. Its national decline compares September with August; the annual comparison uses September a year earlier. Neither percentage measures the discount a buyer should offer on an individual property.
Keep three questions separate. First, how much contract activity changed. Second, whether the specific seller faces competing listings or a long marketing period. Third, whether the resulting ownership costs fit the buyer’s finances. A national indicator answers the first question, while the other two require property and household evidence.
Regional pending home sales September 2026 comparisons
| Region | Monthly change | Annual change |
|---|---|---|
| Northeast | −4.2% | −9.4% |
| Midwest | −6.5% | −8.7% |
| South | −8.2% | −12.0% |
| West | −9.2% | −15.0% |
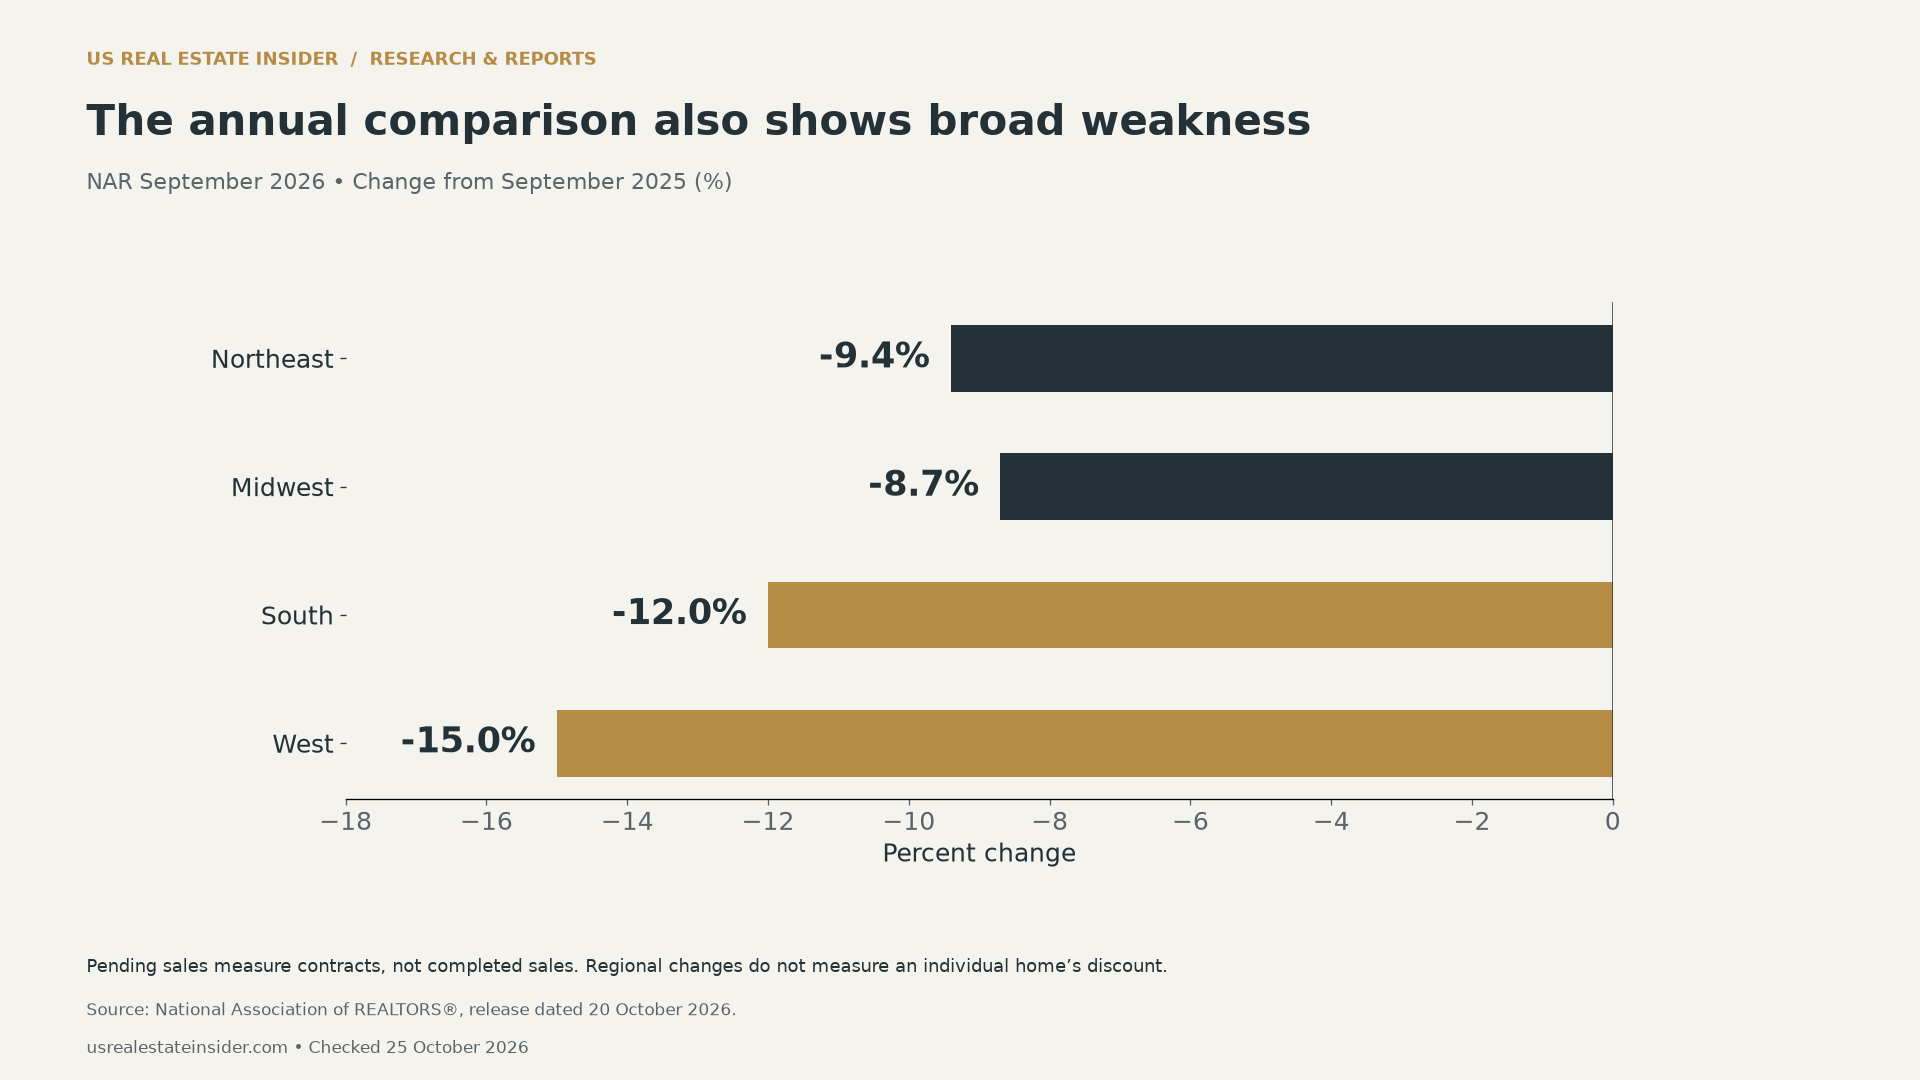
The West has the largest decline in both displayed comparisons. However, the Northeast and Midwest switch order between the monthly and annual figures. That illustrates why the comparison period matters. It does not establish that every neighborhood in the West has more negotiable sellers than every neighborhood elsewhere.
These four regions also contain very different price bands, employment centers and housing types. A buyer considering one condominium needs evidence about competing condominiums, rather than treating a broad regional percentage as a valuation adjustment. The national change is not a simple unweighted average of the regional percentages.
What the later Redfin window adds
The Redfin October 22 report covers the four weeks ending October 18. Its national measures cover more than 900 US metro areas and can be revised. Seasonally adjusted pending sales fell 1.9% week over week and 14.4% year over year. Active listings rose 2.1% annually; median sale price rose 0.2%.
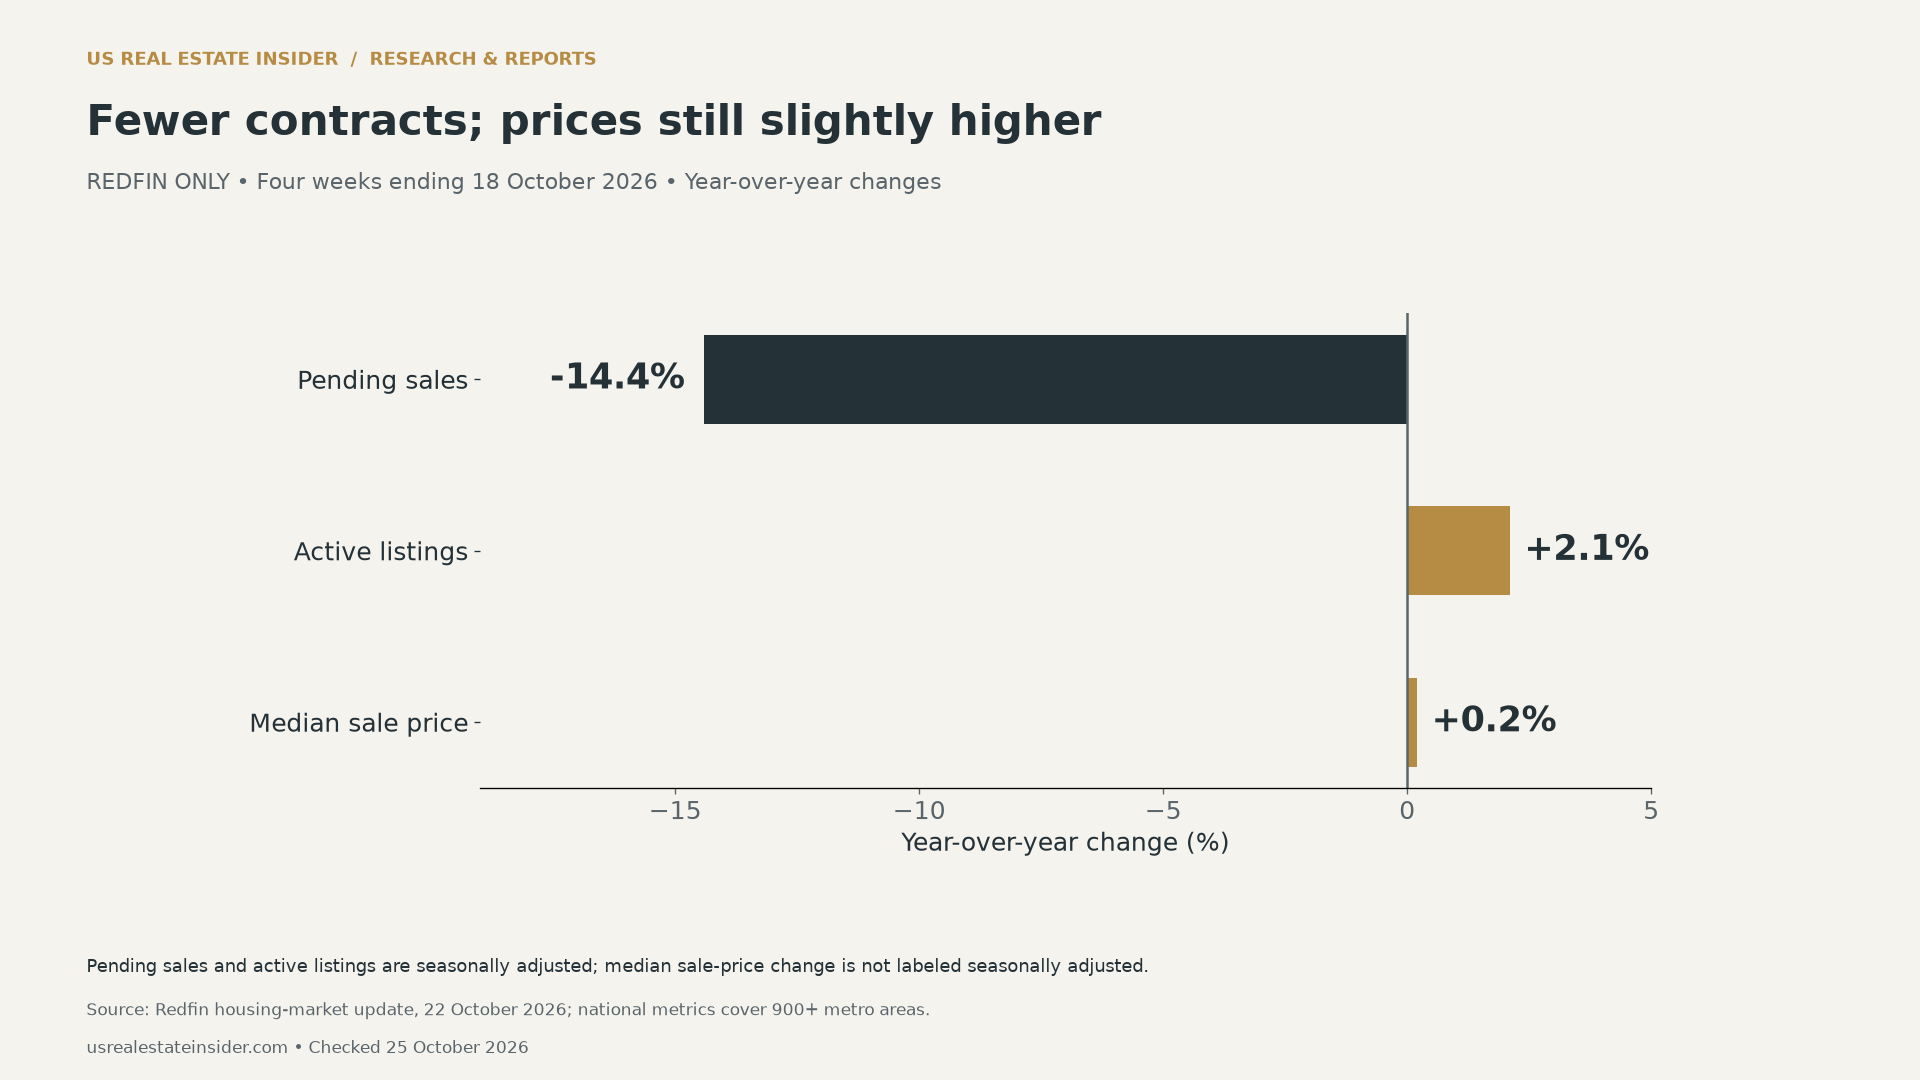
The price increase is small, but it is still an increase in the reported median. A median can change as the mix of homes sold changes. Therefore, this statistic does not establish how much the same house appreciated or depreciated. Fewer contracts and a slightly higher median can coexist.
We do not connect NAR’s 7.3% monthly decline to Redfin’s 14.4% annual decline as points on one trend line. The publishers, observation windows and comparison bases differ. Such a line could appear to show acceleration while actually comparing different measures.
| Report | Observation window | Comparison to keep visible |
|---|---|---|
| NAR, released October 20 | September 2026 | Monthly versus August; annual versus prior September |
| Redfin, released October 22 | Four weeks ending October 18 | Weekly and annual changes for its stated window |
Negotiating leverage and affordability are different
A seller may become more willing to discuss terms when a listing has fewer competing offers. Yet the buyer still needs to fund the loan, transaction costs and property expenses. A negotiated reduction can improve the deal without bringing the final payment within that household’s budget.
Our mortgage payment at 7.32% analysis shows this distinction through a fixed-loan calculation. The same approach can test an offer scenario. It cannot tell you whether the seller will agree, whether the property will appraise or whether a lender will approve the financing.
Worked offer scenario: lower price, substantial costs
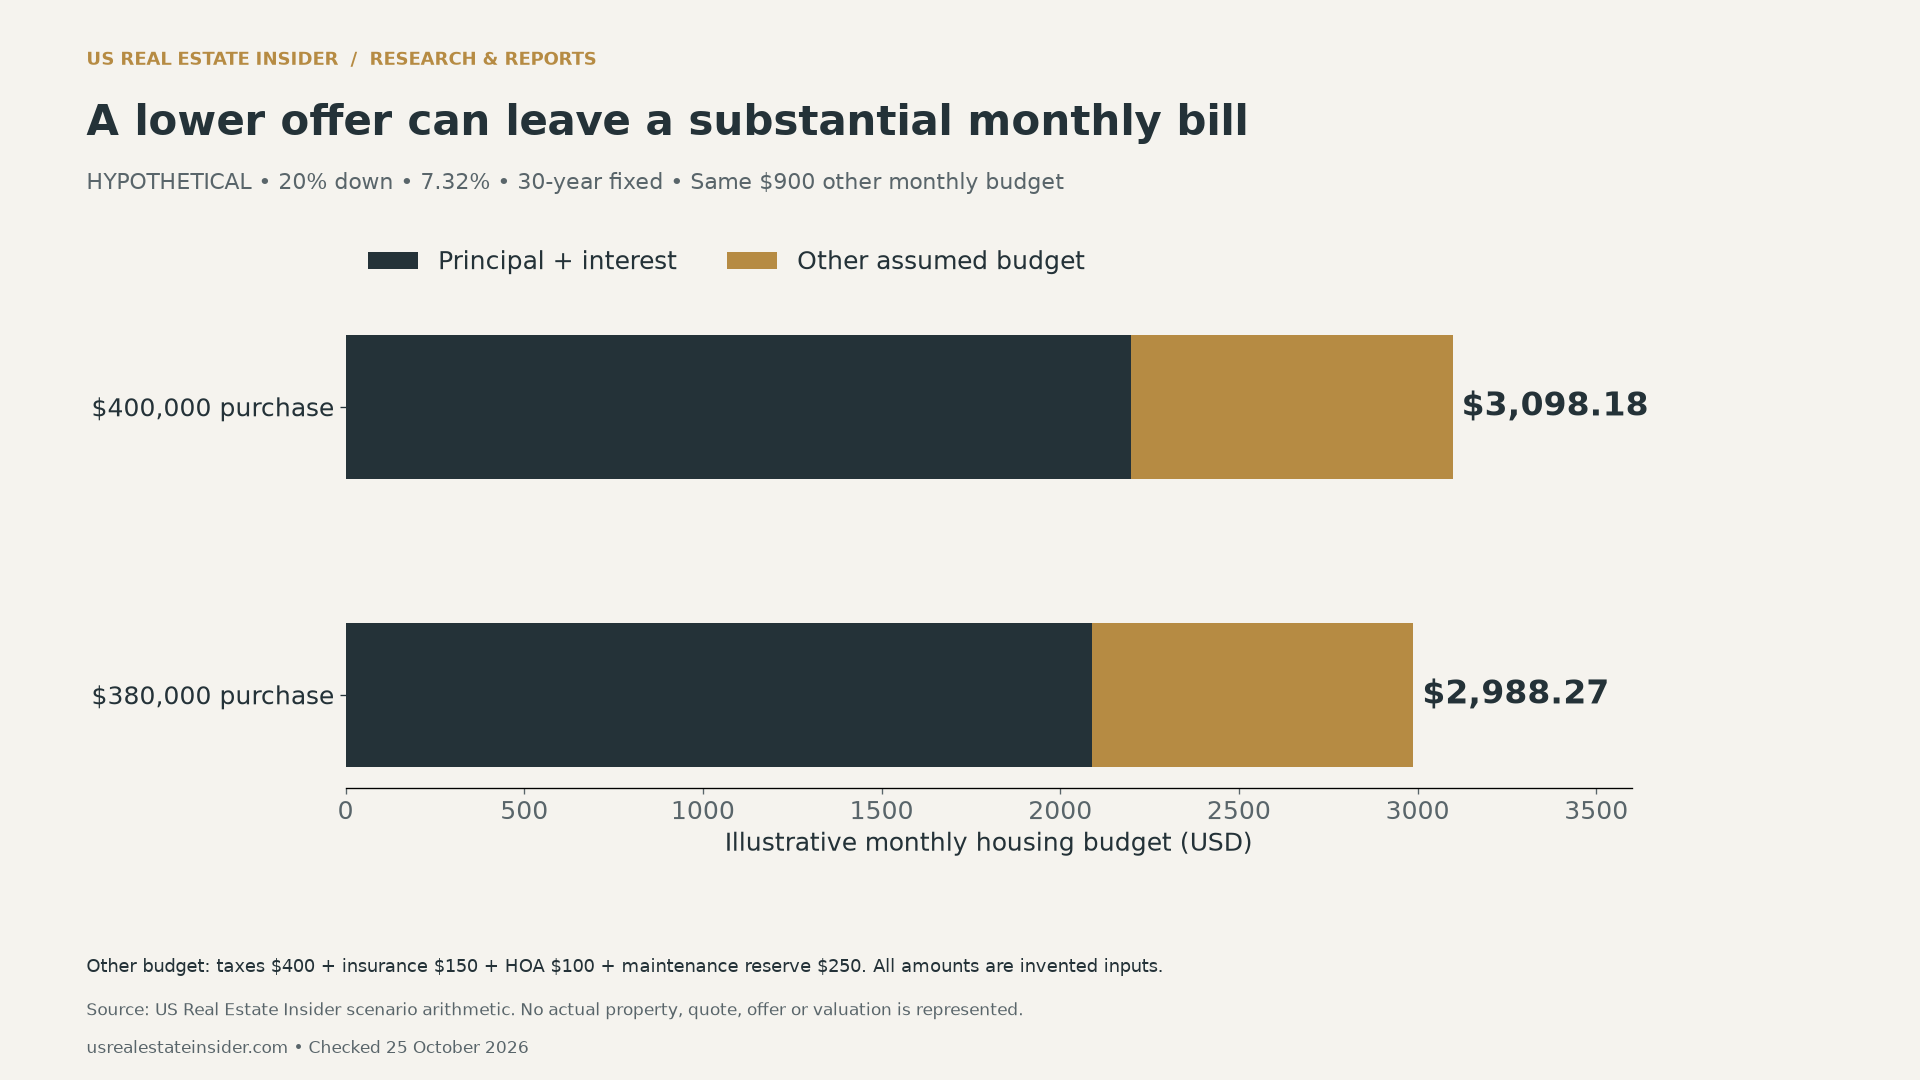
Assume a fictional home is offered at $400,000. Compare buying it at that price with a hypothetical $380,000 agreement. Both scenarios use 20% down, a 7.32% fixed rate and 360 monthly payments. The lower price is a test input, not a supported valuation or a promised 5% discount.
For illustration, add the same invented monthly budget to each loan payment: $400 property taxes, $150 insurance, $100 HOA charges and $250 maintenance reserves. These sum to $900. They are not national averages, lender quotes or observations about a real home.
| Scenario | Down payment | Principal and interest | Illustrative total monthly budget |
|---|---|---|---|
| $400,000 price | $80,000 | $2,198.18 | $3,098.18 |
| $380,000 price | $76,000 | $2,088.27 | $2,988.27 |
The monthly difference is $109.91, calculated before rounding. The cash down payment differs by $4,000. Closing costs, prepaid items and immediate repairs are additional cash questions; they are not included in either down-payment figure. Do not count escrowed taxes and insurance twice when adapting the example.
This example deliberately holds the other monthly assumptions constant to isolate the price effect. A real purchase might change the tax assessment, insurance quote or repair needs. Those differences belong in a second calculation. The lower negotiated price alone cannot establish the complete saving.
Build a property-level negotiation case
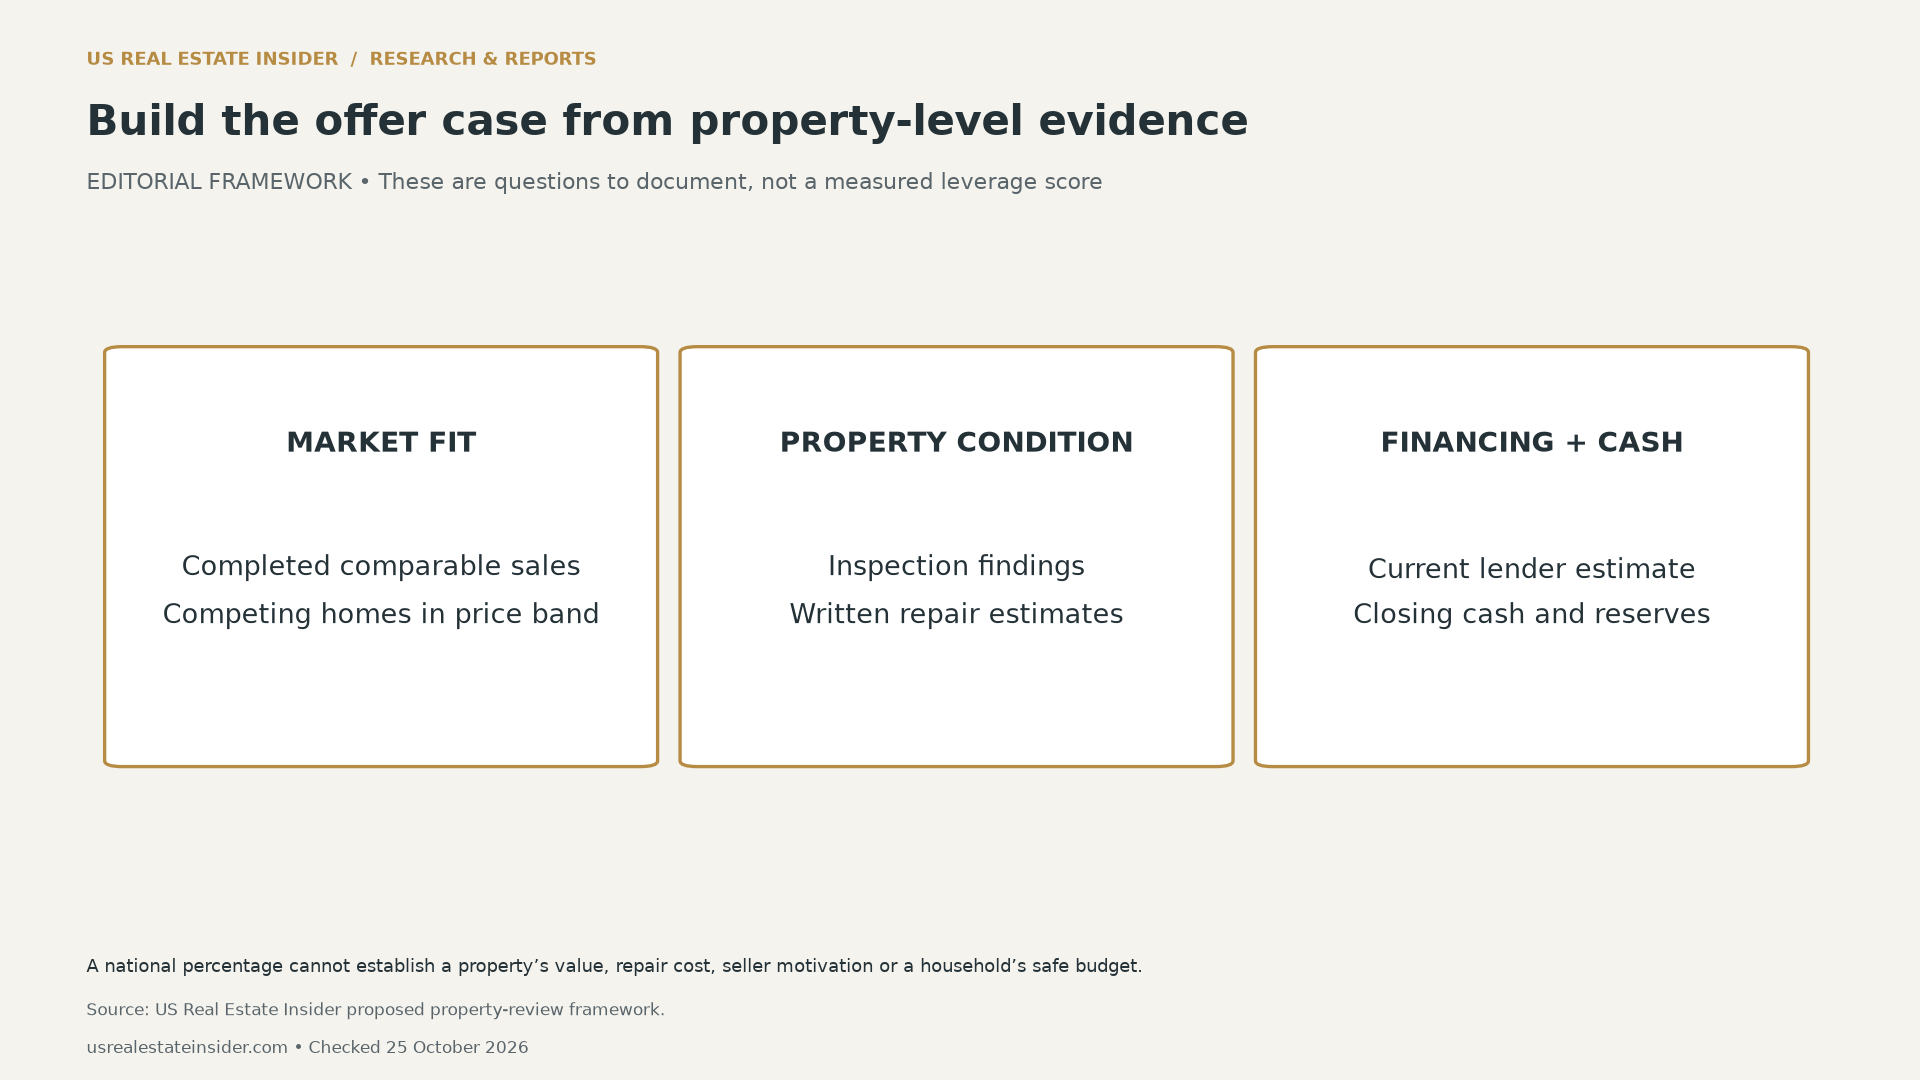
Start with completed comparable sales close in location, property type, size and condition. Record their dates and the source of each observation. Asking prices show what sellers seek; completed transactions show what was agreed and closed. Neither is useful without checking whether the homes are actually comparable.
Next, document listing age and price history. A long marketing period can justify asking questions, but it does not prove distress or establish a specific discount. A listing may have changed agents, been withdrawn or returned to market. Keep those events separate from uninterrupted time for sale.

Then use inspection findings and written repair estimates to clarify condition. Distinguish necessary work from optional improvements. Keep a repair request, a seller credit and a purchase-price reduction separate in the comparison. Ask the relevant lender and transaction professionals how proposed terms affect the actual financing and closing documents.
For sellers, the same evidence can help evaluate a price change or concession. Consider nearby competing homes, current condition and the full proposed terms. The national contract decline is background context. It cannot reveal a specific buyer’s financing position or the seller’s best response.
Downloads, methodology and limitations
Use the illustrative offer budgets (CSV) to reproduce the two price scenarios. The property negotiation worksheet (CSV) is blank so readers can record their own observations. No local property survey or appraisal was conducted.
The charts retain each publisher’s stated period and comparison basis. We transcribed the displayed release figures and did not combine their samples, estimate a causal effect or forecast home prices. Our mortgage equation and rounding follow the linked payment analysis. A budget illustration is not an estimate of the typical buyer’s expenses.
Suggested citation: US Real Estate Insider, “Pending Home Sales Fall 7.3%: Do Buyers Have More Leverage?”, checked October 25, 2026. Cite NAR and Redfin for their respective dated observations. Cite this report for the offer-budget illustration and property-evidence framework, retaining their hypothetical status.