



A real estate closing pipeline forecast should separate signed contracts, anticipated closings and money actually received. National pending-sales news can help frame market activity, but it cannot date a particular commission receipt. Our fictional three-contract example shows why two delays can reduce this month’s receipts from $12,000 to $4,000 without cancelling the remaining $8,000.
What October pending sales can tell you
The National Association of REALTORS® reported on 18 November that October pending sales fell 4.7% month over month and 16.7% year over year. All four major regions recorded declines on both comparisons. The indicator concerns signed contracts on existing homes, rather than money received by an individual agent.
NAR’s methodology page explains the usual gap between contract signing and completed sales. Many transactions close one or two months later, but some take longer or fail to close. That aggregate relationship is not a promise about your own pipeline.
We link to NAR’s release and methodology instead of reproducing its tables or figures. The downloads and charts below are our own fictional planning tools. They do not turn the national decline into an agent’s cancellation probability or projected loss.
Build a real estate closing pipeline forecast by contract
Give each transaction an internal reference. Record the remaining conditions, anticipated close, agreed compensation basis, brokerage deductions and expected receipt date. Keep an actual receipt field separate. A single expected-total column conceals whether the underlying entries are signed, closed or paid.
Use the compensation terms that actually apply to that transaction. Our $4,000 amounts are invented net amounts after brokerage deductions, before tax and operating expenses. They are not a standard commission, a suggested fee or an estimate of market earnings.
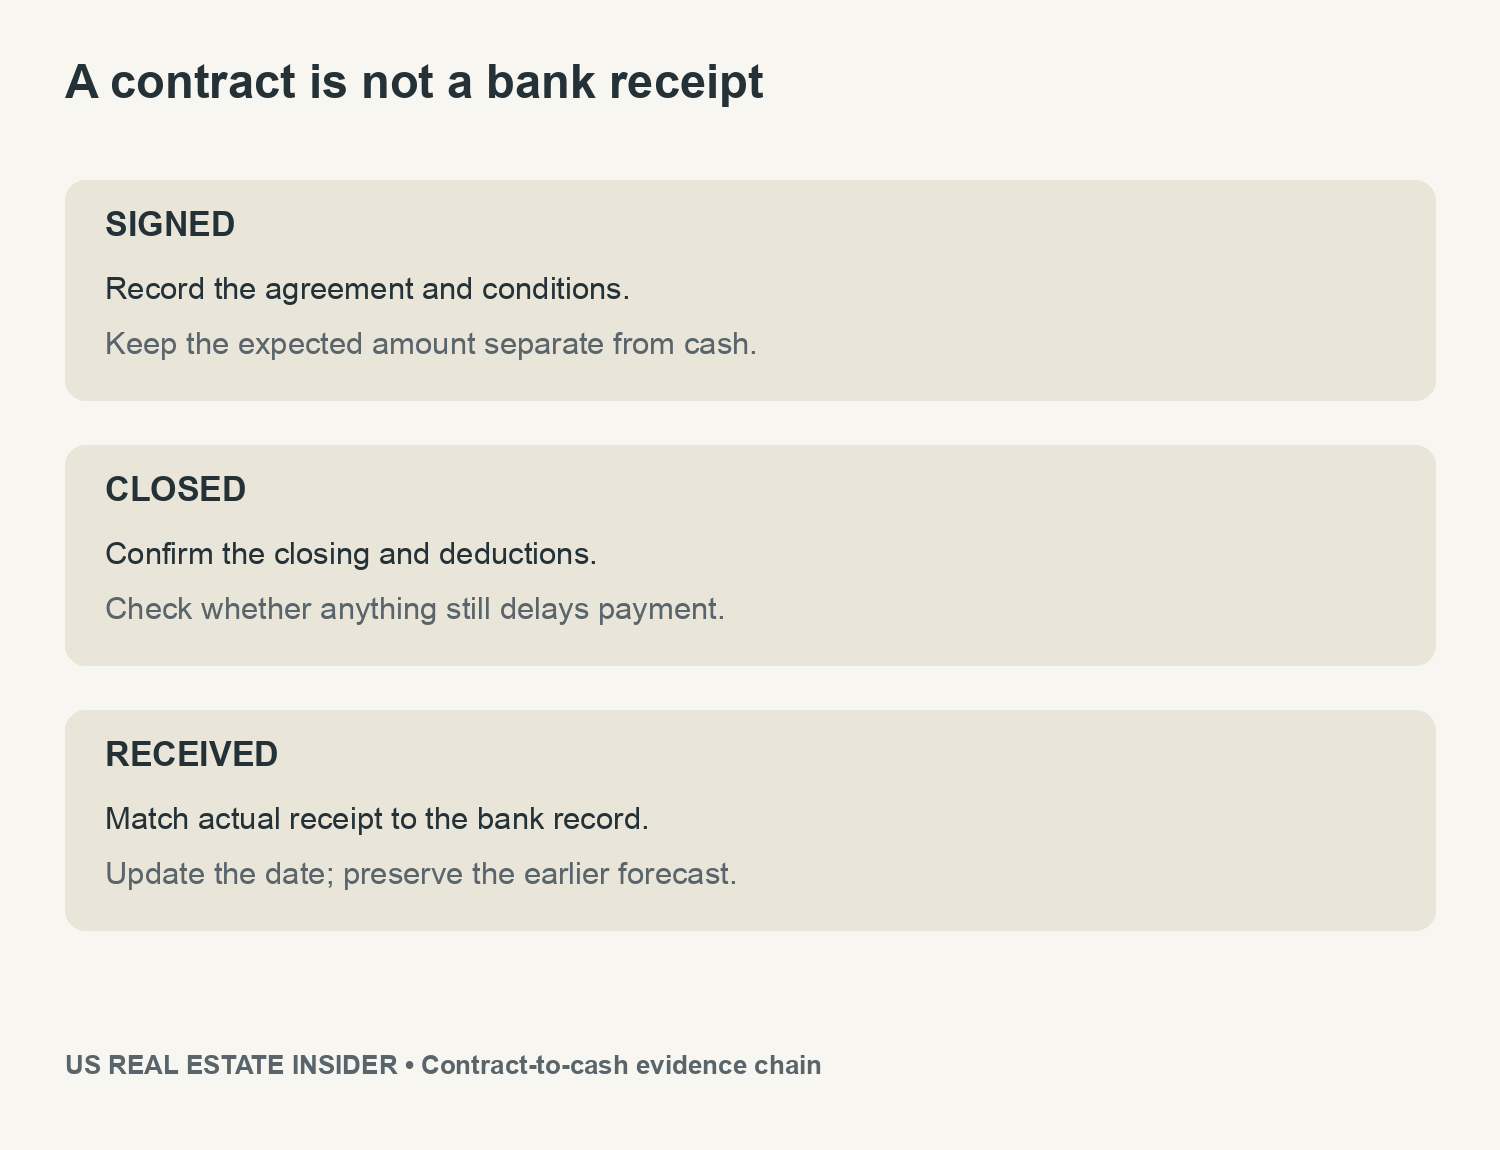
Test two delays before committing this month’s cash
In the baseline, fictional contracts F1, F2 and F3 each produce a $4,000 receipt in month 1. Total receipts are 3 × $4,000 = $12,000. Now move F2 and F3 into month 2 while F1 remains on time. Month 1 falls to $4,000 and month 2 receives $8,000.
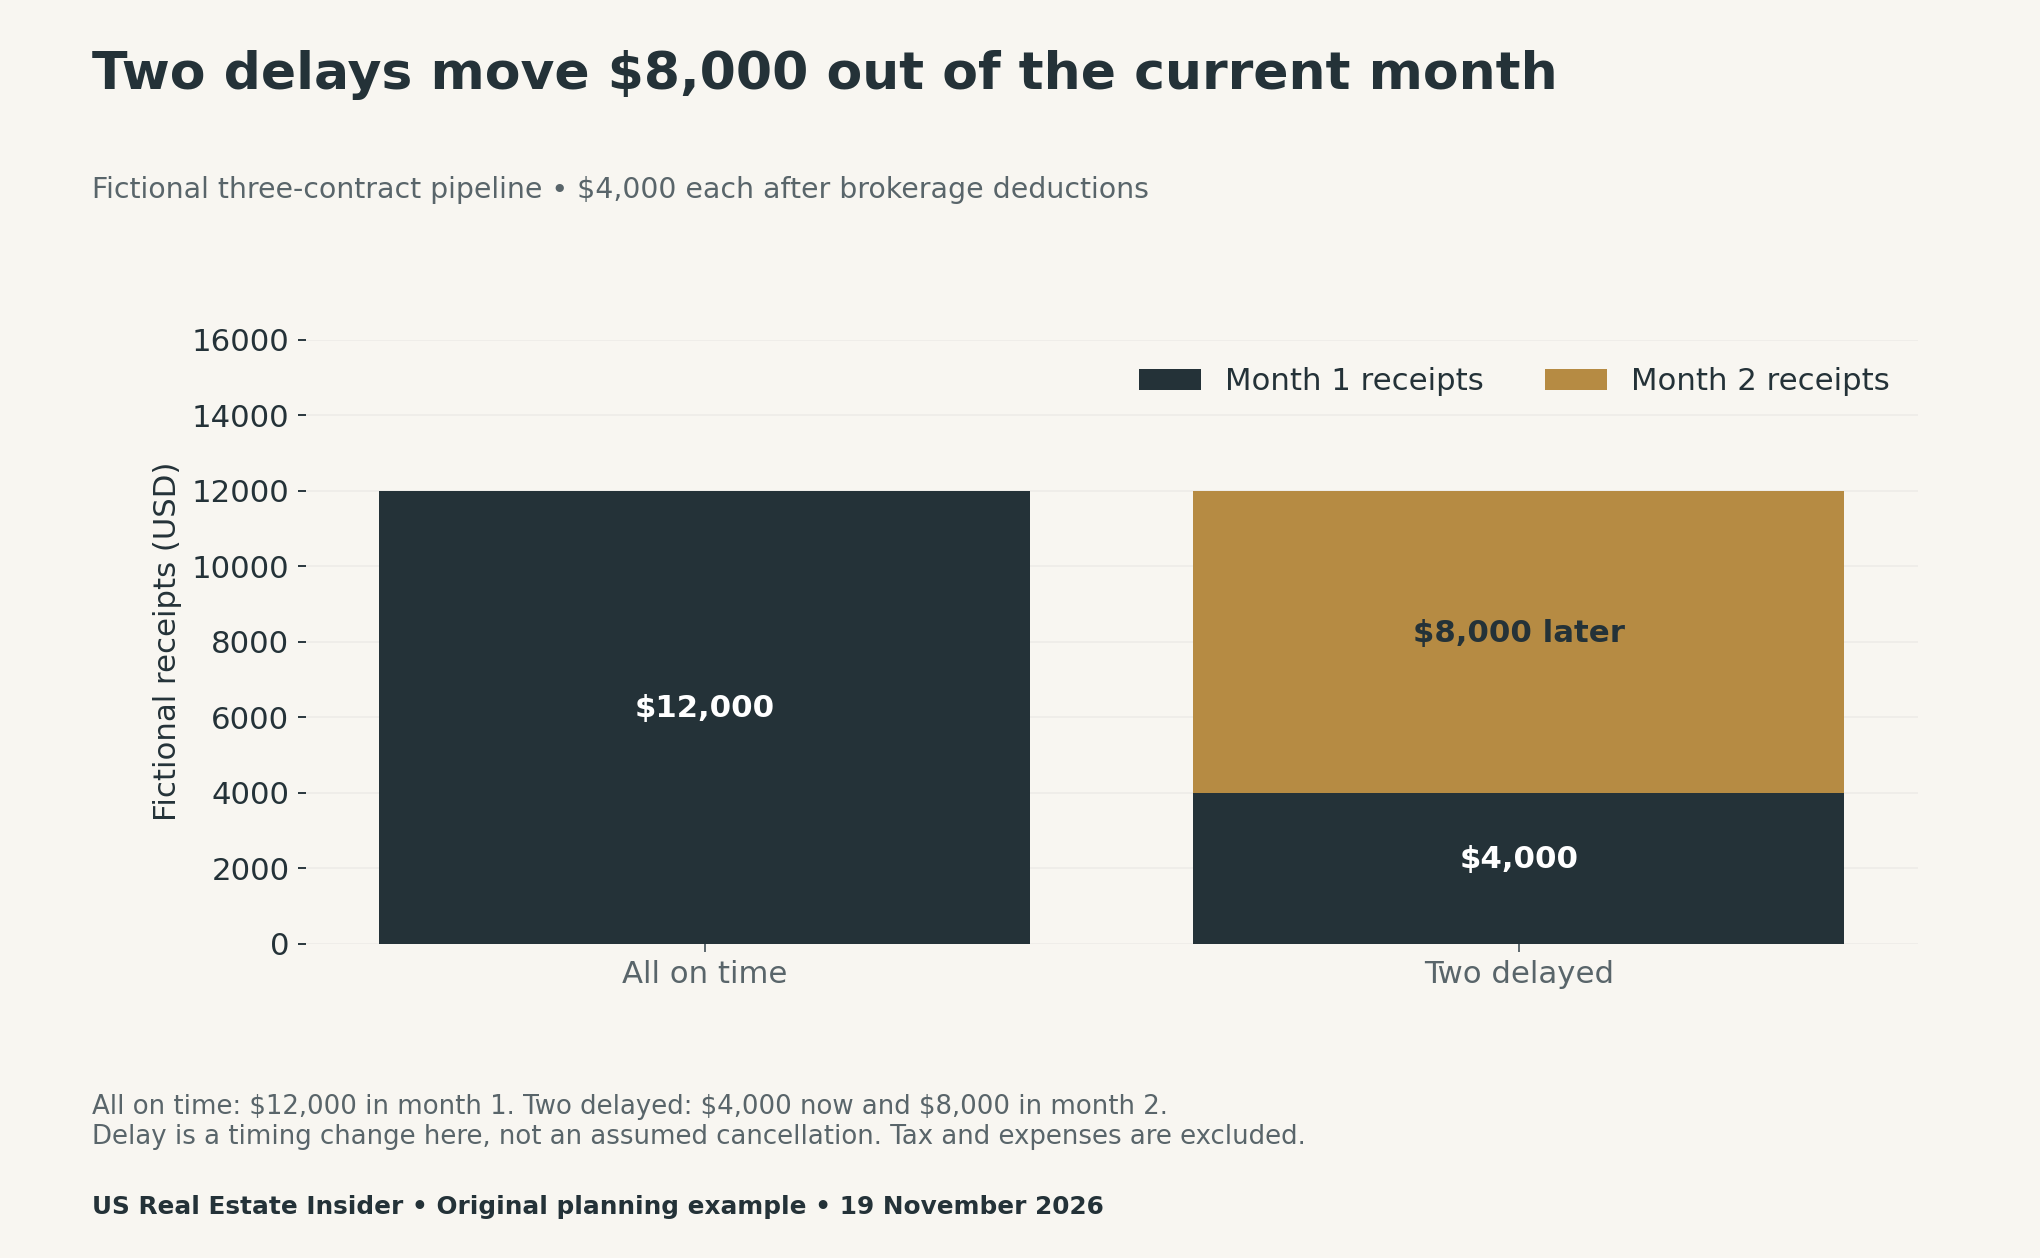
The immediate shortfall against the original month-1 expectation is $8,000. However, the example still totals $12,000 over two months. A timing gap and an eventual loss are different planning problems. Describe the former as delayed until evidence establishes a different outcome.
Read cumulative cash as well as the monthly total
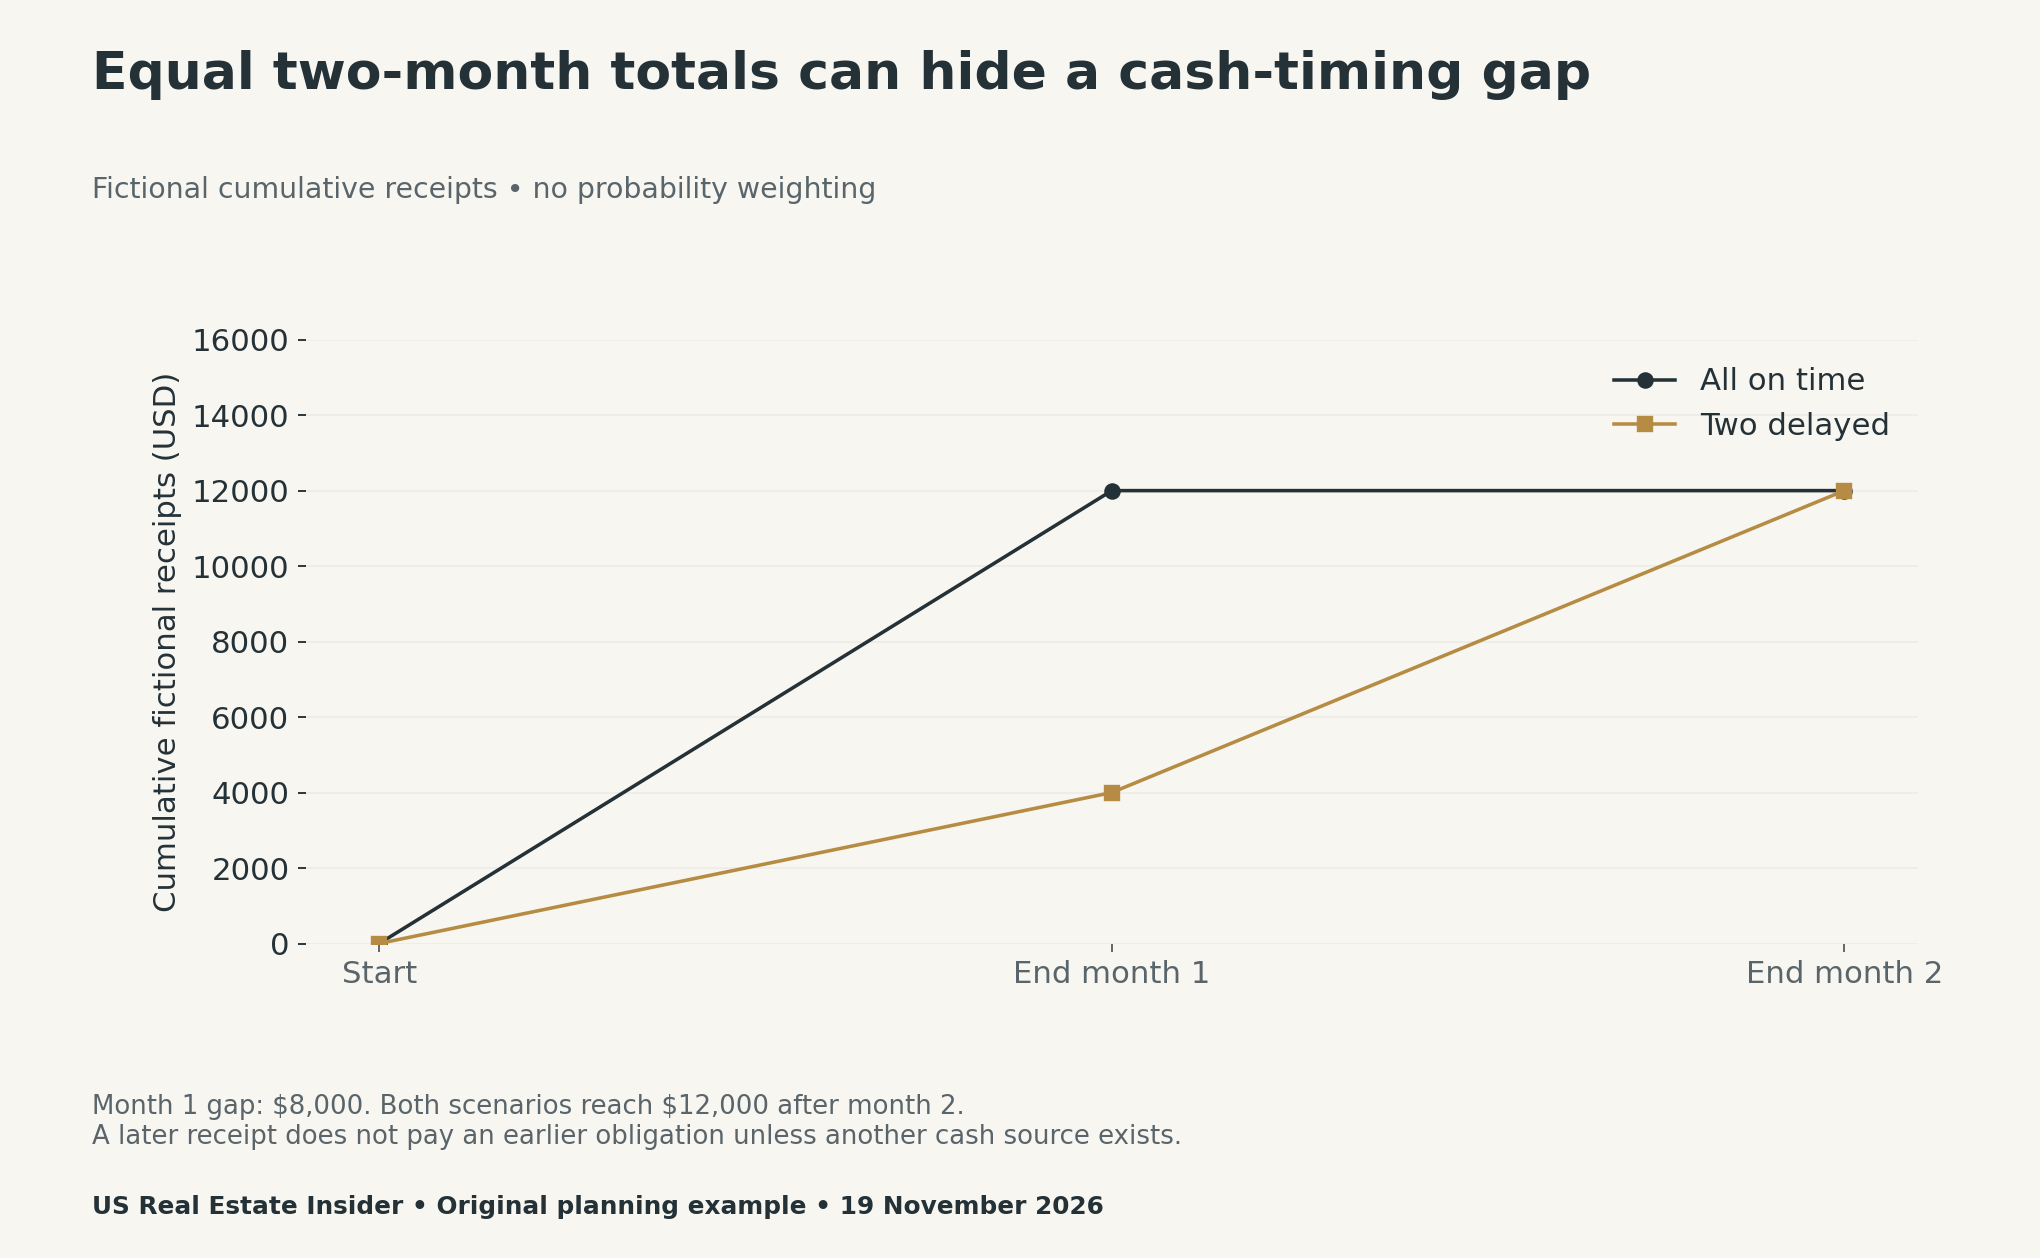
A two-month sum can make the delay look harmless. Yet a bill due in month 1 needs a current payment source. Review existing cash and the timing of obligations separately from expected closings. Avoid treating every signed contract as immediately spendable cash.
For practical bookkeeping, maintain a dated snapshot. When a closing date moves, retain the old forecast alongside the revised one. This makes it possible to explain the difference later, rather than rewriting history to make the plan look accurate.
Model cancellation separately from delay
Our third scenario keeps F1 in month 1, moves F2 to month 2 and cancels F3. In this constructed case, receipts become $4,000 plus $4,000, totaling $8,000. The cancelled $4,000 is not placed in a later month. Actual rights to compensation depend on the agreement and circumstances.
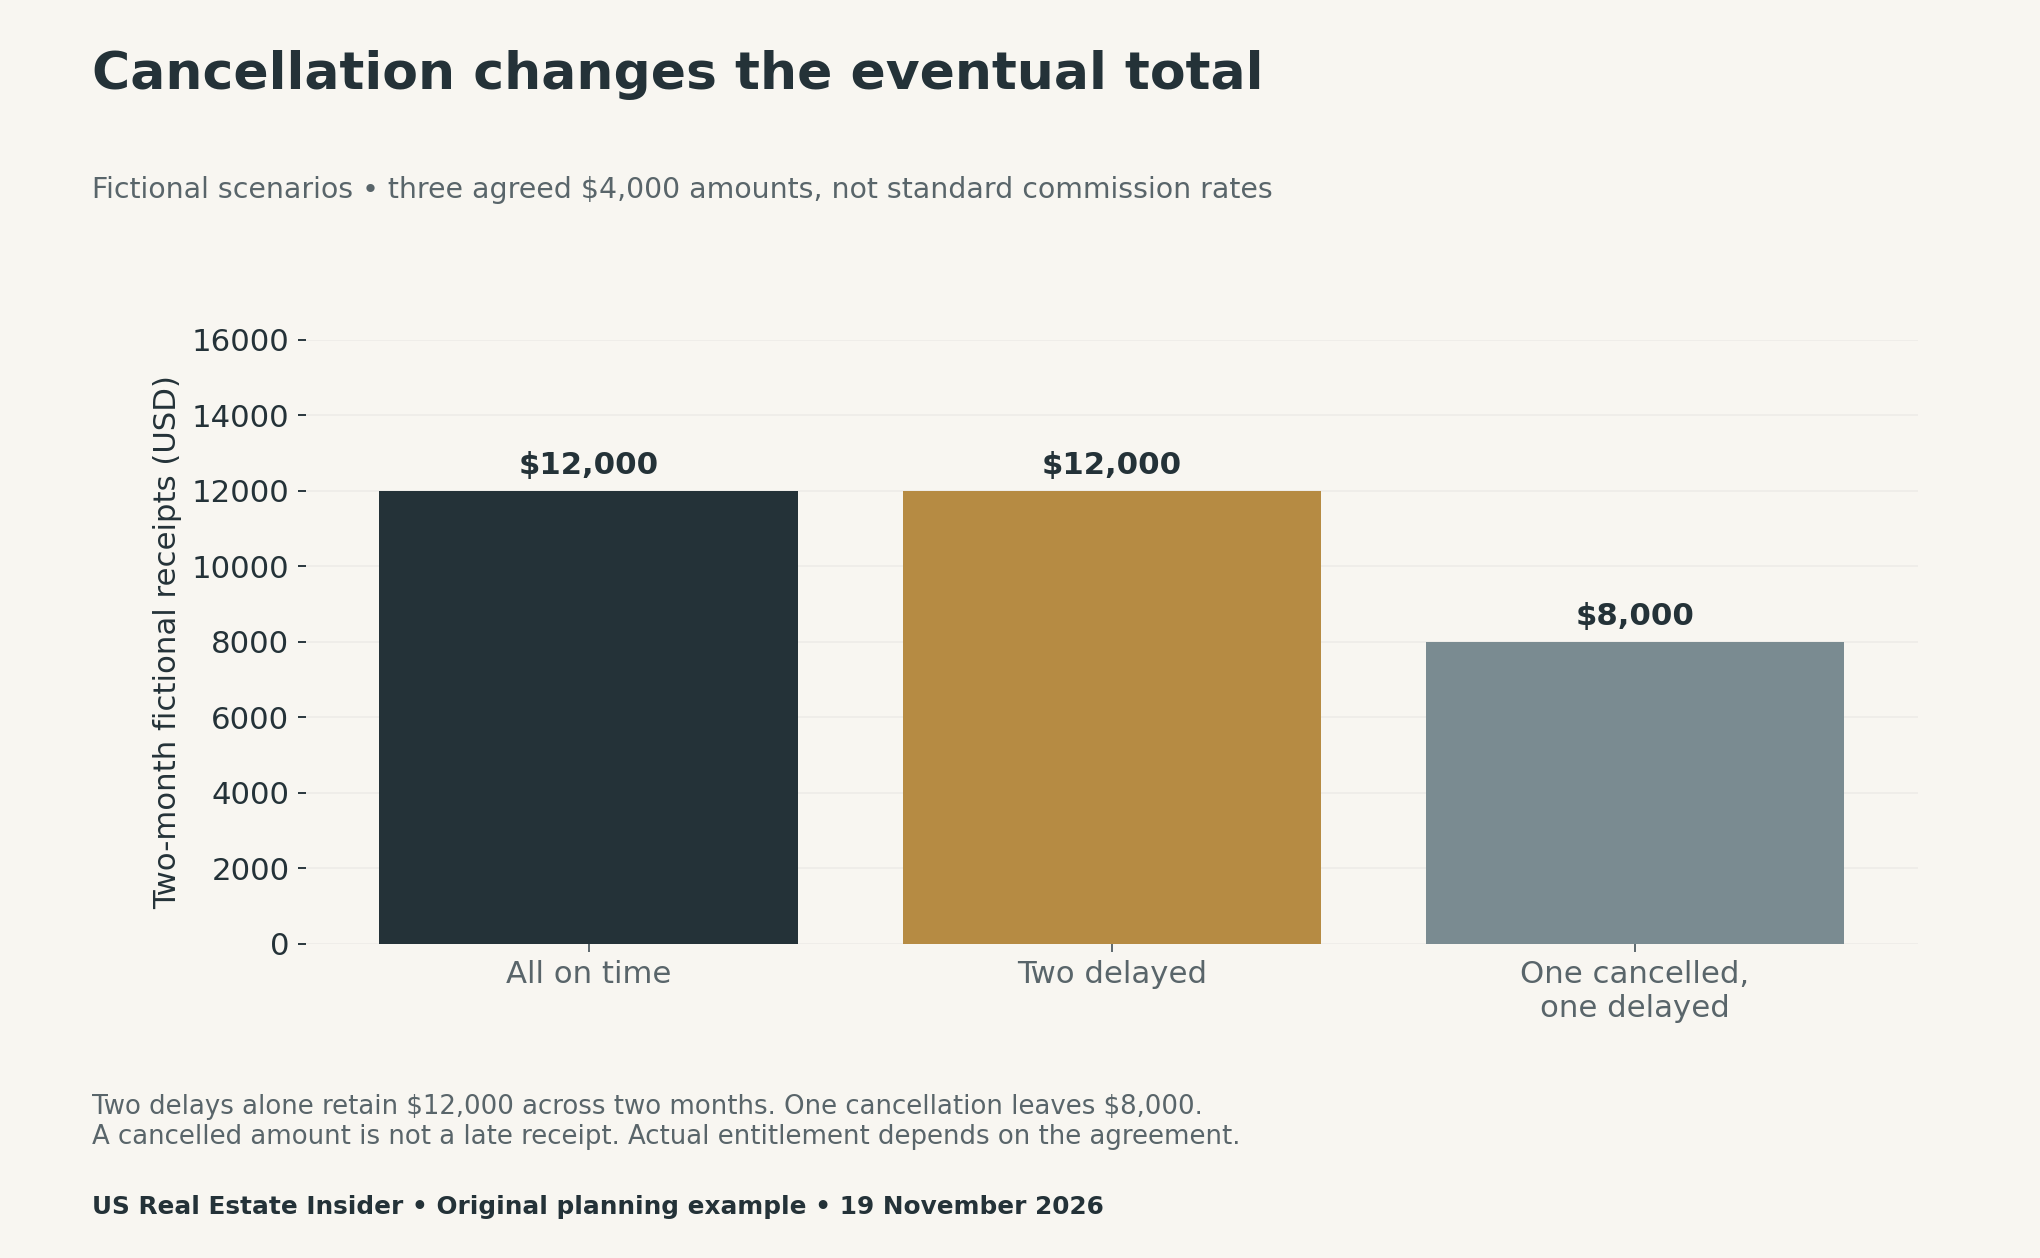
Do not multiply every contract by the national pending-sales decline to invent an expected receipt. A market-level change in contract activity is not a transaction-level probability. If you use probability-weighted planning elsewhere, document the basis and keep it separate from confirmed cash.
Use a status register with evidence and review dates
The blank register includes conditions, dates, deductions, expected net receipts and supporting evidence. It also provides a next-review field. A missing document or unresolved financing condition should remain visible rather than becoming an optimistic receipt date.
For instance, a transaction may have a scheduled close but no confirmed disbursement timing. That belongs in an unresolved field. Ask the relevant transaction and brokerage professionals for the evidence you need; the national release cannot supply it.
Keep client names, financial documents and other private details out of a publicly shared file. The teaching downloads contain invented contract references only. Use your own secure working copy for confidential business records.
Download the scenario tools
- Primary-source and reuse-context links (CSV)
- Nine contract-level rows across three fictional scenarios (CSV)
- Fictional monthly receipts, cancellations and totals (CSV)
- Blank contract-to-cash evidence register (CSV)
For another timing-versus-stock distinction, see our HELOC and emergency-fund comparison. Our refinance denominator analysis explains why a national percentage cannot answer a different individual question.
Methodology and limitations
We checked NAR’s first-party release, methodology and citation guidance on 19 November 2026. Only selected factual headline measures are discussed. No NAR table, chart or bulk statistical dataset is republished in the article or downloads.
The charts sum three invented $4,000 amounts under explicitly stated timing and cancellation assumptions. Taxes, operating expenses, payment disputes and financing costs are outside this example. It is a cash-planning illustration, not an earnings forecast, accounting treatment or legal interpretation of a compensation agreement.


