







The first-time home buyer age 2026 headline is 40. But that single median hides an important financing split. The National Association of REALTORS® reports a median age of 38 for first-time buyers who financed and 54 for those who paid cash. Those figures describe people who completed purchases, rather than everyone who hopes to own a home.
The useful question is therefore about the population behind the number. A national median can help explain the market. It cannot tell you that you are early, late or personally ready to buy.
Research date: November 7, 2026. Source release: November 5, 2026. Purchase period: July 2025–June 2026. Our contribution is a reproducible comparison and survey-reading guide, with three charts and four CSV tools.
First-time home buyer age 2026: the financing split
The new NAR buyer-profile release gives three medians. The overall first-time group includes both cash and financed purchasers. It is not a third, separate category that can be added to the others.
| Buyer group | Median age | How to read it |
|---|---|---|
| All first-time buyers | 40 years | Overall group |
| Financed first-time buyers | 38 years | Financing subgroup |
| All-cash first-time buyers | 54 years | Cash subgroup |
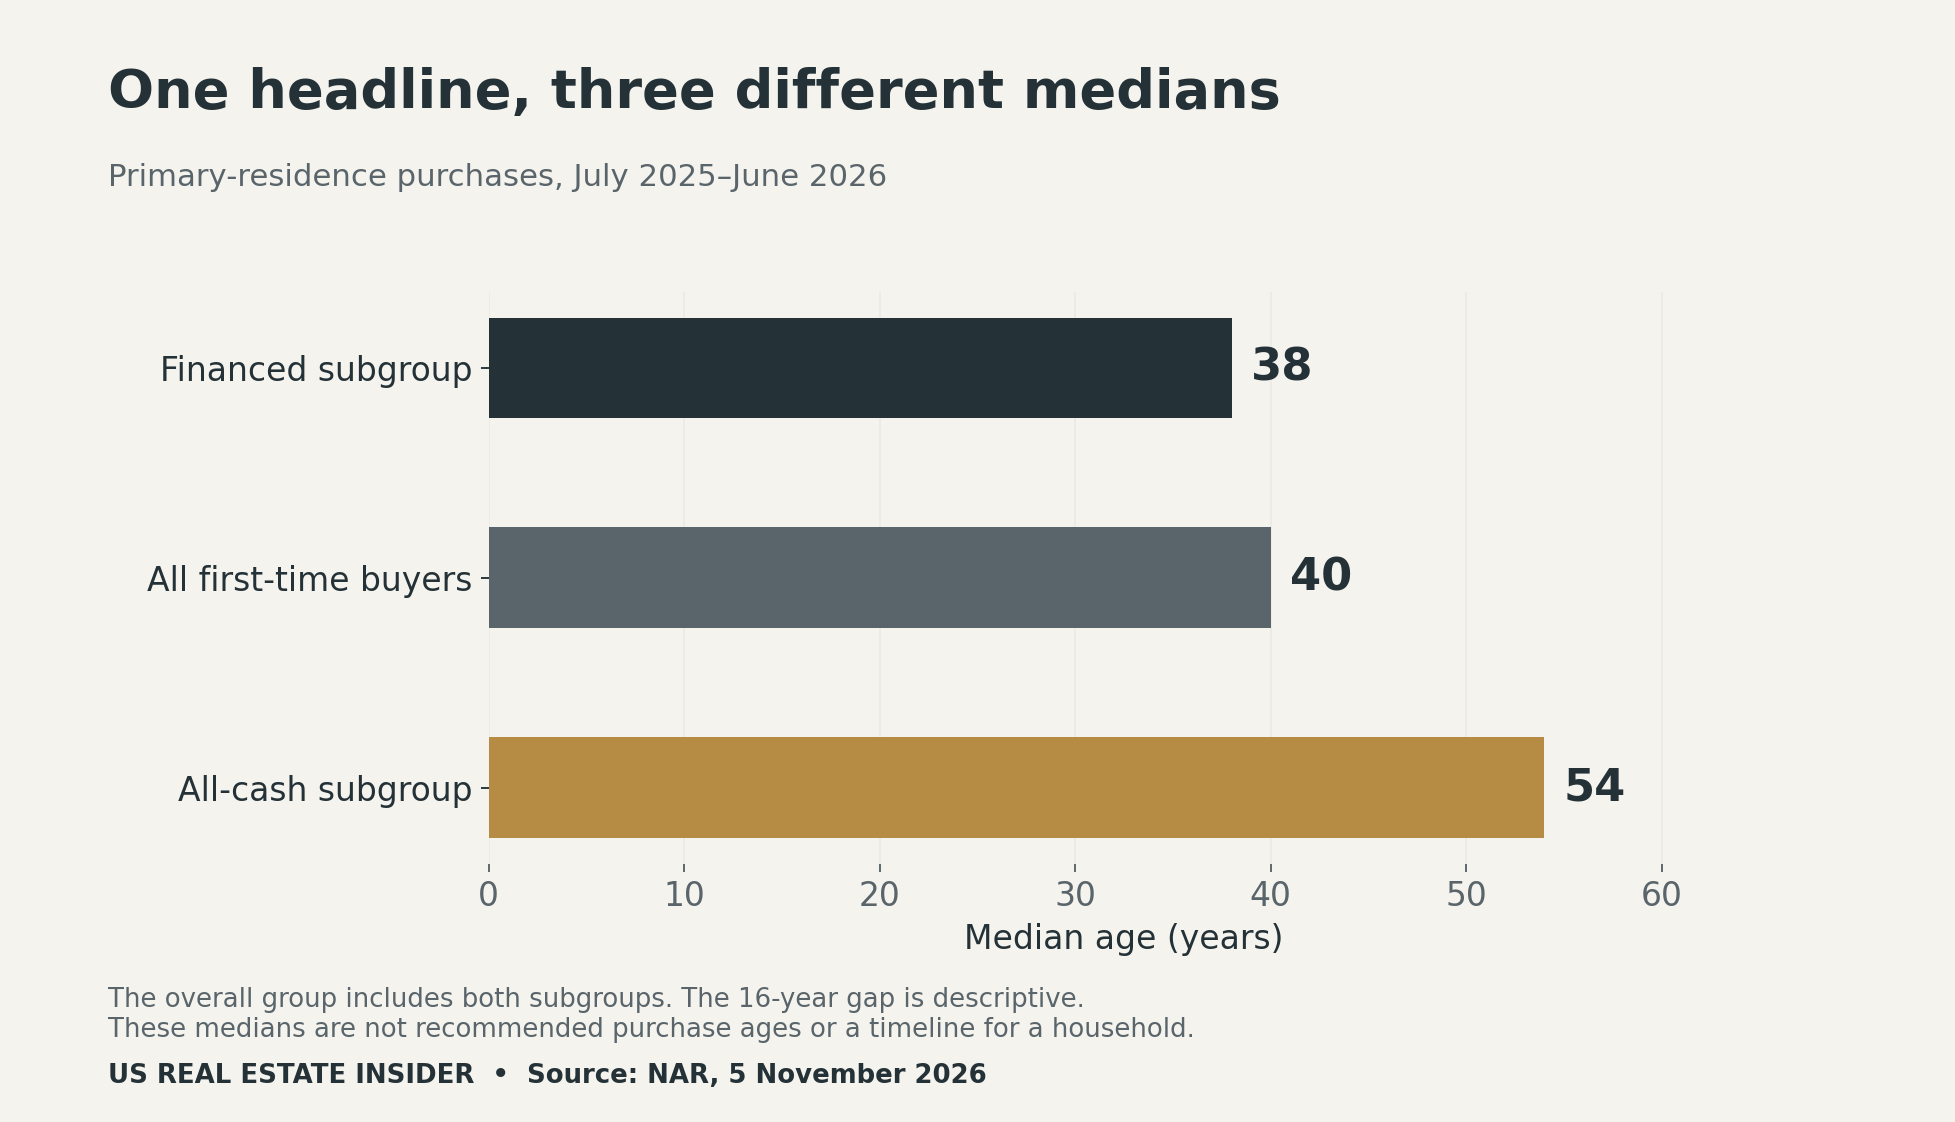
Our subtraction is straightforward: 54 − 38 = 16 years. However, the meaning needs care. This is a gap between two groups at one point in the survey series. It is not evidence that the same household waits sixteen extra years by paying cash. Nor does choosing financing make a household sixteen years younger.
A median is a middle value in an ordered distribution. It differs from an arithmetic average. To reconstruct the combined median, an analyst needs the underlying age distributions. Multiplying each subgroup median by its share does not recover the overall median. We therefore leave that invalid calculation out of the download.
Cash share and purchase share answer different questions
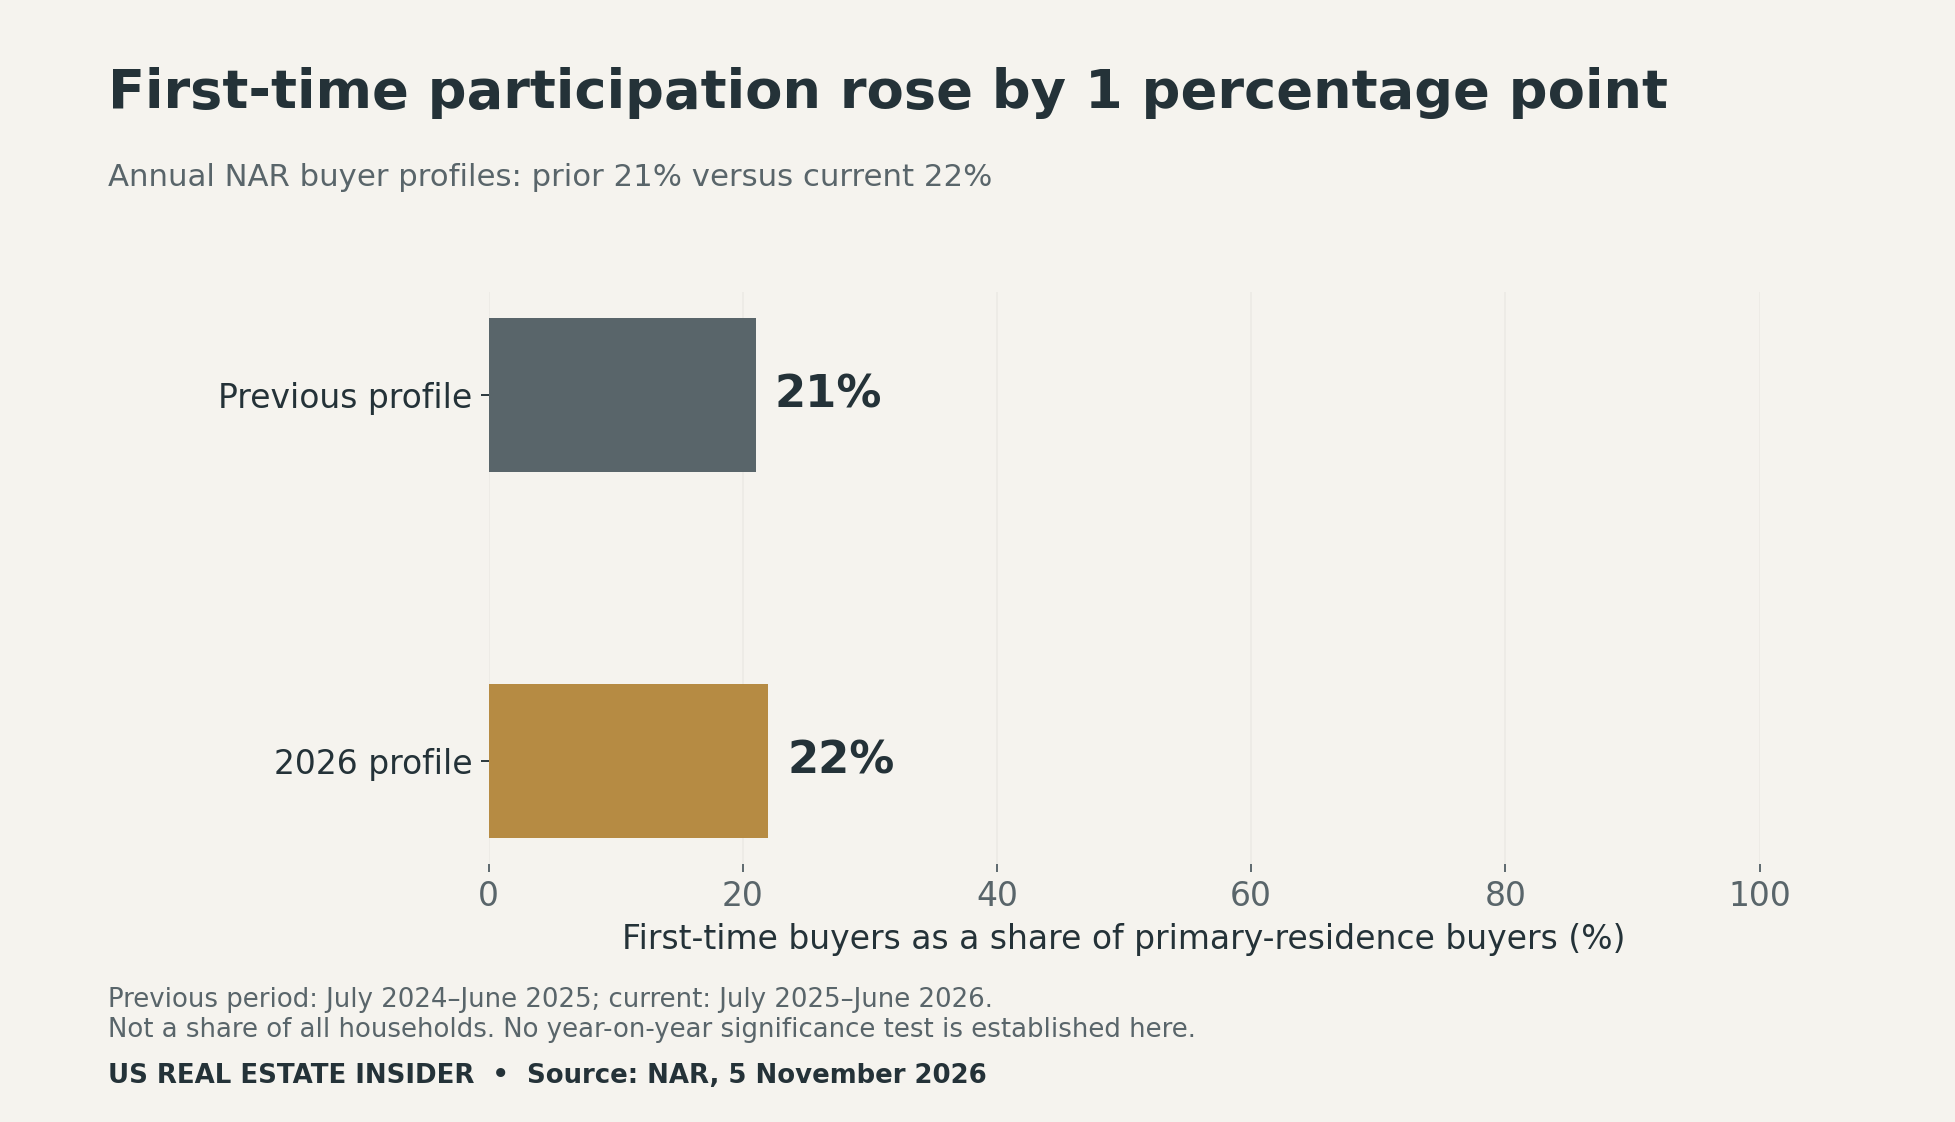
NAR places first-time buyers at 22% of primary-residence purchasers, compared with 21% in the preceding profile. That is an increase of one percentage point. It is not a one-percent increase, and this article does not establish whether the change is statistically meaningful.
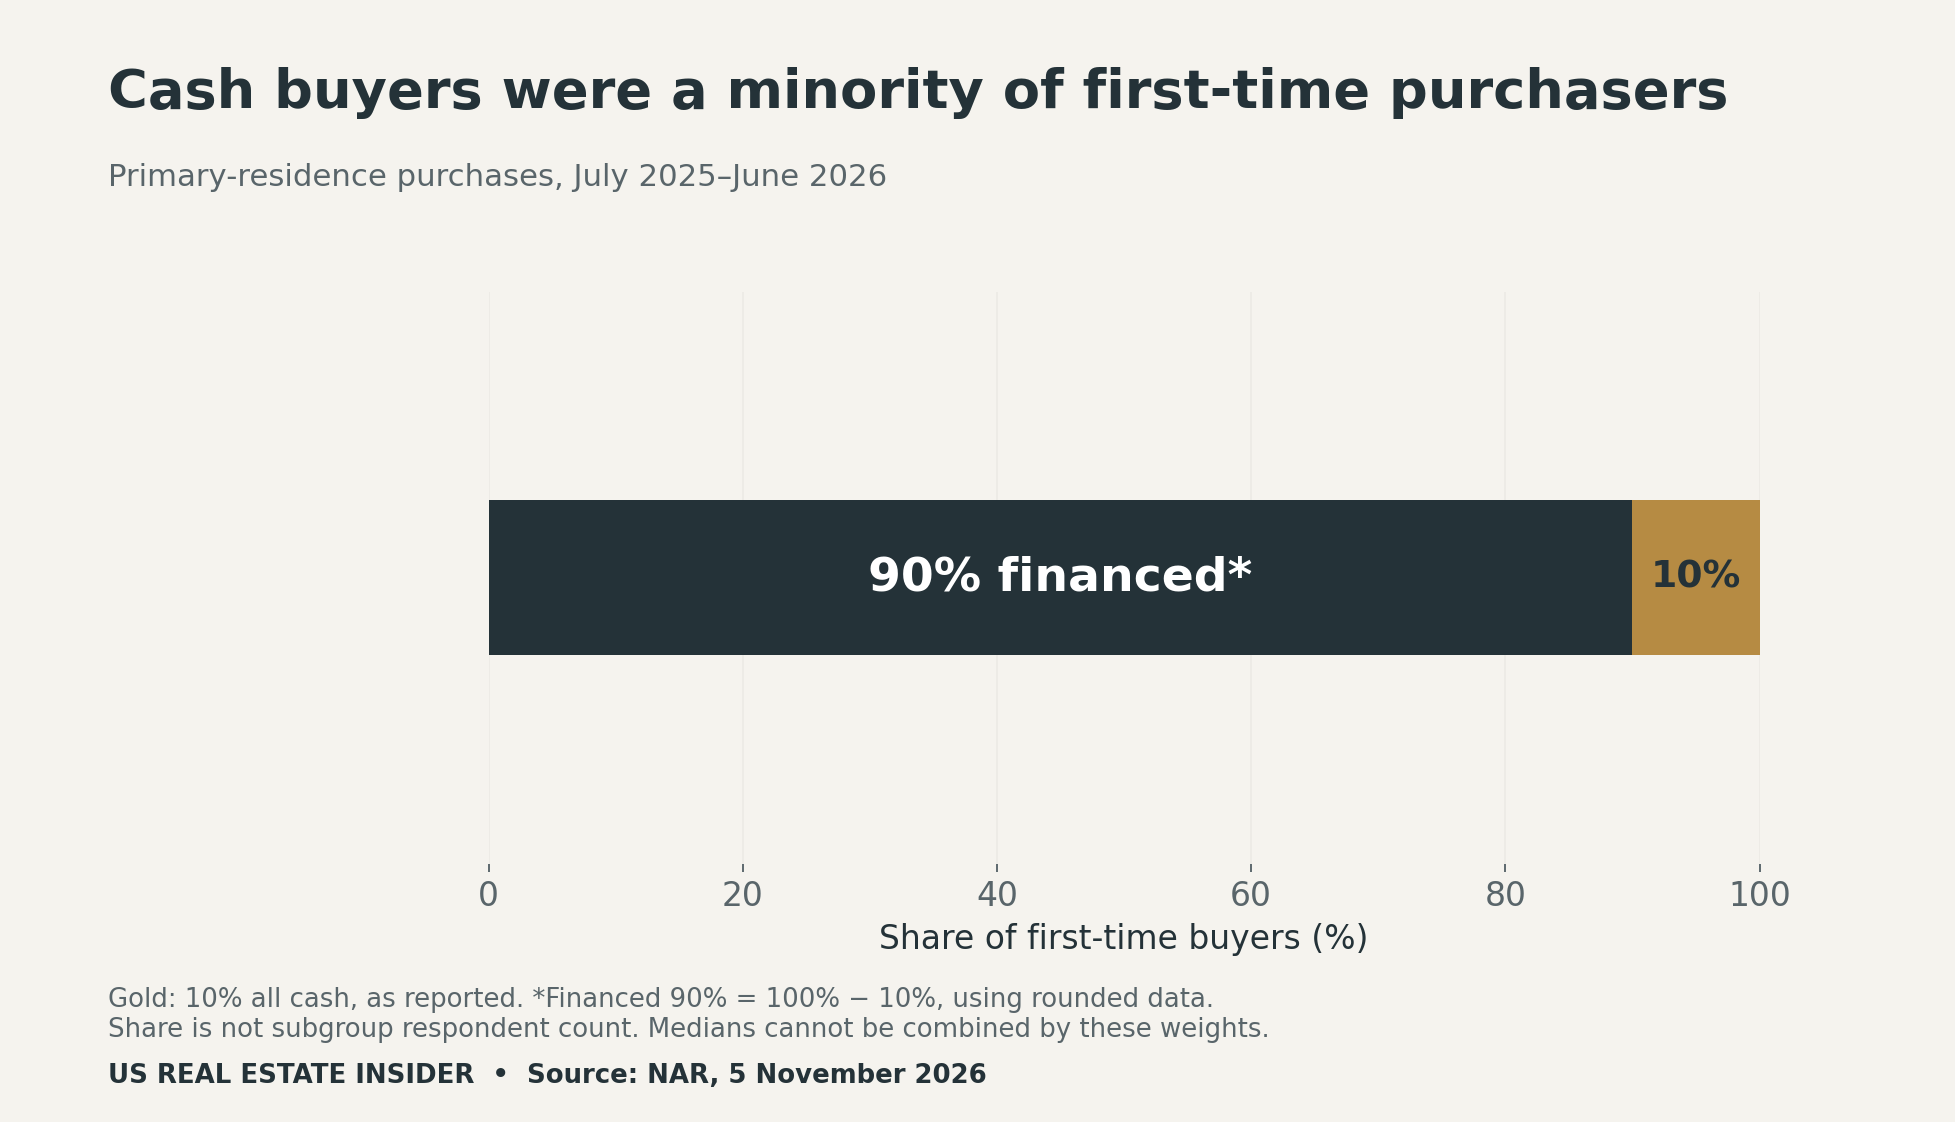
Now change the denominator. Within the first-time group, 10% paid all cash. The complement is approximately 90% financed, calculated from that rounded share. These percentages describe purchase methods among successful first-time buyers. They do not count mortgage applicants, rejected applications or households outside the market.
Keep those two questions separate when reading local coverage. First ask, “Share of which group?” Then ask, “Over what period?” A first-time share of purchases and a cash share within first-time purchasers cannot substitute for each other.
Who is missing from a completed-buyer survey?
NAR received 7,125 primary-residence responses after contacting a sample of 228,250 recent buyers. Its published methodology describes geographic weighting and an adjusted response rate of 3.1%. The results concern owner-occupants and exclude investor and vacation-home purchases. The response total is not the first-time subgroup size.
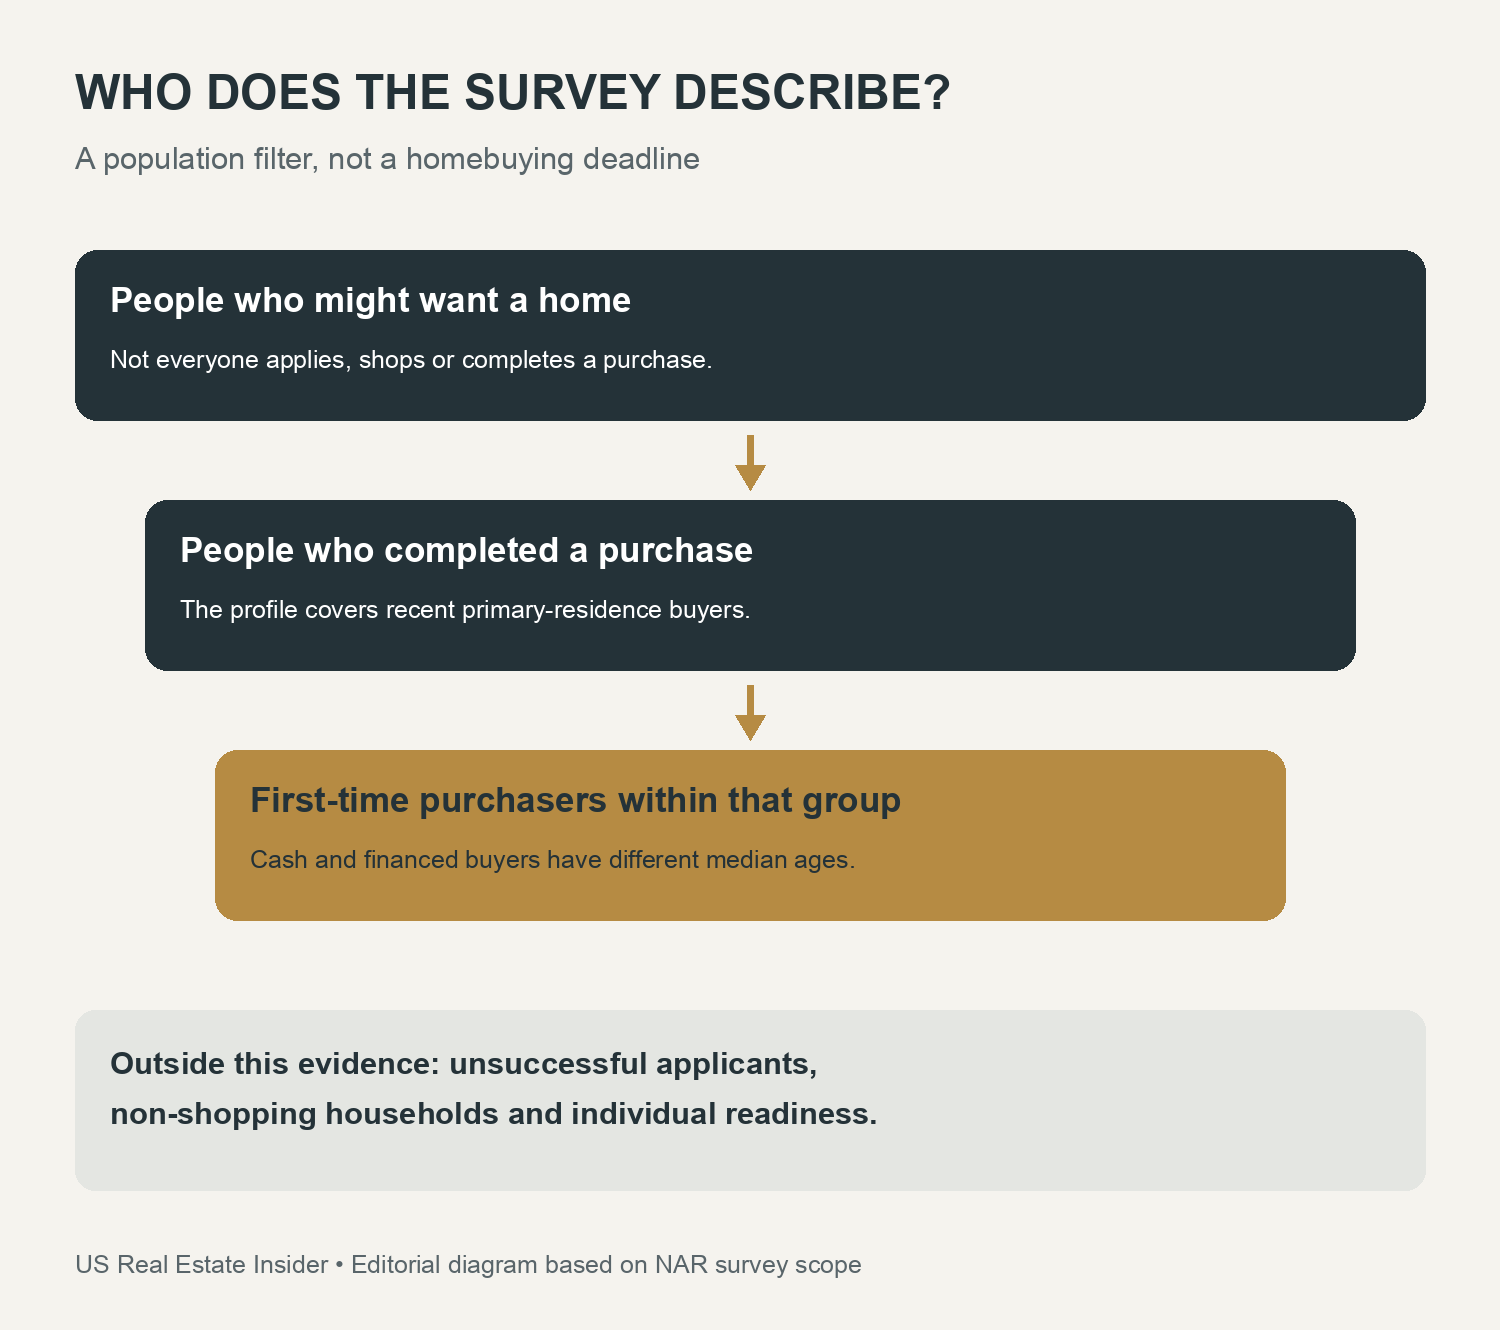
This creates a practical limit. Imagine two households with the same age and savings. One completes a purchase; the other pauses its search. A completed-purchase survey can describe the first household. It does not automatically capture the second. Looking only at successful purchasers cannot establish either household’s odds of success.
The same caution applies to explanations. A gap between cash and financed buyers may prompt questions about resources, housing needs and life stage. The three medians alone cannot isolate a cause. We do not treat inheritance, income or a particular financing choice as a proven explanation for the age gap.
Use a readiness worksheet instead of an age deadline
For your own decision, replace the national age comparison with evidence you can collect. The CFPB’s homebuying readiness guide asks about reliable income, debts, savings and the ability to meet ownership costs. Our blank worksheet helps organize those questions. It is not a lender eligibility score.
- Write down the housing needs the property must meet, including likely changes in your household.
- Build a full monthly cost estimate. Include taxes, insurance, applicable dues and maintenance alongside the mortgage payment.
- Separate cash for closing from money reserved for emergencies, moving and other goals.
- Record the source and date of each insurance quote, tax estimate or financing term.
- List unresolved questions and the professional or source that can answer each one.
The CFPB’s homebuying budget guidance explains why available savings and the full payment matter. Keep the worksheet private once you enter personal figures; the public file is blank. You do not need to publish income, account details or a lender’s confidential documents to use it.
For a separate payment example, see our mortgage-payment analysis. Its rate scenario is dated and is not a current quote. Our house-price index versus median-price guide also explains why another national statistic cannot price an individual home. Finally, the builder-cancellation guide distinguishes a reported rate from your own closing probability.
Download the evidence and checking tools
All four files are original CSV tools prepared for this article. They open in common spreadsheet programs. Source figures, our derived arithmetic and blank fields have different labels, so a worksheet does not become mistaken for observed household data.
- Eight-row source-linked evidence sheet (CSV)
- Three transparent calculations (CSV)
- Eight-question survey-reading guide (CSV)
- Blank personal readiness worksheet (CSV)
To reproduce the calculations, subtract 38 from 54, subtract 21 from 22, and subtract 10 from 100. Keep the units attached: years, percentage points and percent, respectively. None of these calculations estimates an individual approval probability.
Methodology and limits
We transcribed the selected values from the dated NAR release and retained a source snapshot. Our script checks the arithmetic and builds every chart from those same inputs. We did not buy or analyze respondent-level microdata, infer subgroup sample sizes or run a new household survey.
Survey nonresponse, weighting and rounding matter. NAR reports an overall margin of error, but that figure is not automatically a margin for a subgroup median or a two-year difference. We do not apply it to the sixteen-year age gap or claim a statistically significant one-point change. The study also does not follow the same households over time.
The first-time home buyer age 2026 figures offer a description of completed purchases. Use them to ask sharper questions about the market. For a personal housing decision, use your own needs, verified costs and financing terms rather than a national age benchmark.
Suggested citation: US Real Estate Insider, “First-Time Home Buyer Age 2026: Cash vs. Financed Purchasers,” November 7, 2026. Original analysis of NAR’s November 5 release, covering July 2025–June 2026 purchases. Source figures belong to their publisher; our charts and worksheets provide transparent transformations and interpretation.


