




The Virginia multifamily market Q3 2026 figures show net absorption ahead of new deliveries. The difference is 1,201 units, based on the publisher’s quarterly observations. That is useful demand-and-supply context, but it does not establish a shortage or an achievable rent for a particular apartment.
Checked October 25, 2026. Our analysis separates quarterly flows, the construction pipeline and local rent changes. Five charts include a transparent concession example. Readers can download the calculations and a blank property worksheet rather than relying on a statewide assumption for a local rental decision.
Virginia multifamily market Q3 2026: define the coverage
The Virginia REALTORS® report series covers nine markets and focuses on properties with at least 50 units. These findings do not describe every rental house, small apartment building or part of the United States. Match that scope to the property you are evaluating before using the figures.
A regional research series can reveal patterns while leaving important property-level questions open. Unit size, building age, location and available amenities may differ from your comparison set. Keep those differences visible. A market average is a starting point for investigation, rather than a rent quote for one unit.
Quarterly net absorption exceeded new deliveries
The October 22 Q3 summary reports 2,485 units of net absorption and 1,284 units delivered. Net absorption measures leased units minus vacated units. Our subtraction gives 2,485 − 1,284 = 1,201. Dividing gives approximately 1.94 units of net absorption per newly delivered unit.
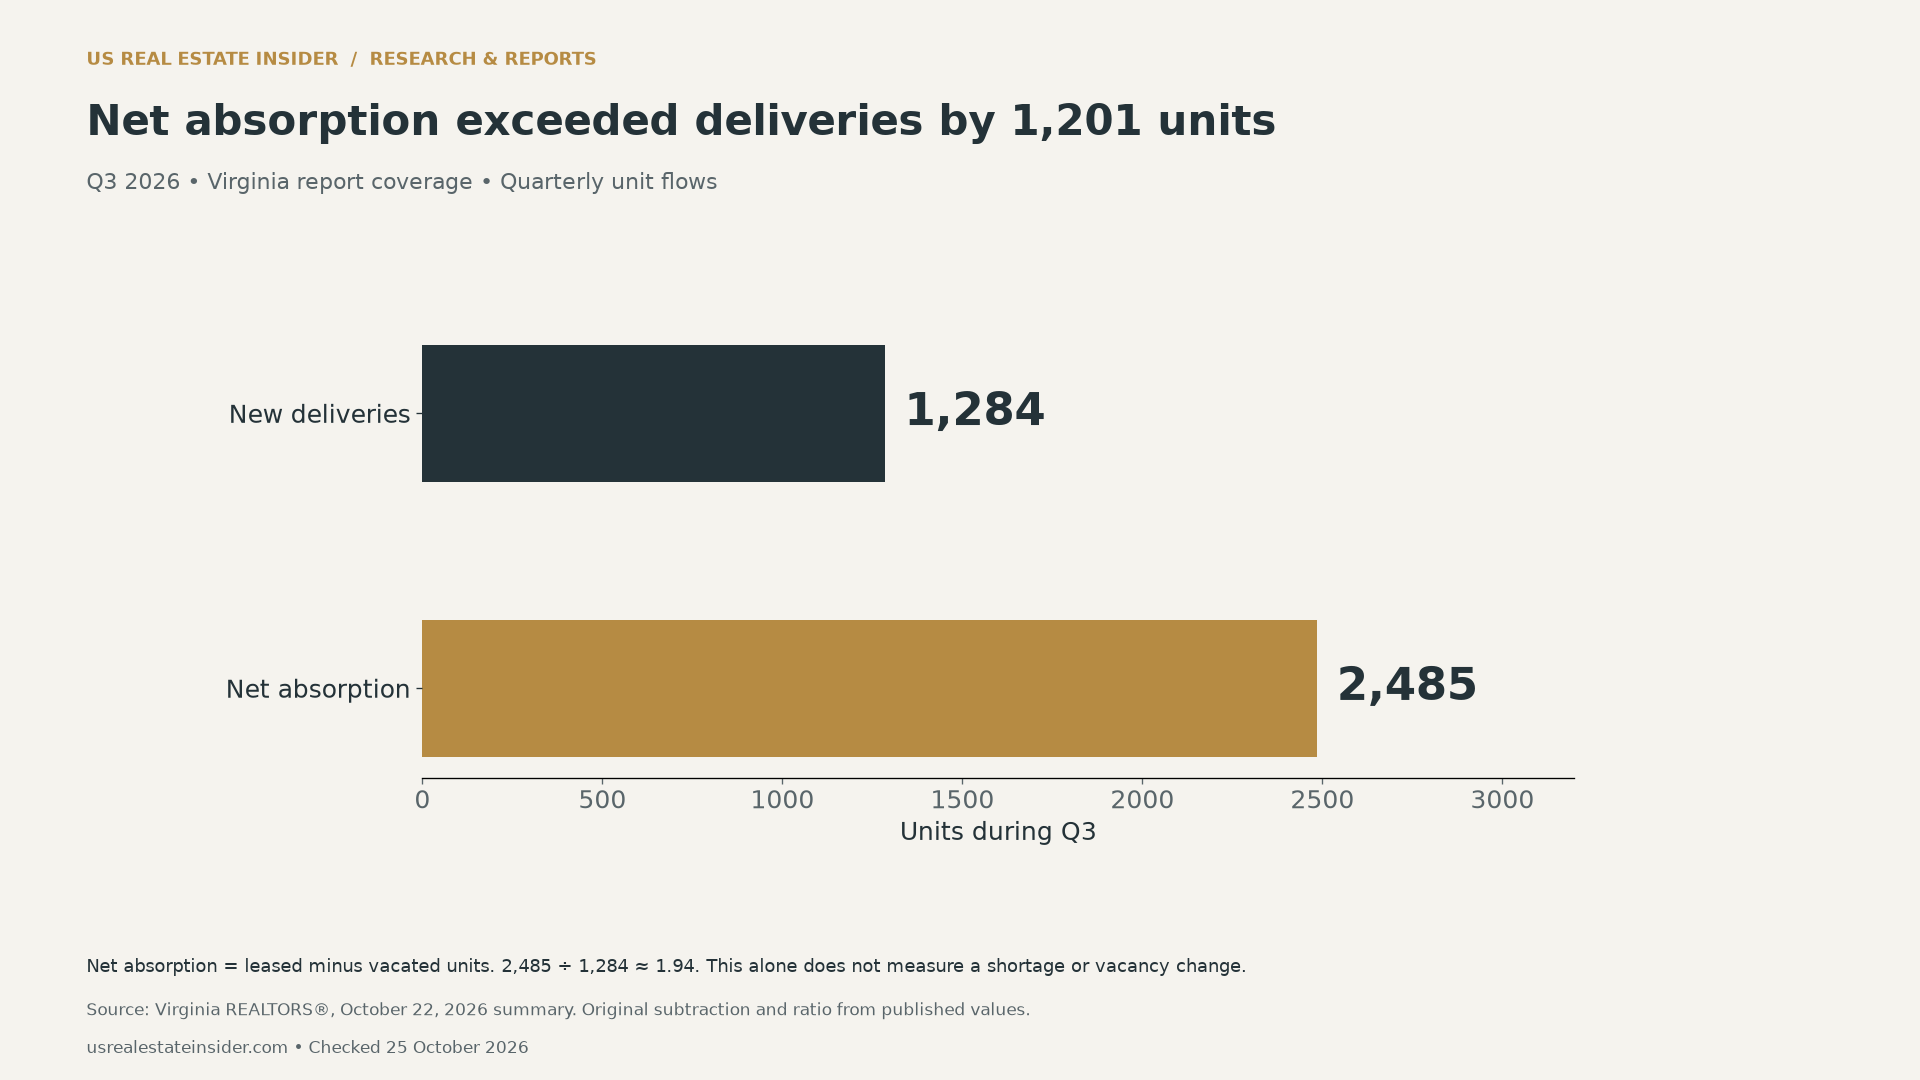
The ratio describes the two reported flows within the same quarter. It is not a forecast of leasing speed for a new building. It also does not show how many households could not find suitable housing. Those questions require additional evidence about available stock, household needs, prices and the local search area.
For a property manager, the next question is where leasing activity is occurring. A completed development in another submarket may have limited relevance to a specific building. Compare properties that offer a realistic alternative to the same renters, with similar unit types and timing.
Virginia multifamily market Q3 2026 supply has two timelines
The summary reports deliveries down 64% annually, while units under construction rose 22% to 28,711. These measures concern different stages. Deliveries are new supply completed during a quarter. Under construction is a pipeline of unfinished units, with completion dates that can extend beyond that quarter.
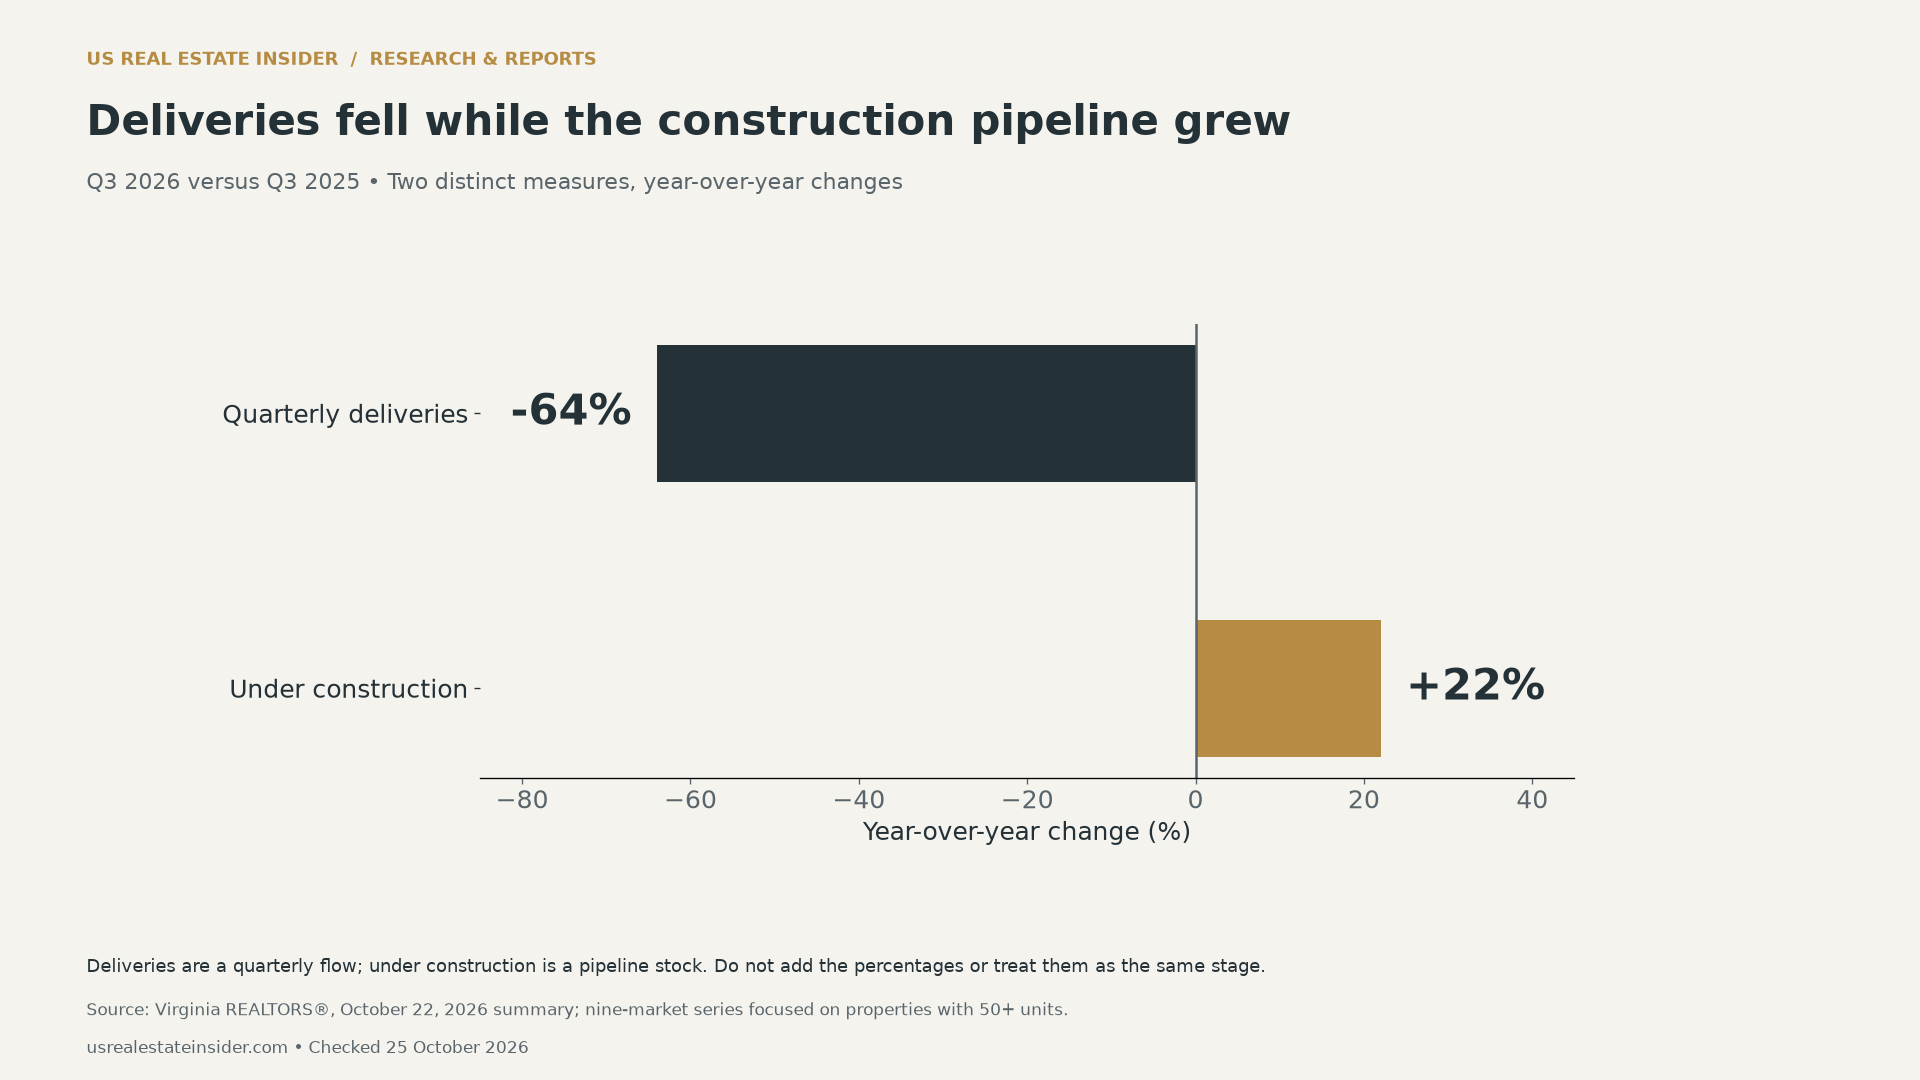
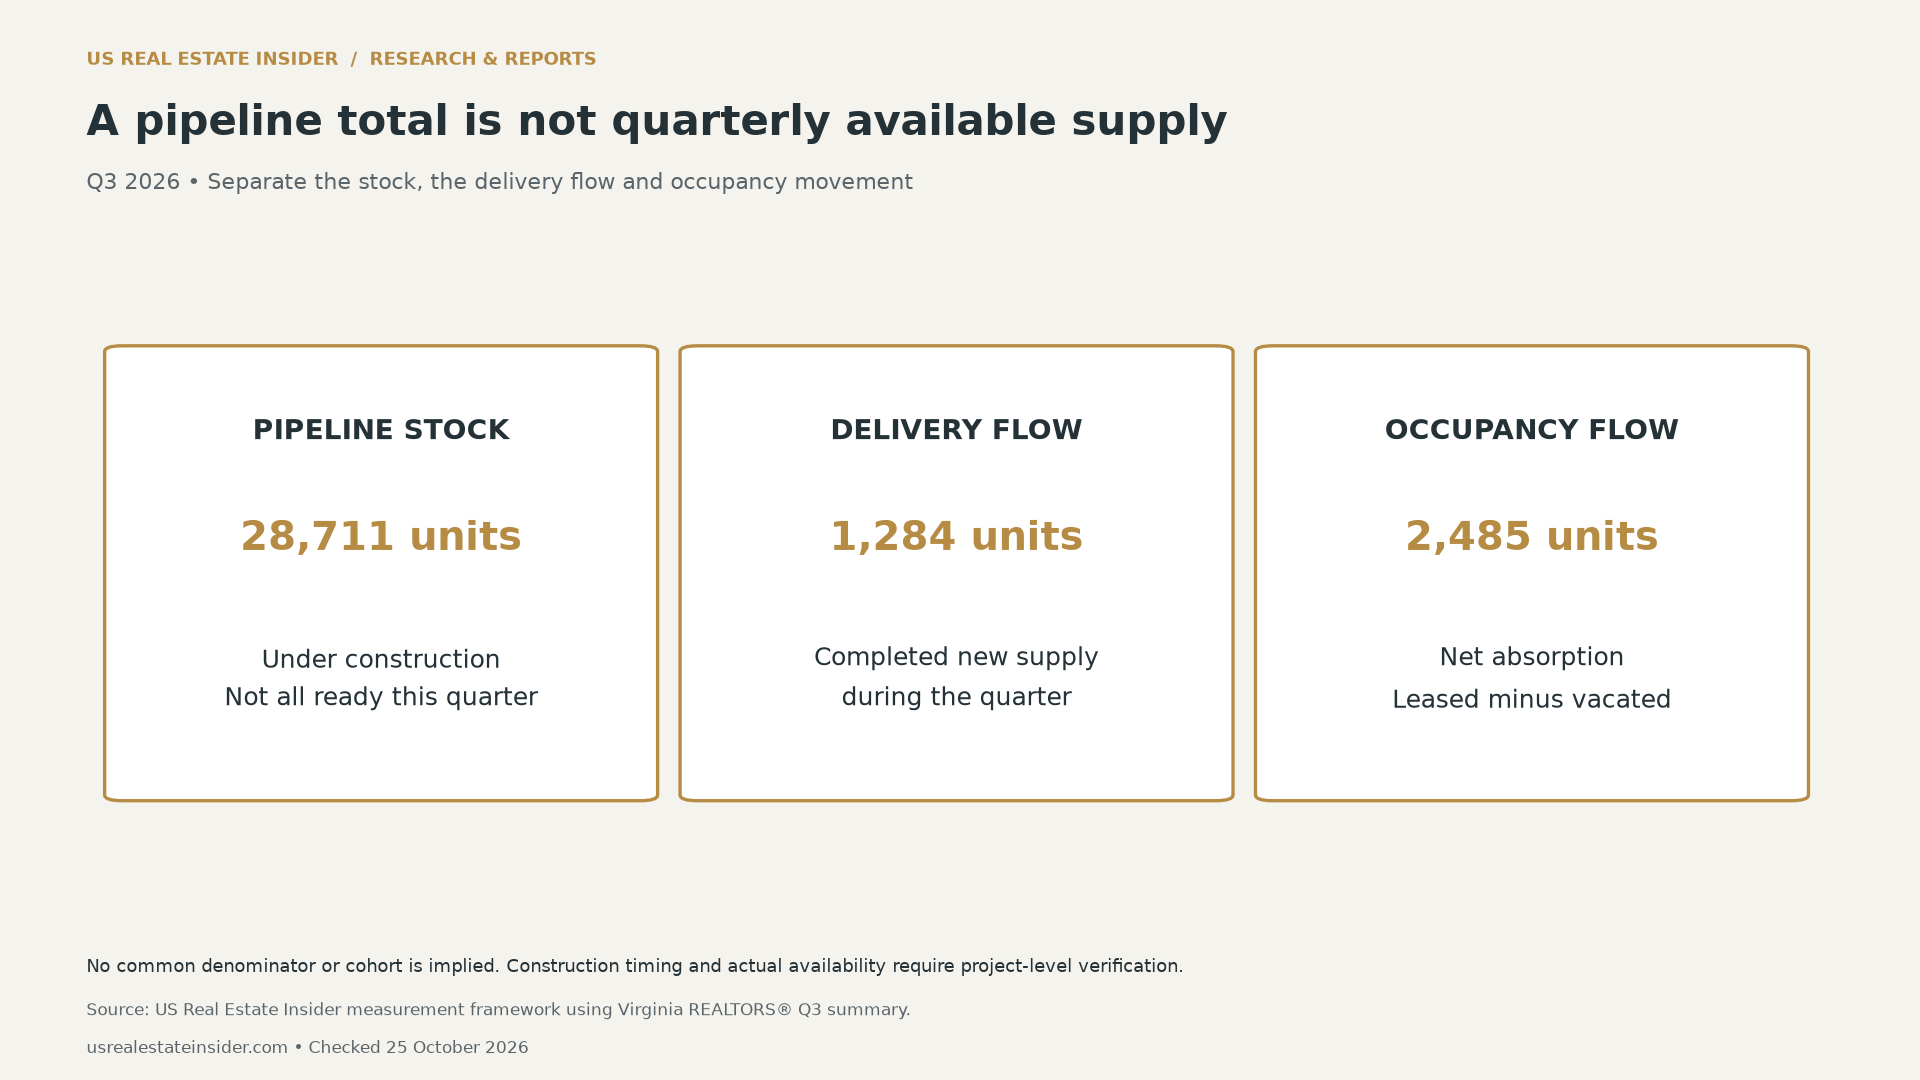
Avoid adding the pipeline to completed deliveries as though all units entered the rental market together. Doing so would pull future possible supply into the current quarter. Instead, document project completion estimates and actual availability. Mark uncertain dates and recheck them when the decision depends on timing.
Our national construction-stage analysis explains a similar measurement problem with permits, starts and completions. Its national annualized rates should not be merged with this regional quarterly unit count. The concepts can help interpret each report while their observations remain separate.
Vacancy has its own published measure
The official Q3 snapshot PDF separately reports vacancy at 6.2%, down 0.2 percentage points year over year. It also displays average effective rent of $1,799 per unit. These are published observations, not values inferred from our two-flow subtraction.
A vacancy percentage needs its inventory base and observation period. The number of empty units and the percentage of stock that is empty can move differently as the inventory changes. Keep that distinction in your operating notes. Do not reverse-engineer a precise vacancy series from one quarter’s absorption and deliveries alone.
Local rent divergence is large enough to matter
The dated summary reports annual effective-rent growth of 1.1% overall. Its two highlighted local comparisons are +5.7% in Hampton Roads and −3.7% in Charlottesville. The difference is 9.4 percentage points: 5.7 − (−3.7). These selected examples are not a complete nine-market ranking.
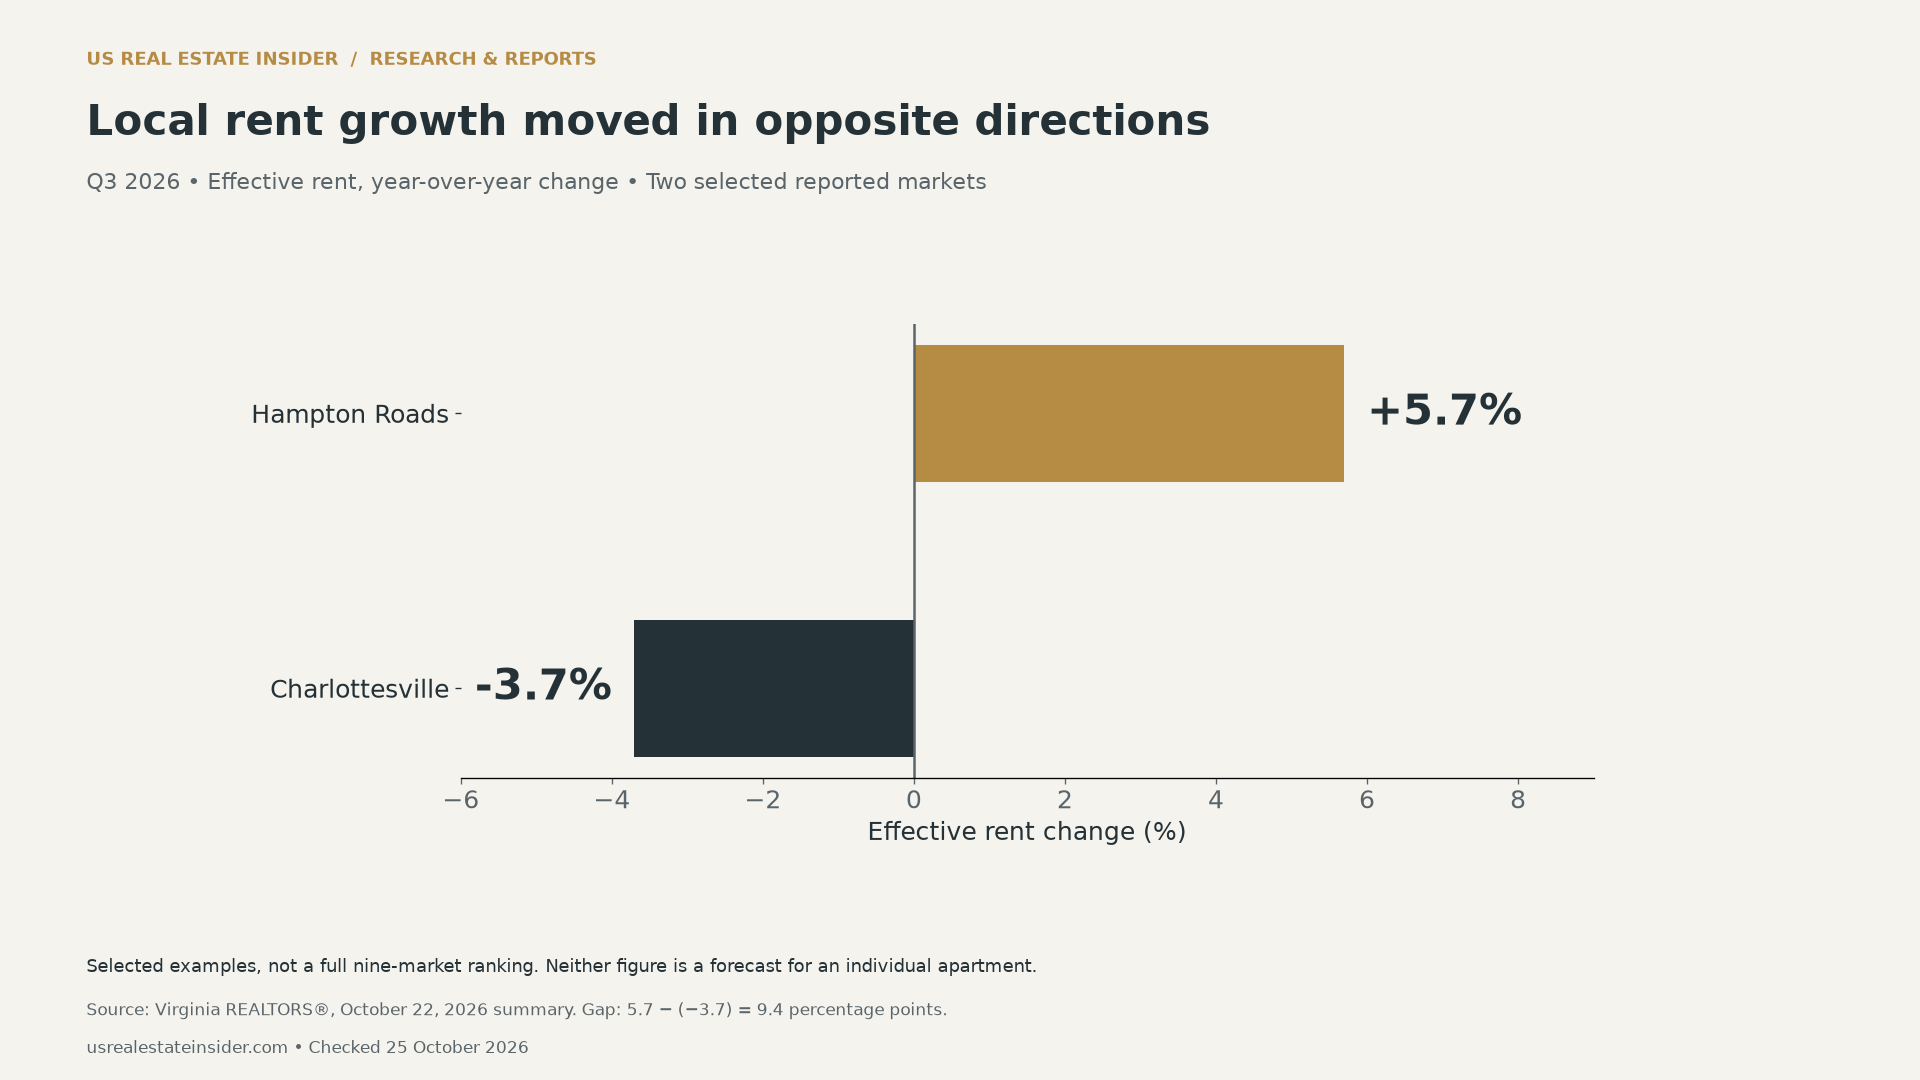
For budgeting, replace a broad growth assumption with documented local comparables. Check whether a quoted figure concerns asking rent, effective rent, signed leases or renewals. Then compare the unit type and lease period. A difference in those definitions can look like a pricing opportunity when it is actually a measurement mismatch.
A manager should also record what the comparison excludes. Parking, mandatory fees and utilities can change the tenant’s total cost without appearing in the headline rent. Deposits are a separate cash requirement. Keep a consistent basis when comparing offers so a lower advertised rent does not hide a higher total cost.
Asking versus effective rent: a labeled illustration

Consider an invented 12-month lease with an asking rent of $1,800 a month. With one rent-free month, the tenant pays 11 × $1,800 = $19,800 in rent across the term. Spread over 12 months, that equals $1,650 per month. With two rent-free months, the corresponding figure is $1,500.
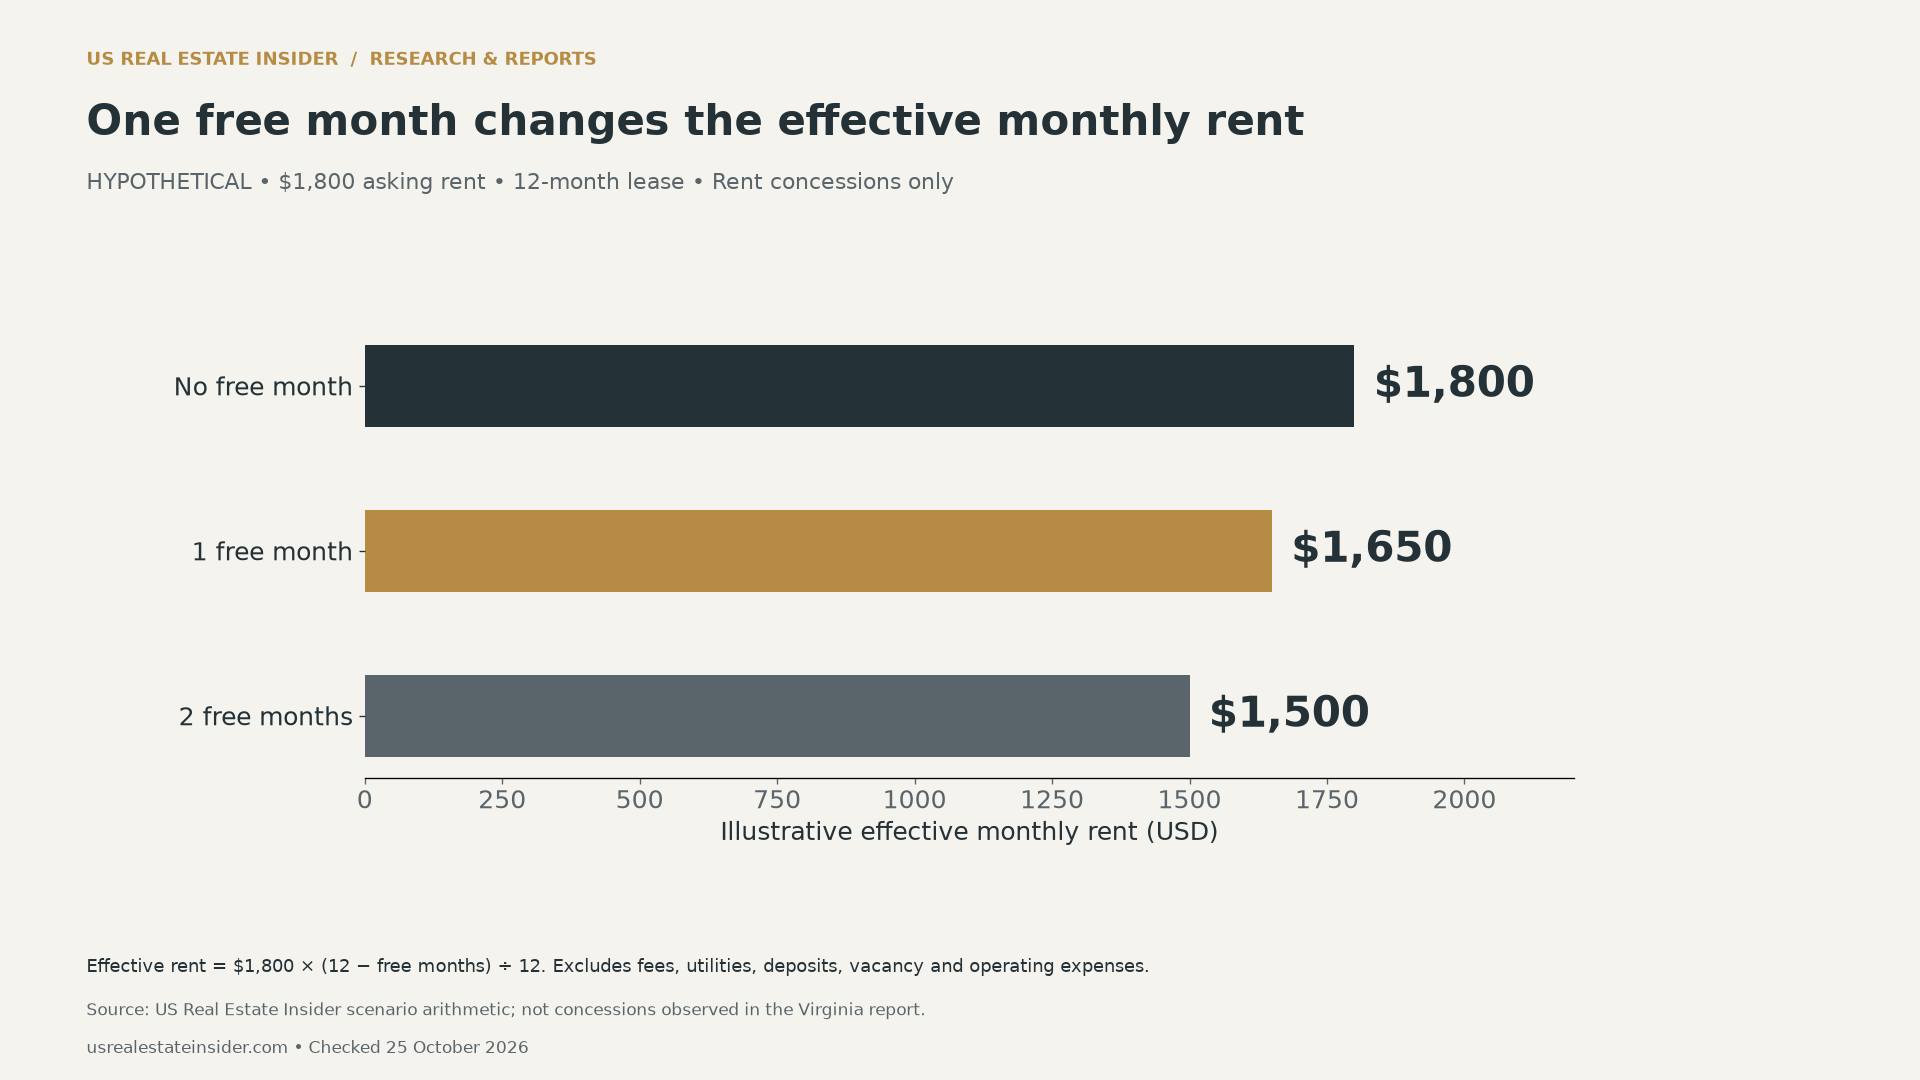
The formula is asking monthly rent × (lease months − free months) ÷ lease months. It covers rent concessions only. It excludes mandatory fees, utilities, deposits, vacancy and operating costs. A credit delivered in another form or conditional on different terms requires a separate calculation using the actual lease.
For the property manager, effective rent is also different from net operating income. Insurance, maintenance and other operating expenses still need a documented budget. For the renter, the monthly payment schedule may differ from the average effective amount. Read the actual terms rather than assuming the average is what is due each month.
Build a property-specific operating check
First, document nearby projects and their expected openings. Then collect comparable offers with the same unit size, lease term and fee basis. Record source dates so stale concessions do not become current assumptions. Keep asking prices separate from terms that were actually accepted.
Next, track renewal acceptance, vacancy and leasing activity using clear denominators and matching periods. Distinguish signed leases from inquiries. A busy inquiry pipeline does not establish occupied units or collected rent. Mark missing observations instead of filling gaps with the statewide growth rate.
Finally, test the budget with the property’s real costs and cash needs. Our investor measurement guide explains why market participation alone cannot establish profitability. Likewise, positive regional absorption does not settle a specific acquisition or operating decision.
Downloads, methodology and limitations
Download the Virginia research calculations (CSV) for the flow comparison, rent-growth gap and labeled concession examples. The blank rental property evidence worksheet (CSV) helps readers gather their own observations. It contains no surveyed properties or measured operating results.
We checked the dated summary, report-series scope and official Q3 snapshot. The archive still listed Q2 as its latest full downloadable report when checked, so this article does not claim to reproduce a complete Q3 metro table or historical vacancy series. The separately accessible snapshot supports the vacancy observation stated above.
Calculations use published rounded values and ordinary subtraction, division and lease arithmetic. No causal model, rent forecast or estimate of unmet housing need was produced. Suggested citation: US Real Estate Insider, “Virginia Multifamily Market Q3 2026: Demand Outpaces Deliveries”, checked October 25, 2026. Credit Virginia REALTORS® for observations and this report for the original comparisons and hypothetical examples.


