




Home investors in 2026 are not one uniform group. Realtor.com’s October 21 research describes a first-half market in which small corporate buyers made most identified investor purchases. Our original calculation puts their share in context: approximately 7.1 purchases per 100 covered transactions, rather than two-thirds of all homes.
Checked October 25, 2026. This report explains the denominator, the difference between purchases and ownership, and the local evidence a buyer needs. The publication is new, but the transactions run through June. It does not describe investor purchases occurring this week.
Home investors in 2026: who enters the dataset?
The Realtor.com original research and methodology uses deed records to identify qualifying corporate investors. Personal-name investors fall outside this definition. Its small category means 1–10 cumulative purchases in the full dataset, not 1–10 current holdings. We follow the formal methodology where the narrative uses less precise wording.
That distinction changes how readers should interpret the word “small.” Imagine a hypothetical entity that purchased several properties over time and later sold some. Its cumulative purchase history and its current holdings would differ. A purchase-history classification cannot reveal the number of homes that entity owns today.
The same caution applies to the word “institutional.” This report uses the publisher’s stated groups when discussing the data. The remaining identified investors include more than just the largest institutions. Do not rename that entire remainder “mega-investors,” or assume every excluded buyer is a household buying a primary residence.
The 100-purchase breakdown for home investors in 2026
The national investor share was 10.7%. Small entities accounted for 66.2% of that investor group. Multiply the two shares: 0.107 × 0.662 = 0.070834. Expressed as a percentage of covered purchases, that is 7.0834%, or about 7.1%. This is a calculation from rounded inputs, not a new property census.
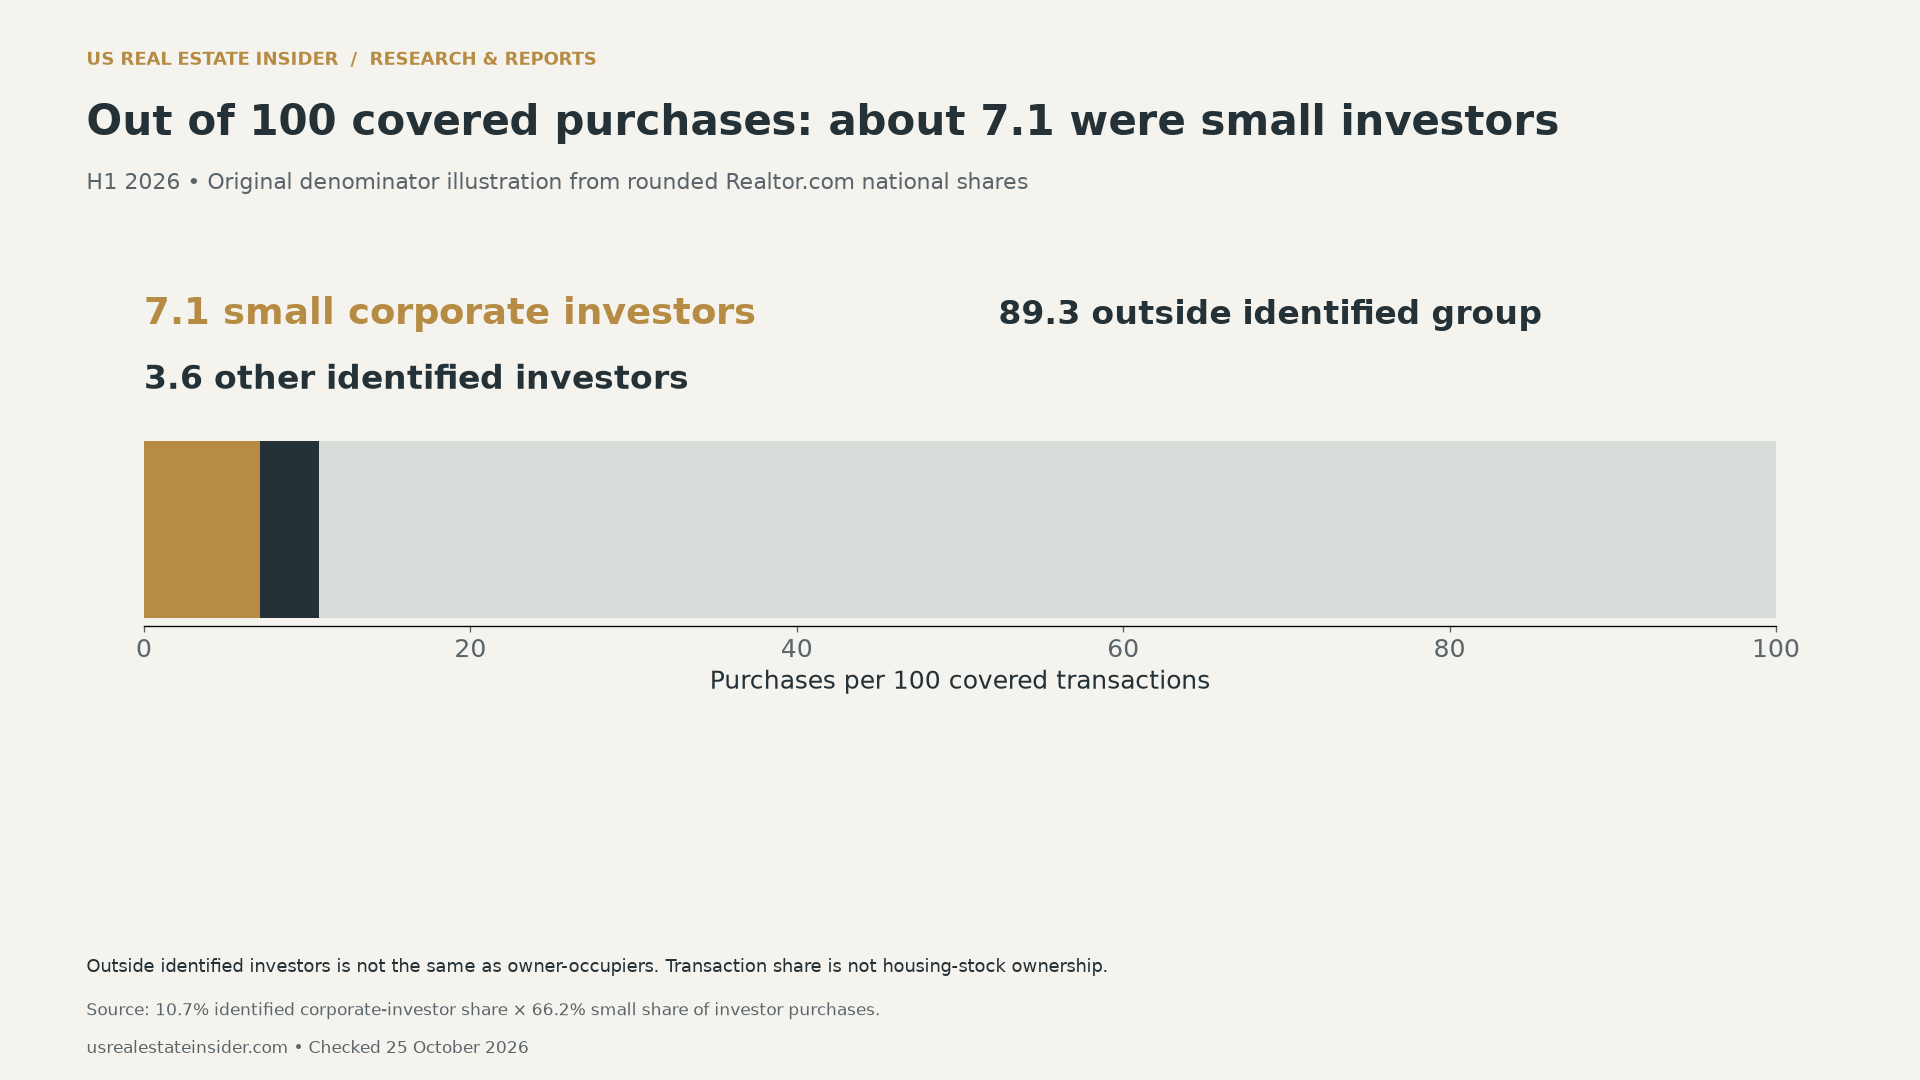
| Group | Approximate purchases per 100 covered | Calculation |
|---|---|---|
| Small corporate investors | 7.1 | 10.7 × 0.662 |
| Other identified investors | 3.6 | 10.7 × 0.338 |
| Outside identified investor group | 89.3 | 100 − 10.7 |
The three groups exhaust the illustration, but they do not establish who occupies every home. A purchase outside the identified group can still involve an investor missed by the corporate definition. “Outside identified investors” is the accurate label. “Owner-occupied” would add information that the calculation does not contain.
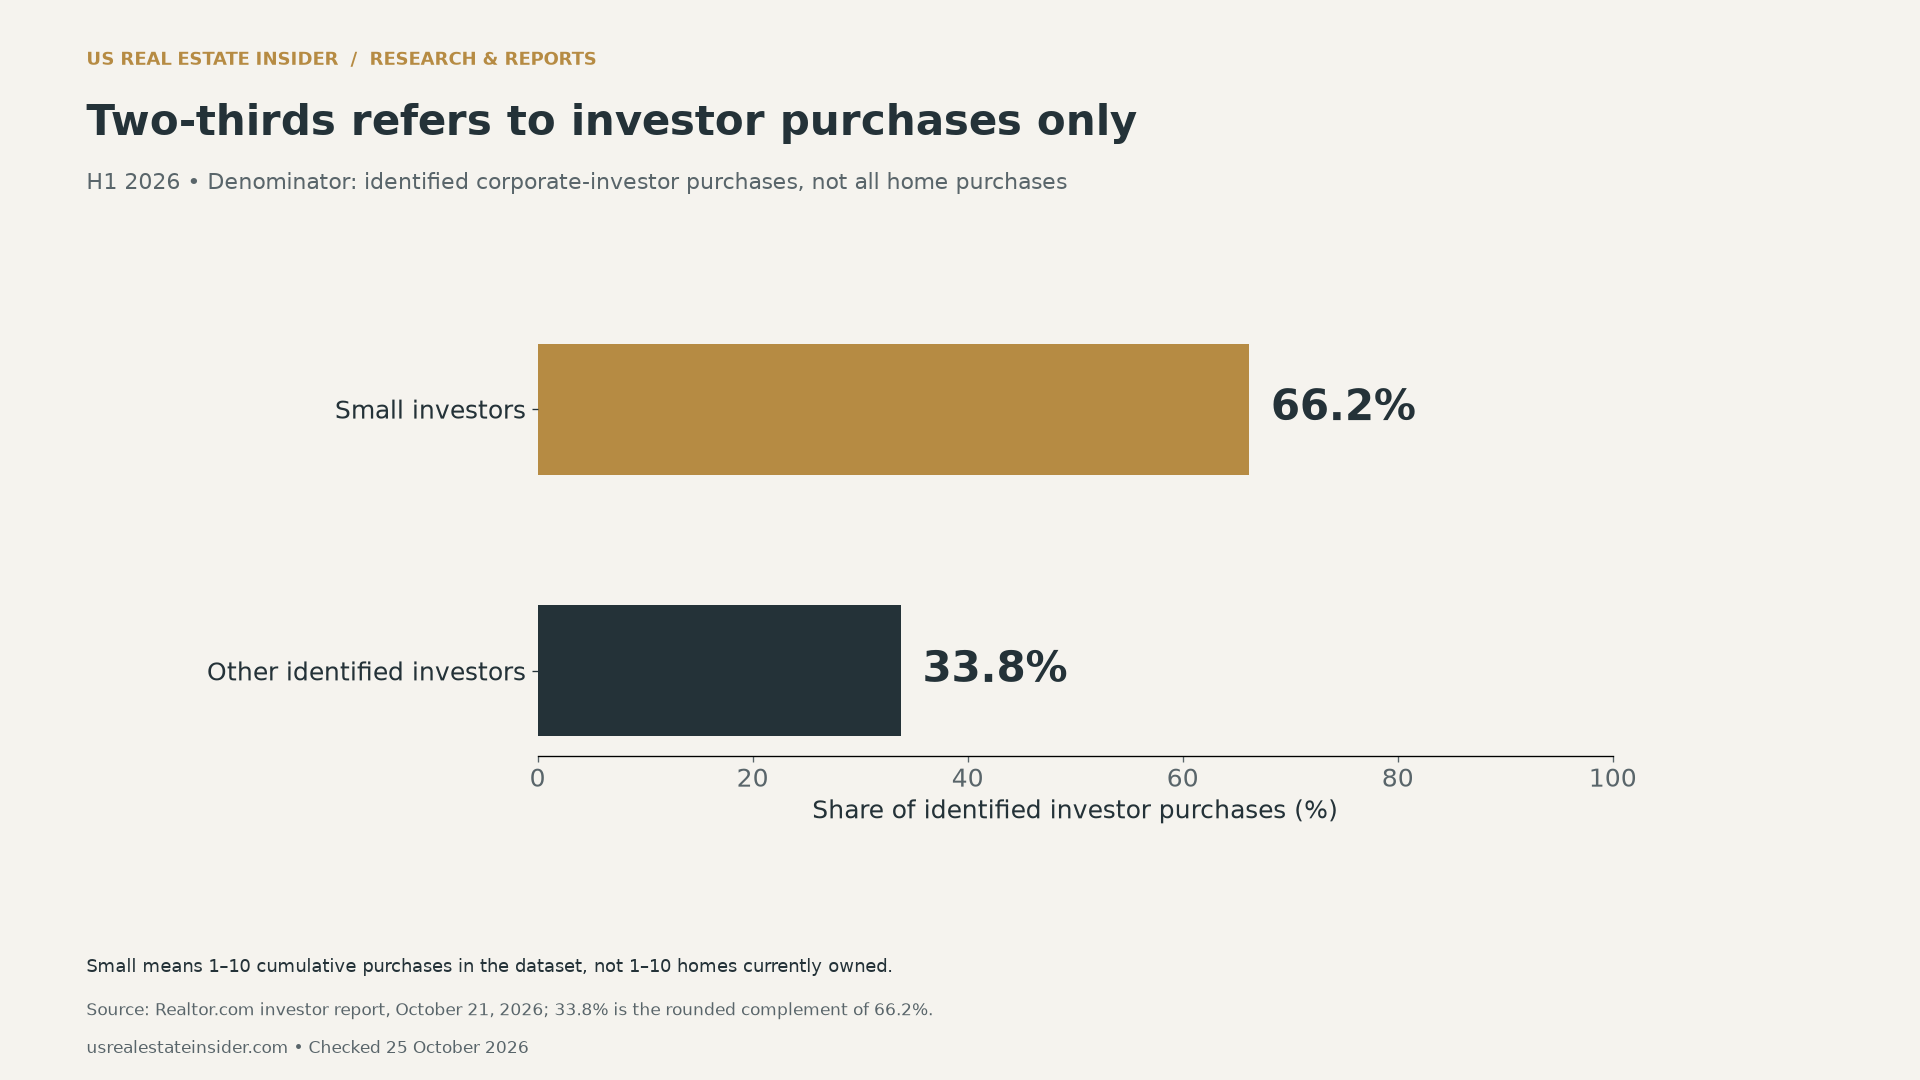
These two charts answer different questions. One asks how the identified investor market divides. The other asks how much of the covered transaction market each group represents. A share can be large within a subset while remaining much smaller within the broader market. Keep the denominator in the caption when reusing either image.
Market share and purchase volume can move differently
The report counts about 224,000 identified investor purchases, down 7% annually. Their purchase share moved from 11.0% to 10.7%. Large and mega groups were net sellers. A net-seller label compares purchases with sales during the period; it does not mean a group sold all its properties.
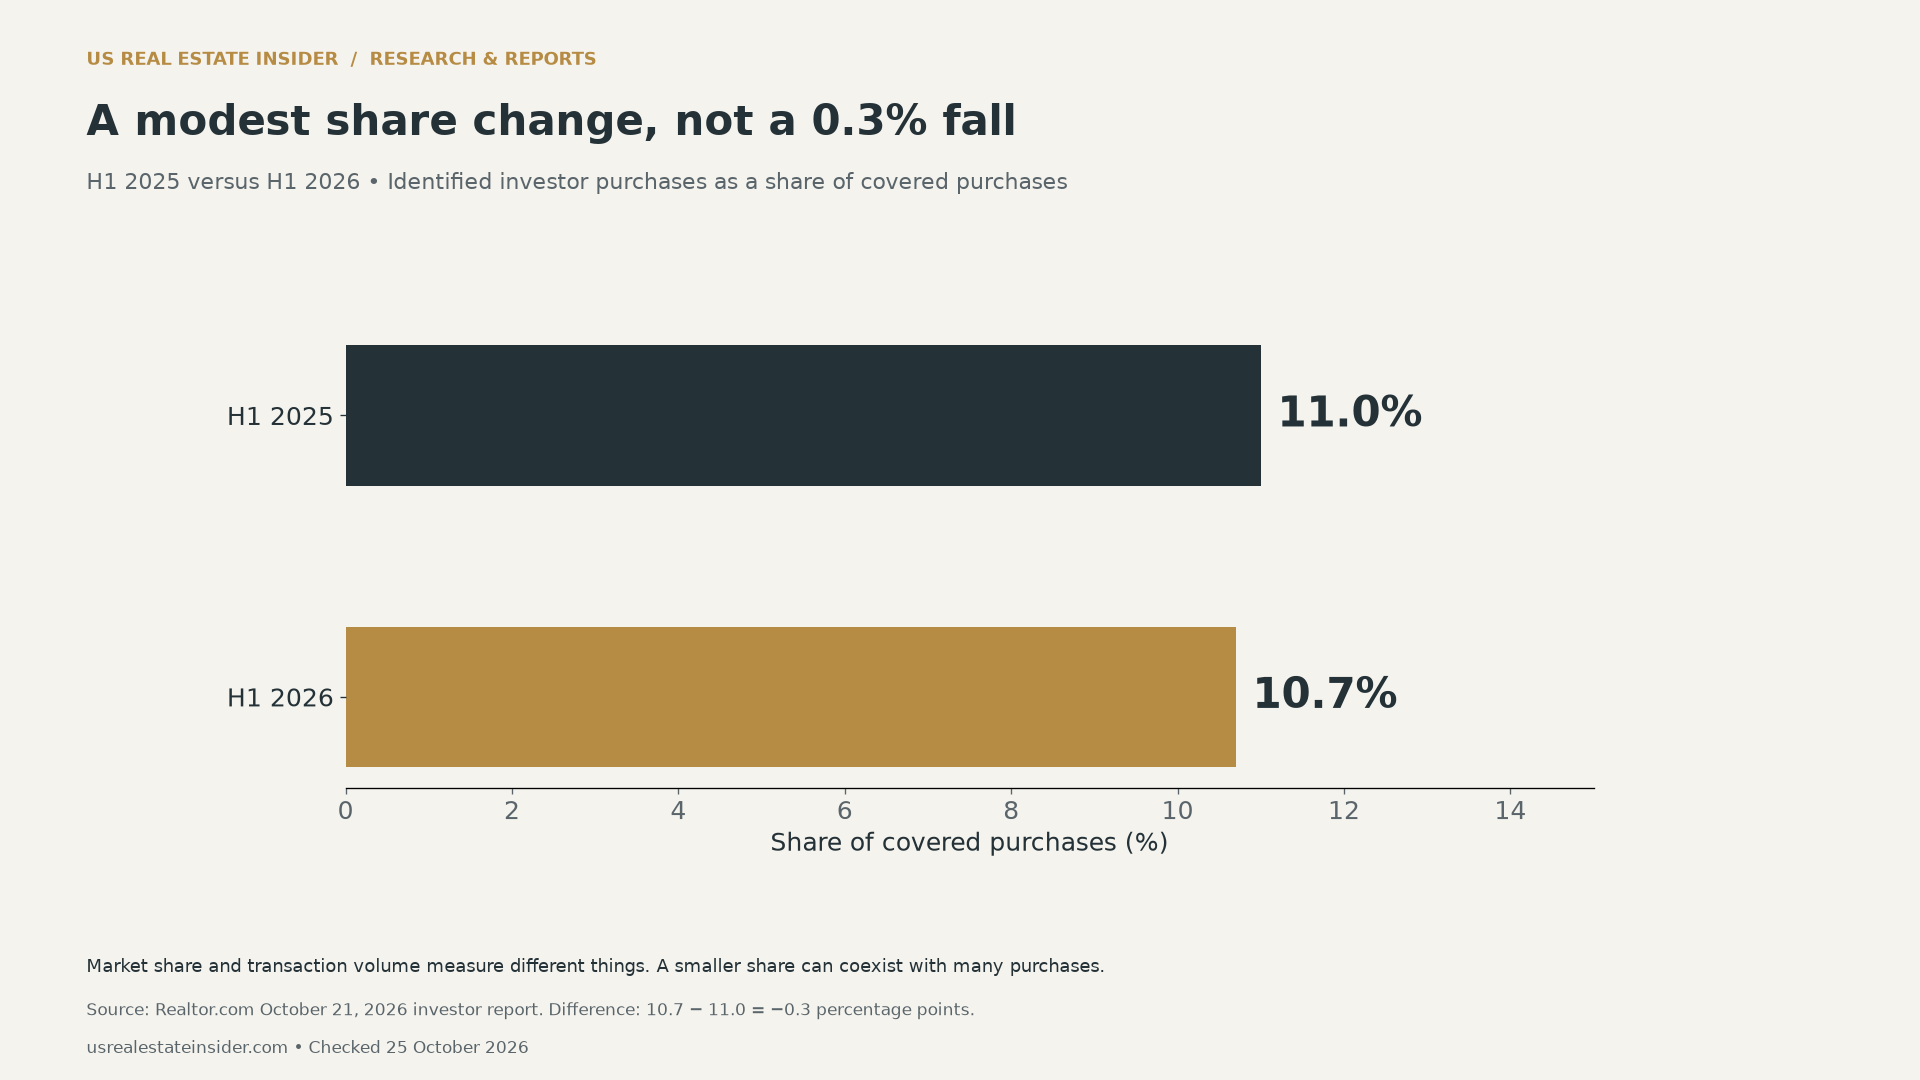
Consider a separate invented example. If investors buy 10 homes out of 100 transactions, their share is 10%. If they later buy eight out of 50, their share becomes 16%. Purchases fell while share rose. The example illustrates arithmetic only; these are not observations from the housing report.
The reverse can happen too. A group can make more purchases but lose share if the rest of the market grows faster. For that reason, compare counts and shares over matching periods. Avoid attaching a market-share percentage to a purchase-volume headline without explaining the difference.
Cash shares: compare overlapping groups carefully
The publisher’s accompanying announcement reports all-cash shares of 55.5% among investors and 30.0% marketwide. Their difference is 25.5 percentage points. Investors are included in the marketwide group, so this is not an investor-versus-non-investor comparison.
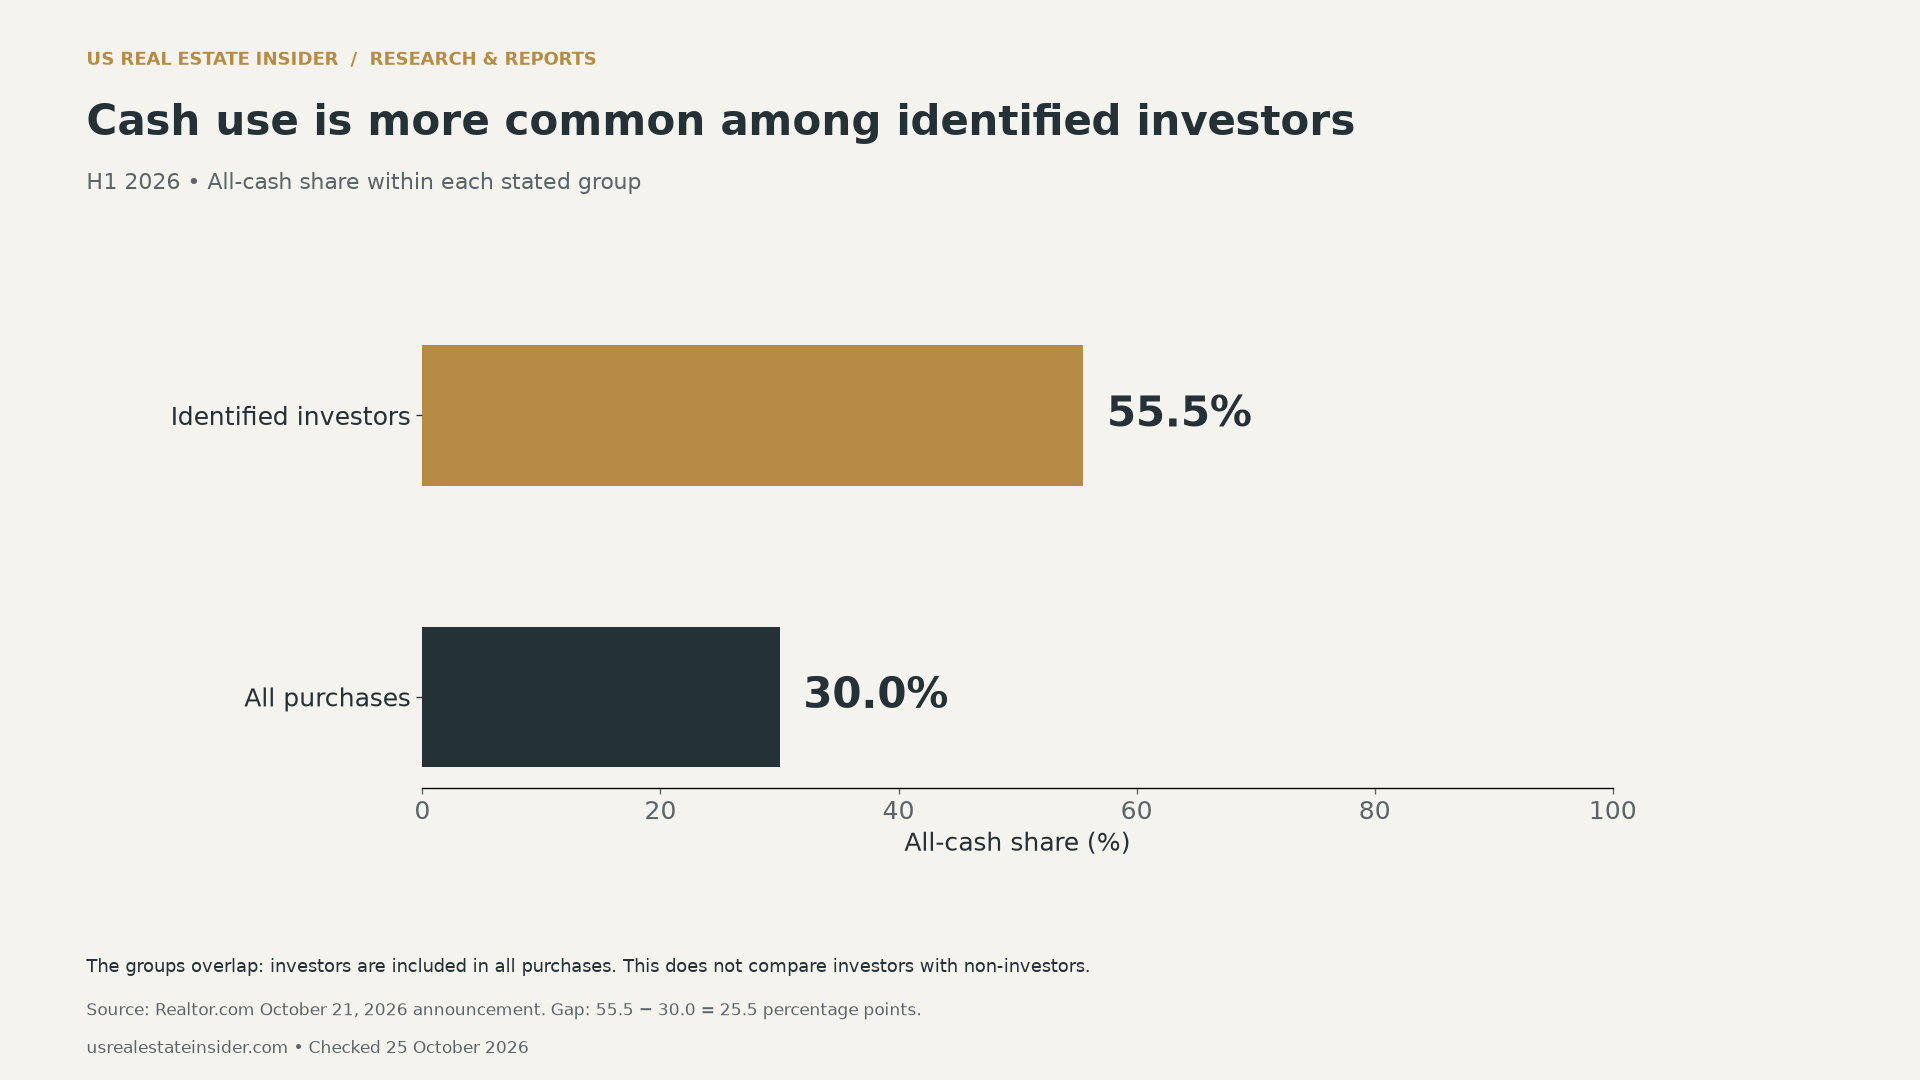
For a household buyer, the practical response is to assess the actual offer requirements and financing position. The national cash share does not identify the other bidders on a home. Nor does paying cash remove inspection, condition or transaction risks. A stronger offer still needs a budget that works for the buyer.
Our mortgage payment comparison helps separate a loan payment from other housing costs. The buyer leverage report explains how completed comparables and property condition inform an offer. Use those property-level checks alongside the investor context.
Purchase history is not today’s ownership
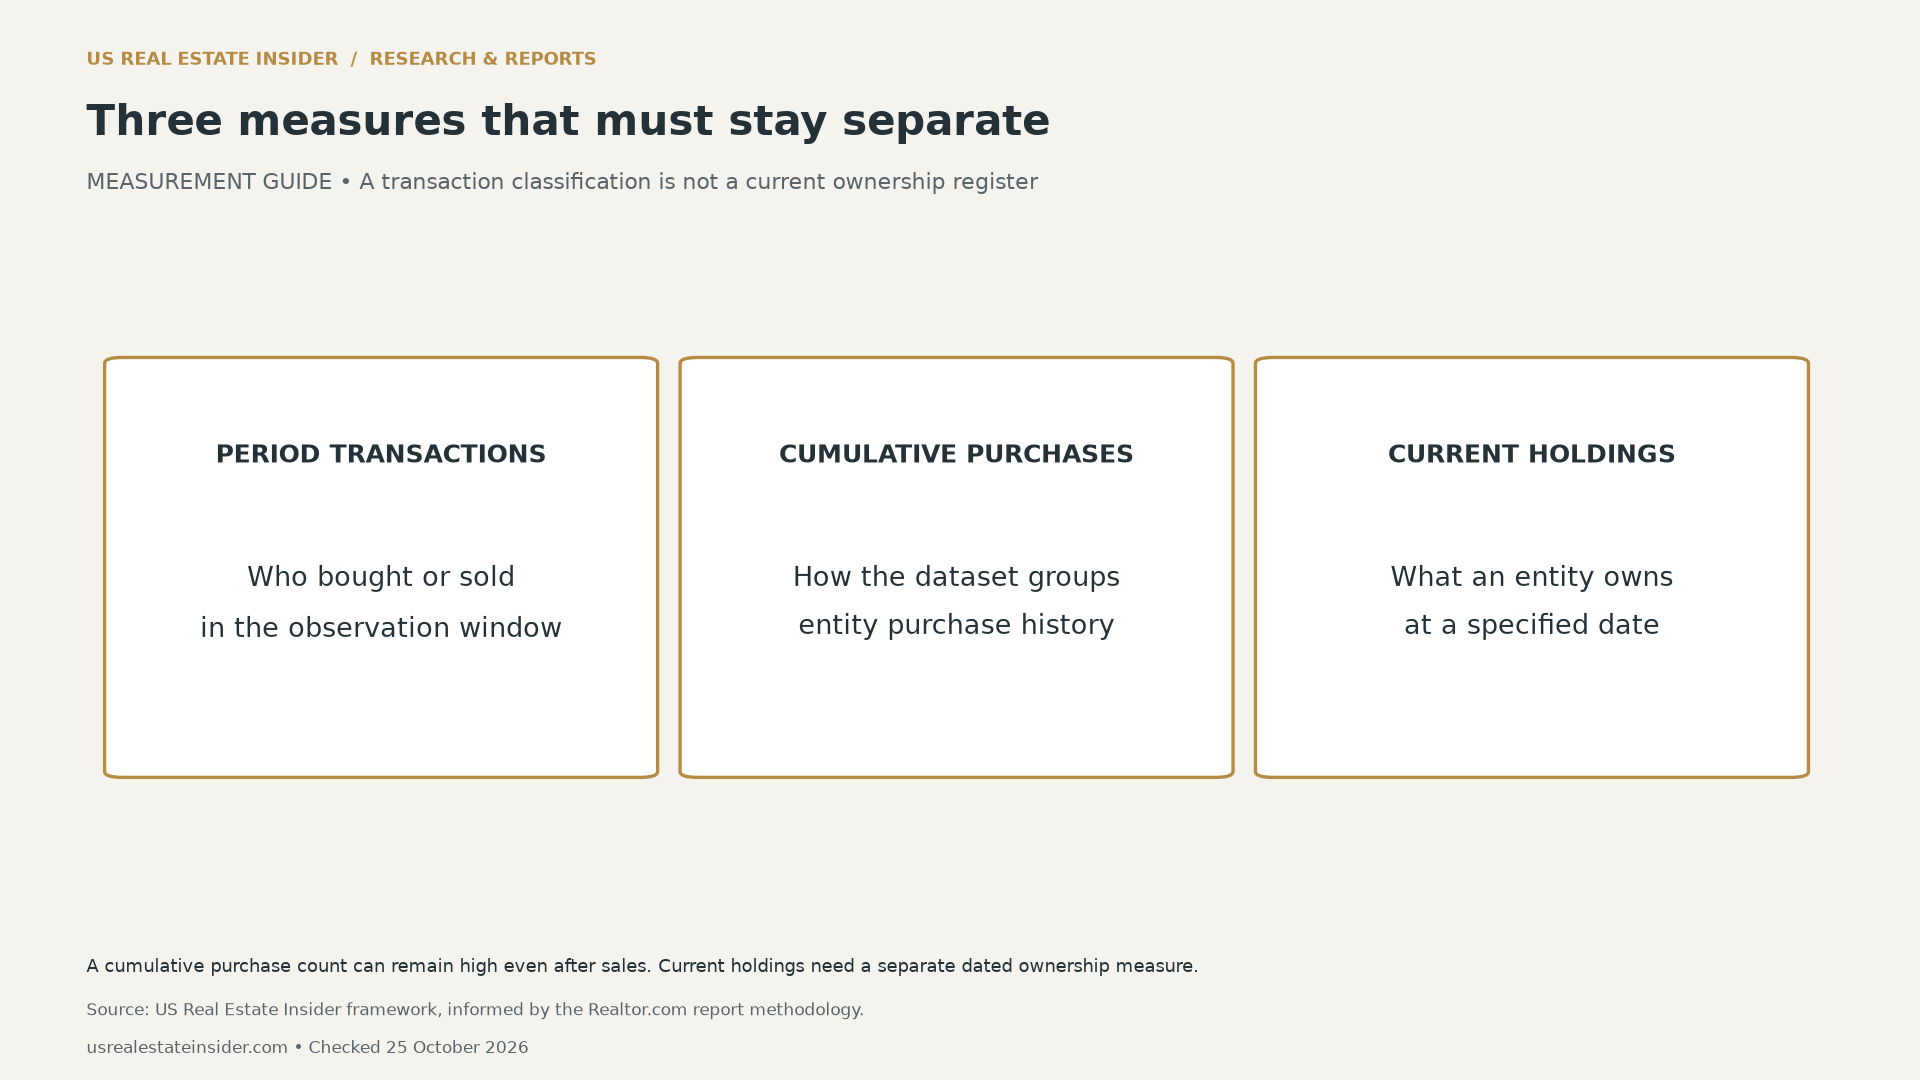
To answer an ownership question, first choose a date and define the property stock. Then identify which properties remain held by the relevant owners at that date. A transaction share covers activity during a window. It cannot supply that ownership inventory merely by changing the label on a chart.
Similarly, a cumulative category does not tell you whether an investor is active in your neighborhood now. An entity’s older transactions may lie elsewhere or involve a different property type. Local competition needs a matching geography, segment and period. A national share is useful context, not a list of current rival bidders.
A practical local evidence checklist

Start with the property segment you are considering. Record a precise geography, home type, price band and observation period. When a source reports investor activity, copy its definition and exclusions into your notes. Check whether it measures transactions, unique buyers or homes currently held. Those denominators answer different questions.
Next, look for completed comparable sales and current competing listings. Distinguish verified transaction information from assumptions about a buyer’s intentions. A corporate-looking name does not, by itself, establish strategy, resources or occupancy. Record unknowns rather than assigning a confident label without supporting evidence.
For a rental purchase, build a separate property budget using documented achievable rent, operating costs, repairs, financing and reserves. The presence of investors does not prove an investment is profitable. Nor does their retreat establish that a neighborhood is unsuitable. The transaction report does not replace those property-specific calculations.
Download the calculations and research worksheet
The investor denominator calculations (CSV) retain the unrounded arithmetic from the published rounded shares. The blank local investor evidence worksheet (CSV) helps document scope, definitions and unanswered questions. It contains no measured local investor records.
We did not merge private ownership data, estimate an investor effect on prices or produce a metro ranking. The source’s methodology and announcement describe their metro universe differently, so selected city figures are not used here to imply a comprehensive national league table. Our contribution is a transparent denominator explanation and a reusable research process.
Suggested citation: US Real Estate Insider, “Small vs. Institutional Home Investors: What Changed in 2026?”, checked October 25, 2026. Credit Realtor.com for the underlying H1 observations and definitions. Credit this report for the scaled-purchase illustration, arithmetic and worksheet, retaining their stated limitations.


