






The October 2026 CMBS delinquency rates tell two different stories. Trepp’s overall rate fell to 7.87%, from 8.02% in September. However, retail, office and multifamily rates all increased. A lower headline therefore did not signal improvement across every major property sector. The key is balance weighting: the amount owed by loans in each status matters, rather than a simple vote among sectors or a count of troubled loans.
Research date: November 7, 2026. Reference month: October 2026. Primary announcement: Trepp, November 2. Our contribution includes a reproducible basis-point bridge, a separately labeled fictional loan pool, three original charts, a classification infographic and four CSV tools.
October 2026 CMBS delinquency rates by sector
The Trepp October announcement reports a 15-basis-point overall decline. It attributes much of that improvement to a $975 million showroom-property loan returning to current status. At the same time, three of five major sectors worsened. The public announcement provides the following sector rates and monthly changes.
| Property type | September* | October | Monthly change |
|---|---|---|---|
| Retail | 6.58% | 7.21% | +63 bp |
| Office | 12.16% | 12.33% | +17 bp |
| Multifamily | 8.04% | 8.09% | +5 bp |
| Lodging | 6.18% | 5.94% | −24 bp |
| Industrial | 1.14% | 1.10% | −4 bp |
| Overall covered universe | 8.02% | 7.87% | −15 bp |
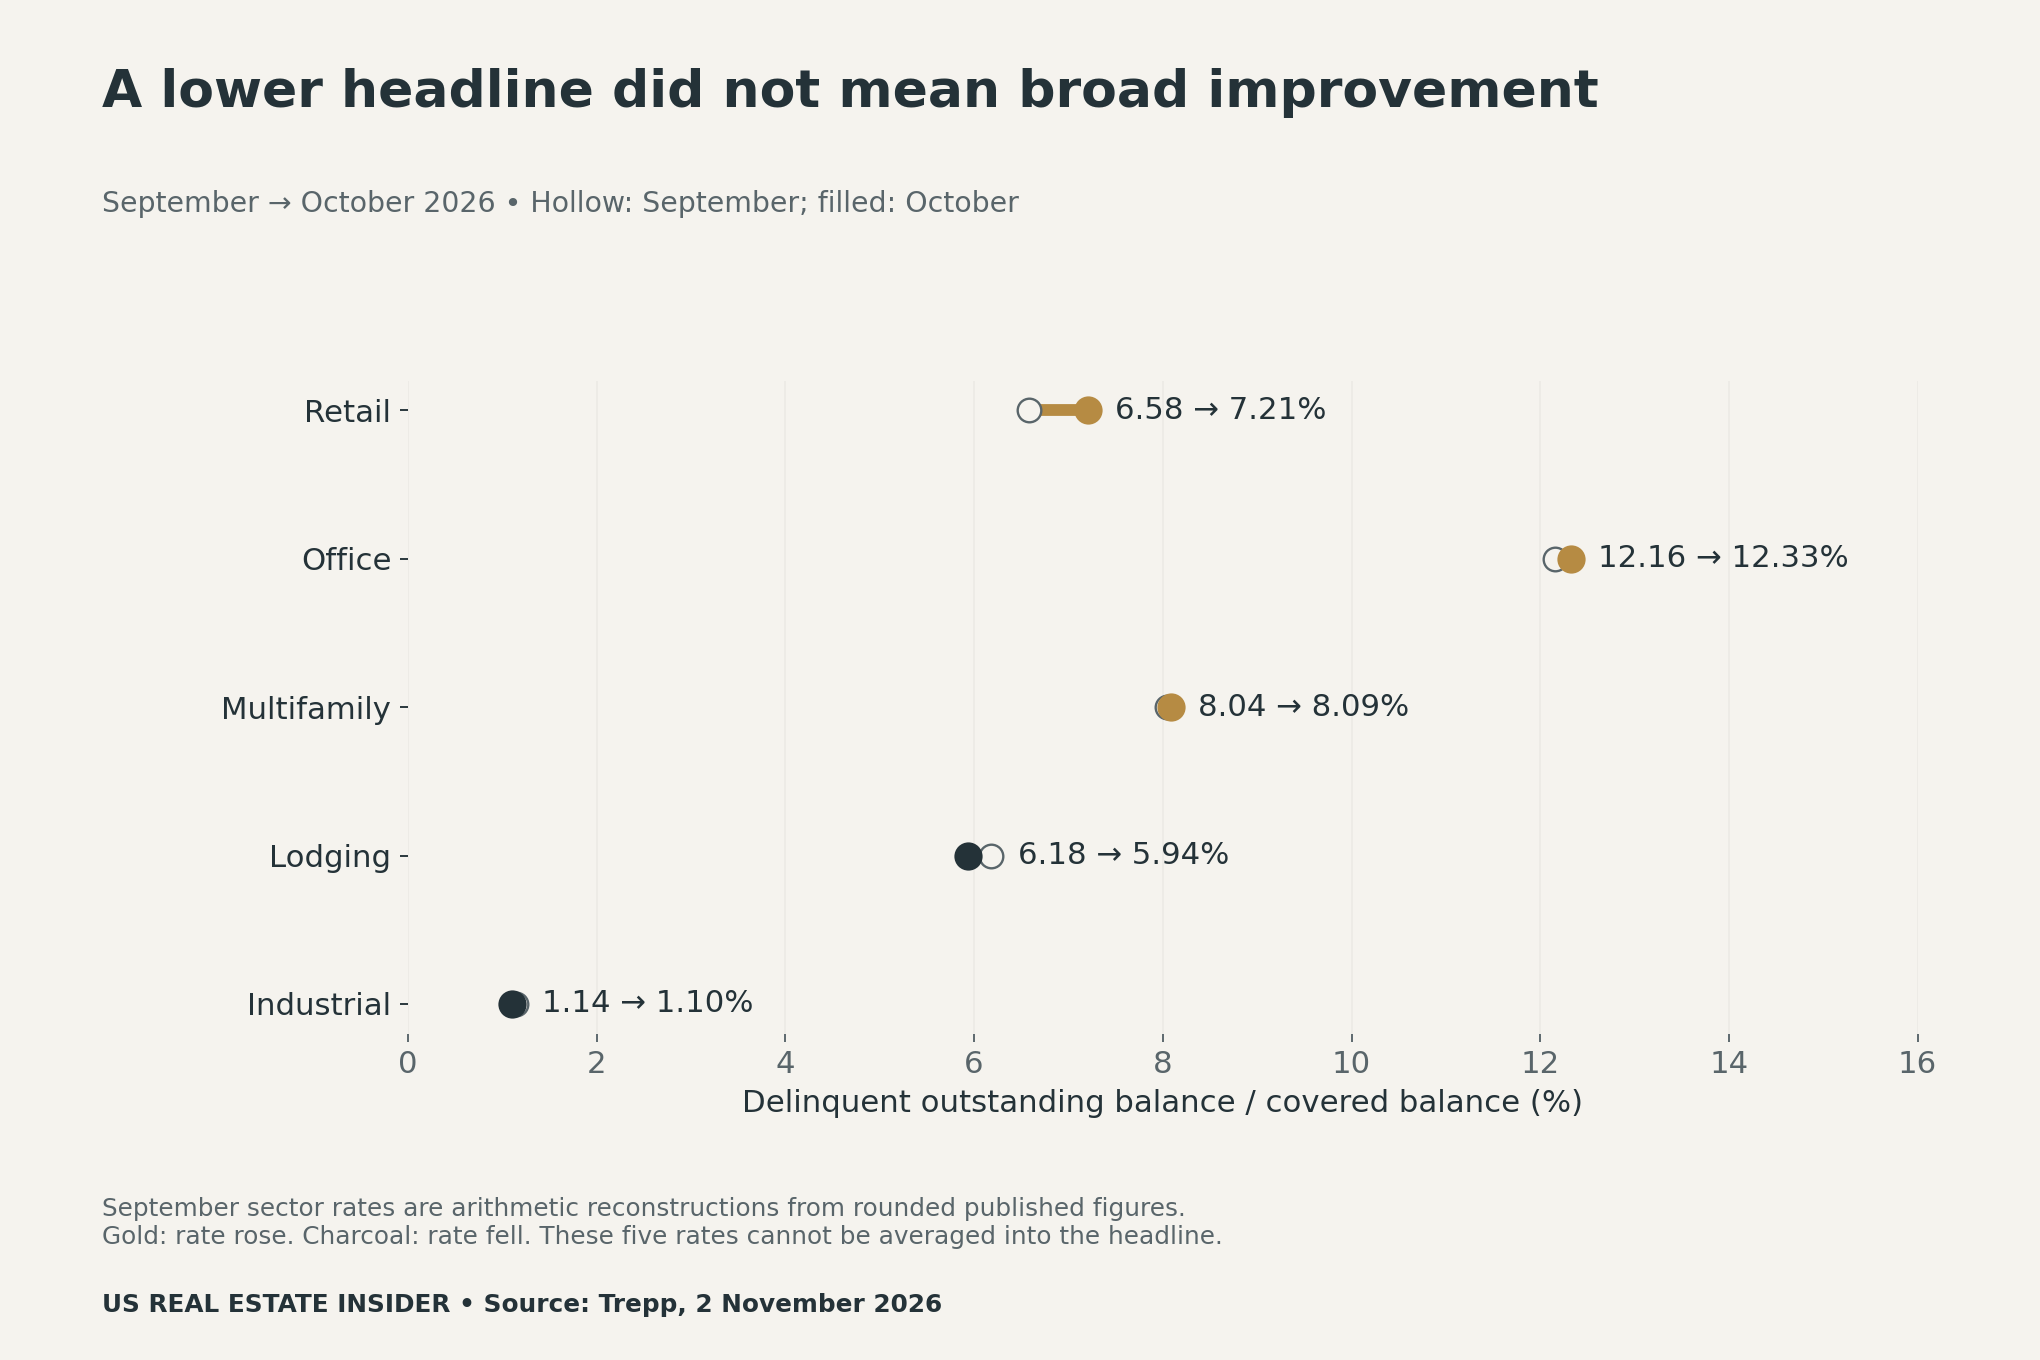
The level and change answer separate questions. Office had the highest October rate among these five sectors. Retail had the largest monthly increase. A high level describes the share of covered balance in a delinquent status; a large increase describes movement since the comparison month. Keep both measures visible before choosing which sector deserves closer investigation.
Reconstruct the basis-point arithmetic
One basis point is 0.01 percentage point. To reverse retail’s reported increase, subtract 0.63 percentage point from 7.21%, producing 6.58%. To reverse lodging’s decline, add 0.24 percentage point to 5.94%, producing 6.18%. Our CSV labels these reconstructed values, because the source inputs are already rounded.
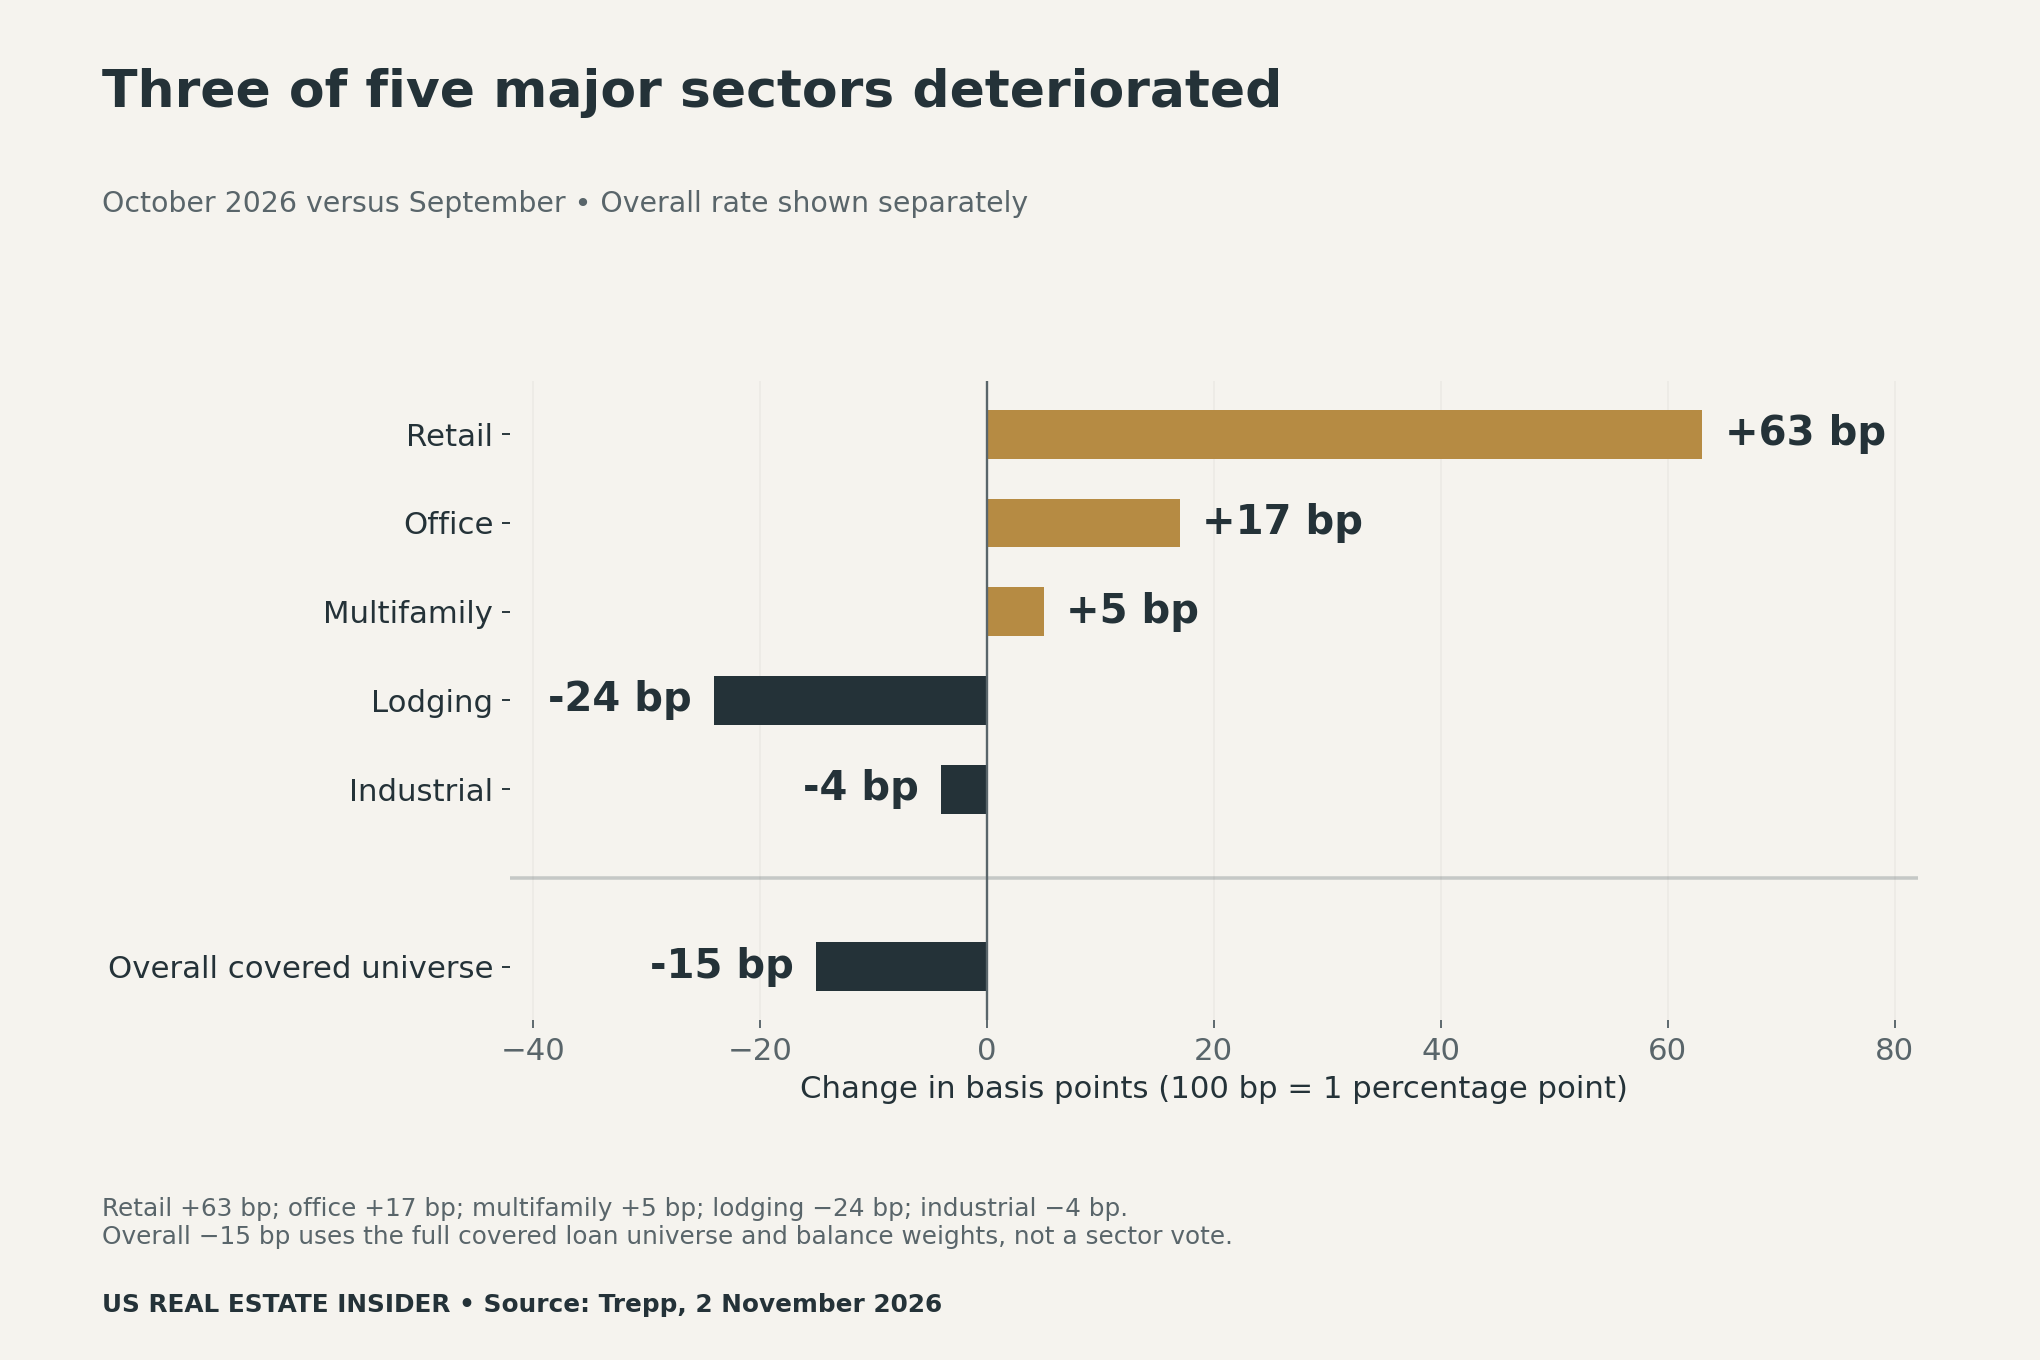
Do not call the retail move a 63% increase. That would confuse a basis-point difference with a relative percentage change. Nor should you attach false precision to the reconstructed September rates: they reverse published rounded figures, rather than uncover additional loan-level observations.
Why a large balance can outweigh several smaller loans
The Trepp methodology guide defines the headline using delinquent loan balances divided by covered balances. It includes defeased loans in the denominator under its stated method. The guide also covers property types beyond the five major categories. Averaging the five sector percentages therefore cannot reproduce the published overall rate.
A sector count answers a breadth question: how many of the selected sectors worsened? The headline answers a balance question: what share of the covered loan balance is delinquent? Those questions can move in opposite directions. The result does not require a calculation error or a contradiction in the release.
To make the distinction reproducible, consider an entirely fictional $1 billion pool. Loan A has a $500 million balance. Four other loans each have $125 million balances. Initially, A alone is delinquent, so delinquent balance is $500 million and the rate is 50%. Later, A becomes current while three smaller loans become delinquent. Delinquent balance is then $375 million, giving a 37.5% rate. The number of delinquent loans rose from one to three while their share of balance fell.
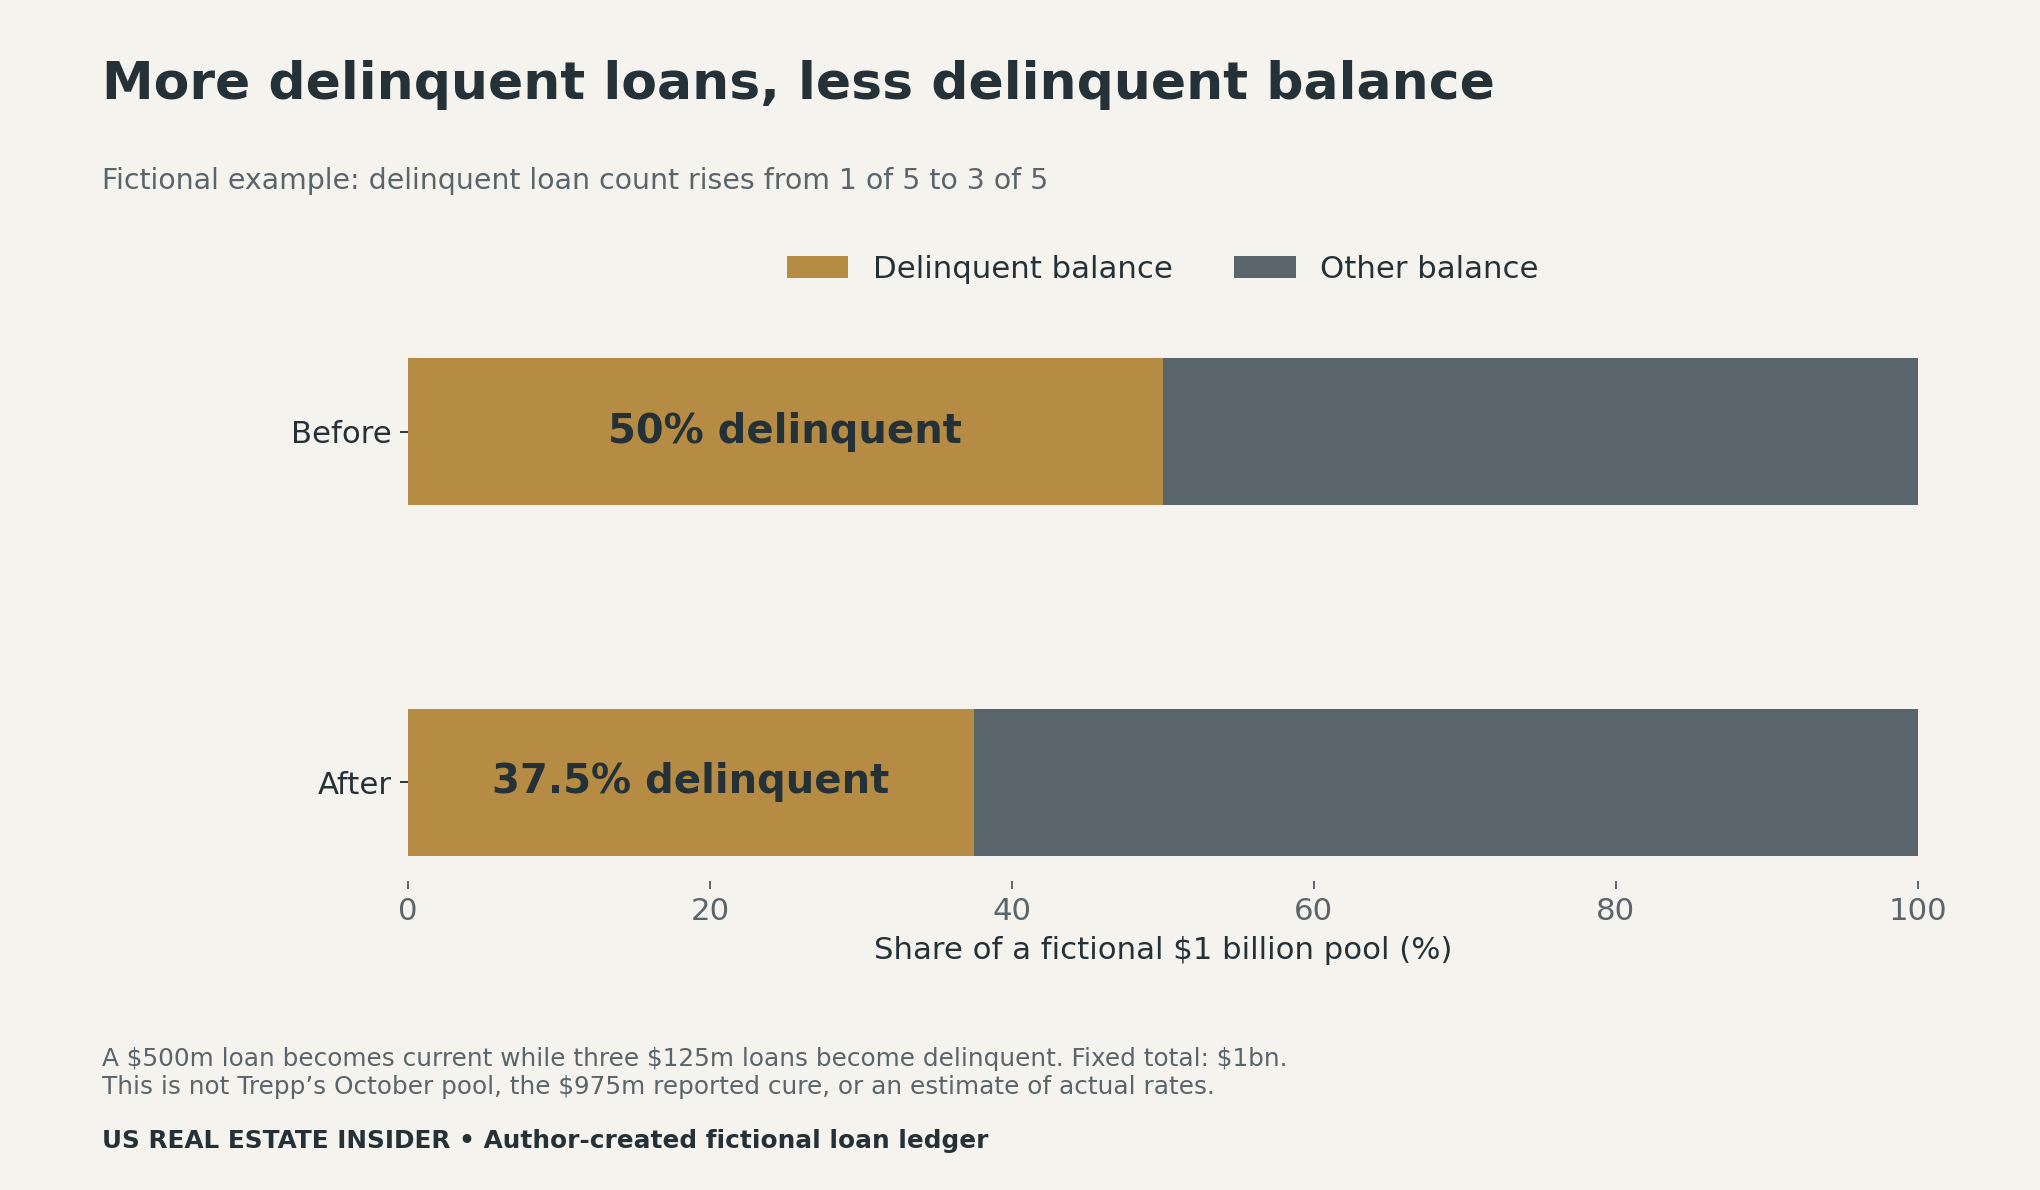
The toy pool holds total balances constant to isolate weighting. Real monthly comparisons can also involve payoffs, new loans, amortization, liquidations and changing classifications. We have not obtained the complete covered balances needed to rebuild October’s actual aggregate. Consequently, we do not calculate a counterfactual rate with the reported showroom loan removed.
Payment status is not the same as full economic recovery
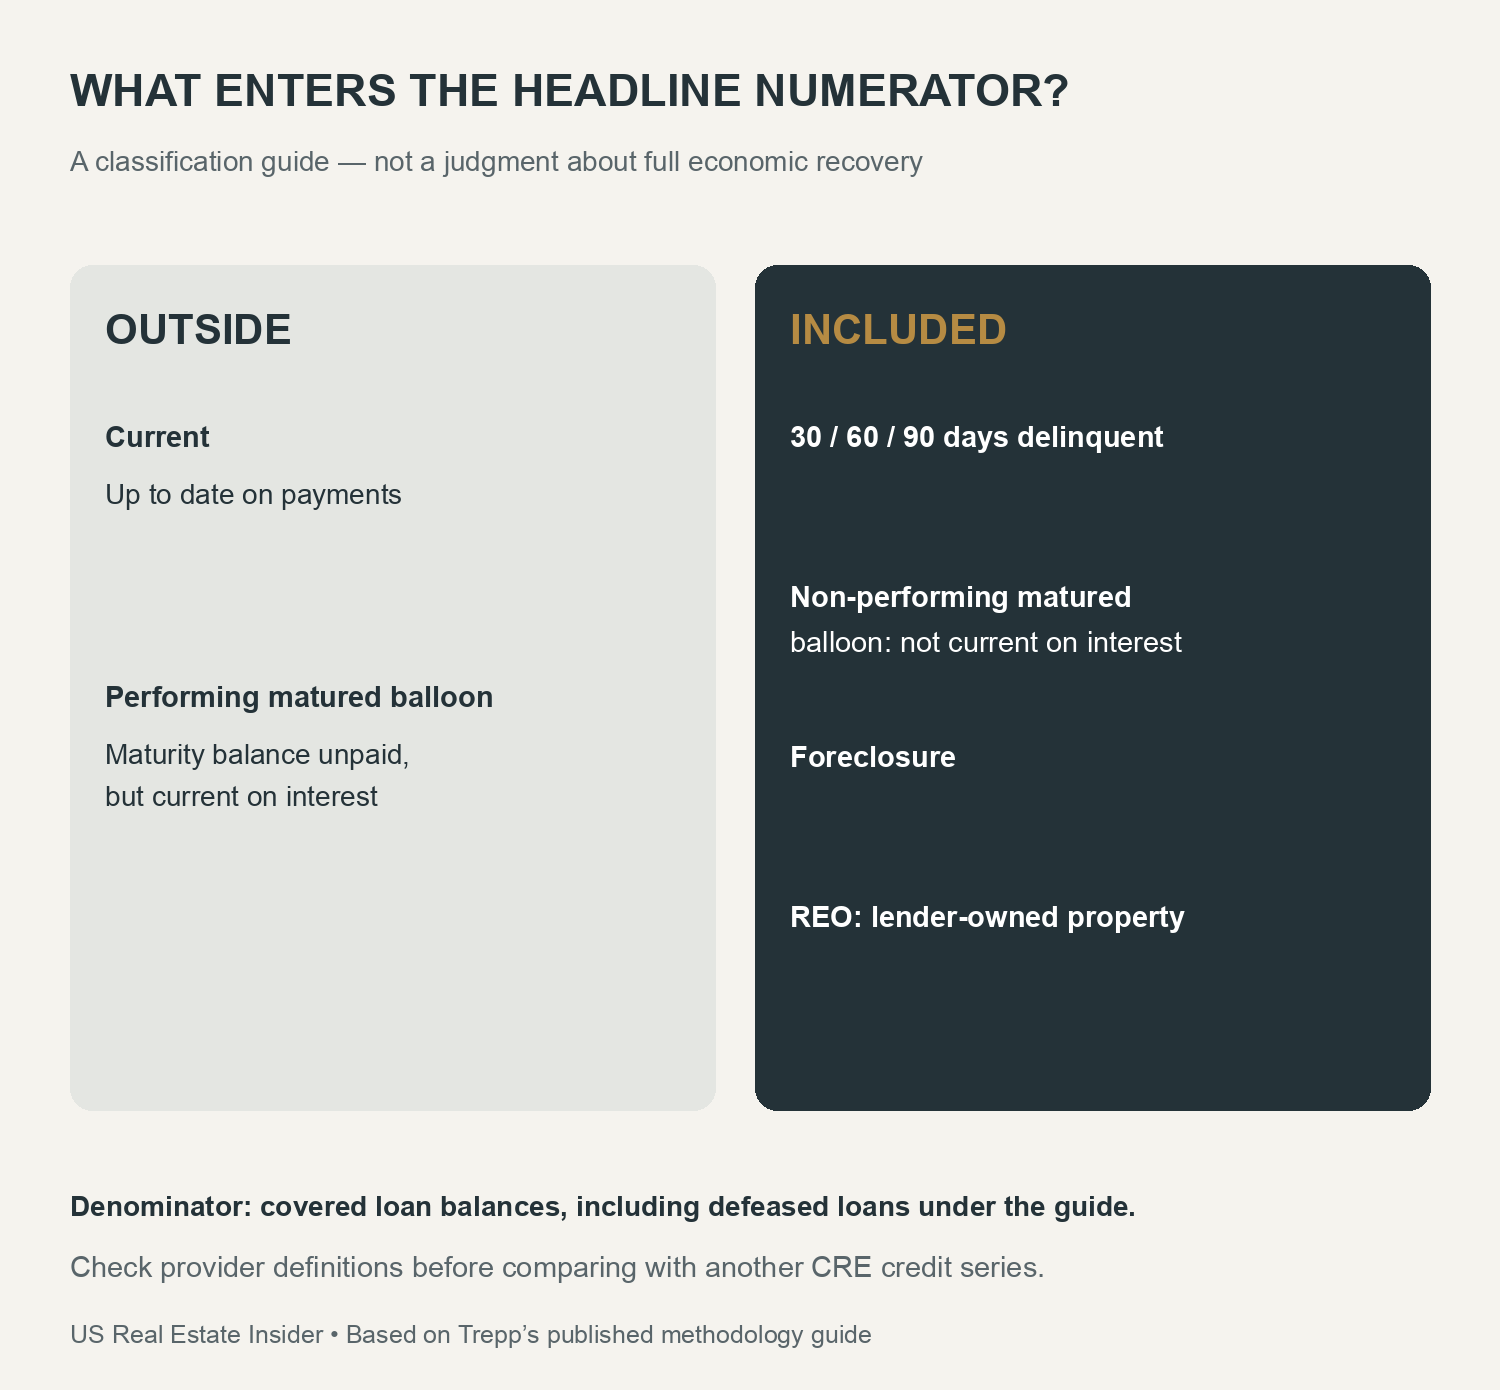
The methodology distinguishes a performing matured balloon from a non-performing one. In the former, the maturity balance remains unpaid but interest is current; it is outside the headline delinquent numerator. The latter is included. The headline also includes the listed 30-, 60- and 90-day delinquency categories, foreclosure and REO. Our classification guide keeps those distinctions visible.
For an individual property, investigate current cash flow, lease expirations, debt maturity, servicing notes and the terms behind any status change. A loan returning to current status is relevant evidence, but it does not answer every operating or refinancing question. Keep those documents separate from a monthly provider-wide percentage.
Use comparable coverage before comparing credit headlines
This CMBS series does not represent every commercial real estate loan. Different providers and lender groups can cover different products and apply different treatment to maturities, defeasance and delinquency statuses. A bank-loan rate and a CMBS rate should not be presented as directly comparable without reconciling their definitions and dates.
The blank surveillance worksheet asks for universe, denominator, weights, classification rules and change drivers. Use it before interpreting another headline. For a related distinction between valuation assumptions and credit status, see our commercial-property cap-rate stress test. Our stock-versus-inflow analysis offers another example of valid measures answering different questions.
Download the rate bridge and checking tools
These original CSVs retain source links and distinguish reported values, reconstructed arithmetic and fictional records. The blank worksheet contains no actual borrower or property information. Keep those labels if you reuse the files in a presentation or training session.
- Sector rates and basis-point reconstruction (CSV)
- Fictional five-loan balance-weighting ledger (CSV)
- Loan-status classification reading guide (CSV)
- Blank CMBS surveillance worksheet (CSV)
We verified the selected October values against Trepp’s dated public announcement and used decimal arithmetic to reverse its basis-point changes. We did not acquire proprietary loan microdata, independently verify the reported loan cure or estimate future defaults. The three charts explain sector levels, monthly changes and a fictional weighting mechanism. None is an investment recommendation or a forecast.
Suggested citation: US Real Estate Insider, “October 2026 CMBS Delinquency Rates: Why Three Sectors Worsened,” November 7, 2026. Source: Trepp’s November 2 announcement and methodology guide. September sector values are arithmetic reconstructions; the five-loan pool is fictional and created for this study.


