



Housing forecast assumptions need dates, units and status labels before they enter a decision model. A new document can contain an earlier input cutoff or a component updated on a different schedule. Our dated register explains how to read those distinctions, then tests a separate fictional property scenario.
Read the notes behind the housing forecast assumptions
Fannie Mae’s 12 November 2026 housing forecast uses rates from 30 October for its interest-rate inputs. It also says the HPI forecast updates in the first month of each quarter. Thus, the document’s November date does not establish that every component was newly revised that month.
The table projects a 7.2% annual-average 30-year fixed mortgage rate and 3.989 million existing-home sales for 2027. Those are forecasts for a stated horizon, not observed 2027 outcomes or loan offers. Keep the units separate; a rate and a sales count do not belong on one shared numerical scale.
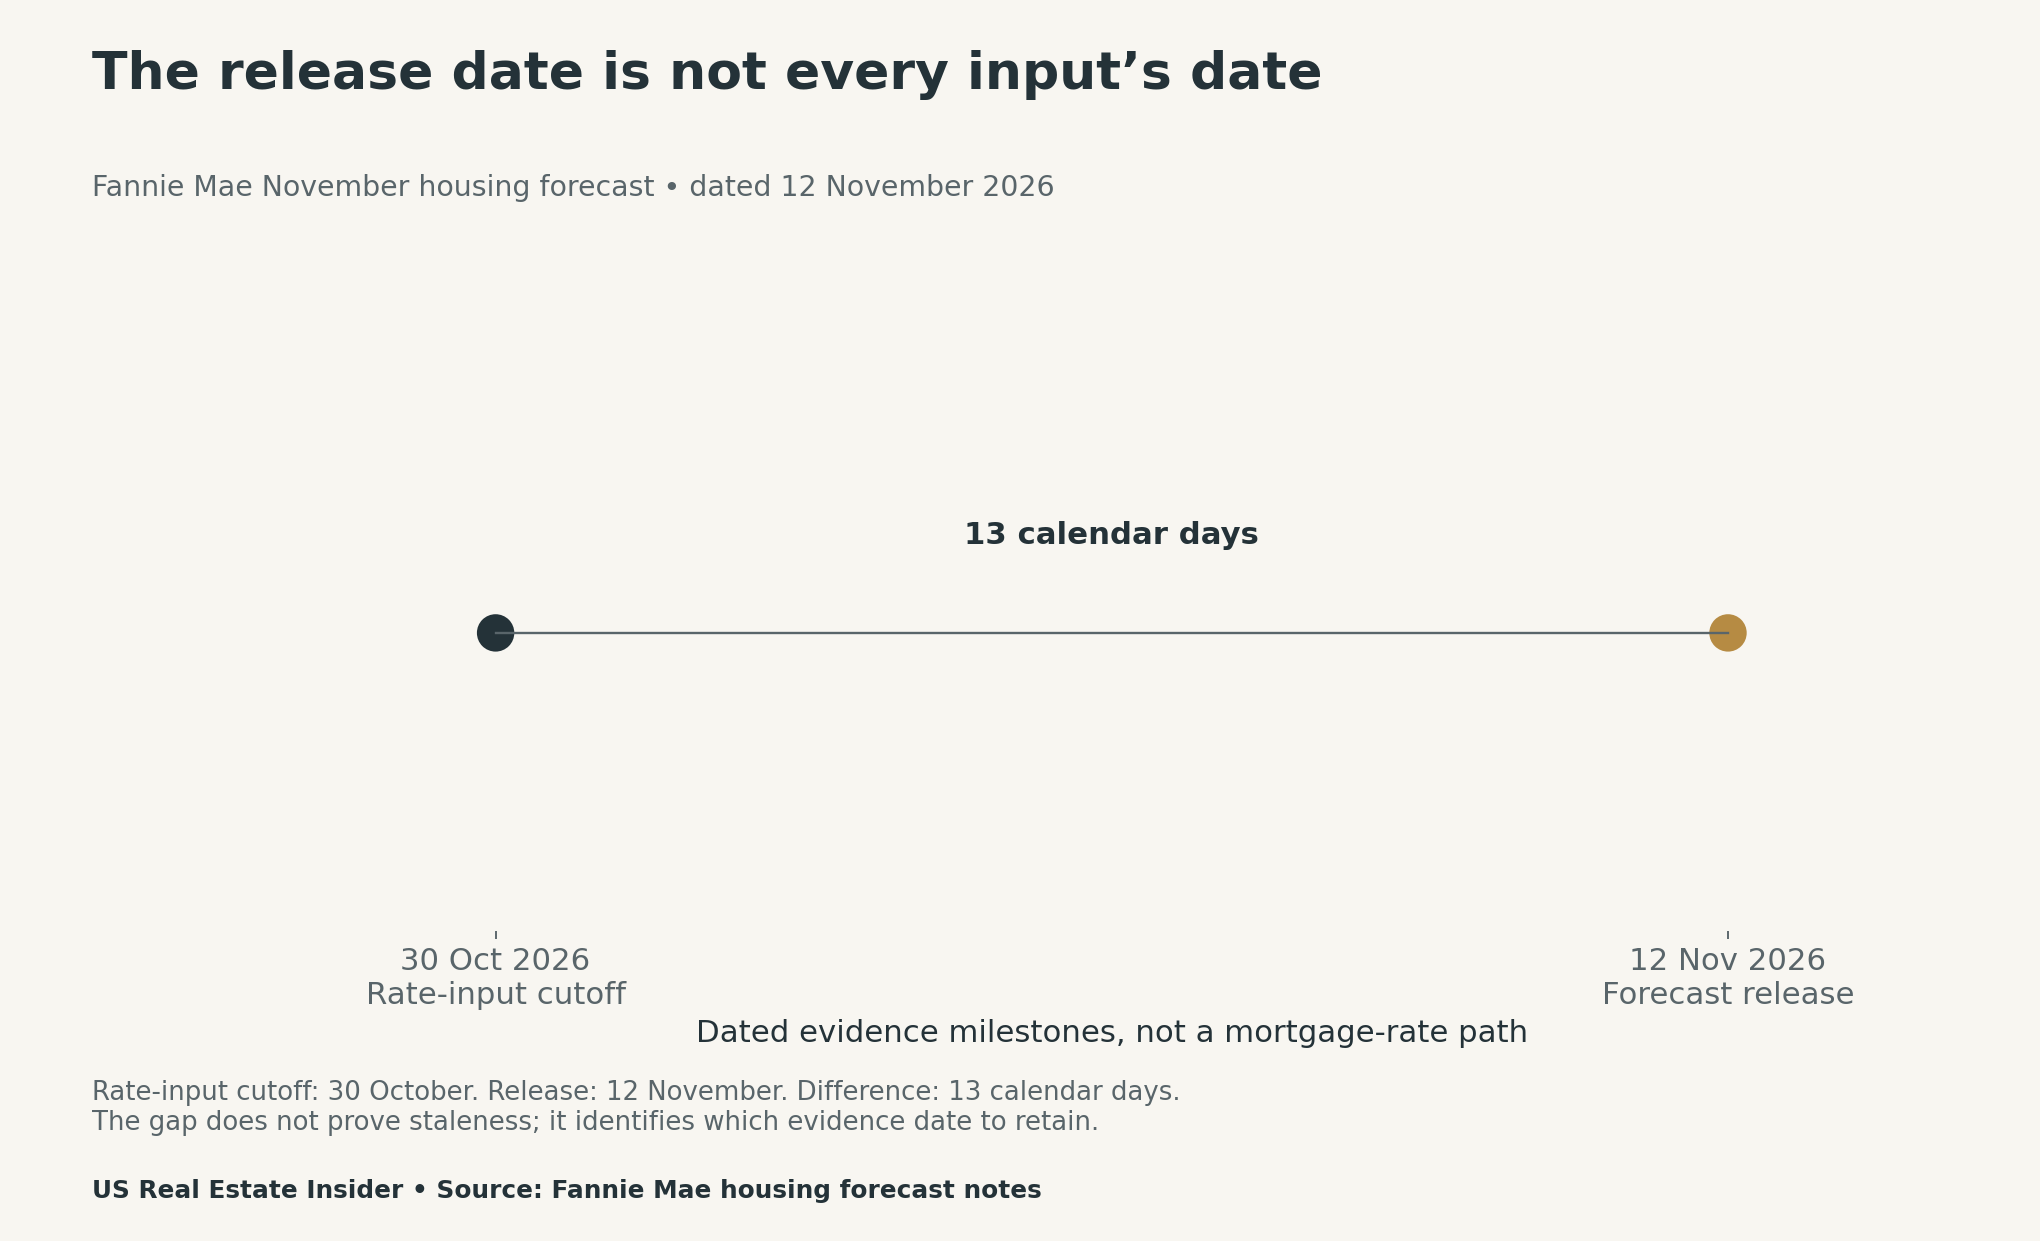
Attach four clocks to each assumption
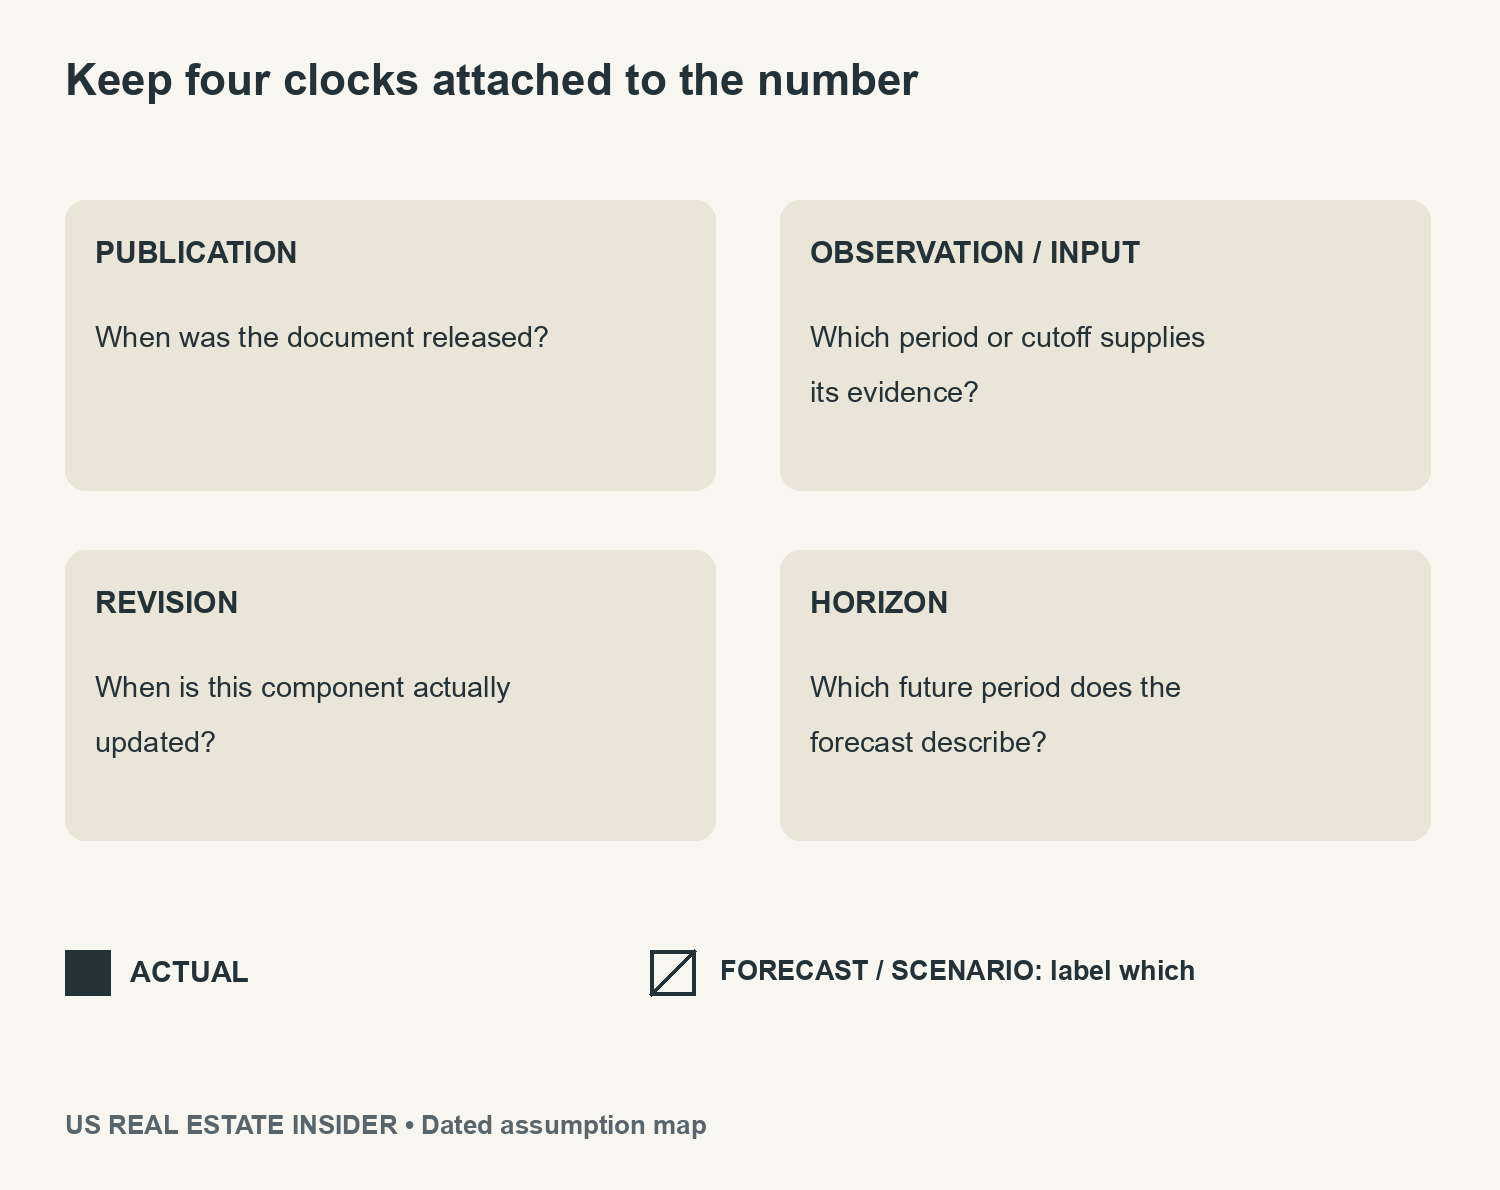
First, record the release date. Next, identify the observation period or input cutoff. Then retain the revision rule for that component. Finally, state the future period being projected. These fields prevent a reader from mistaking an annual average for a year-end reading or an older input for today’s quote.
A blank field should remain unknown until you inspect the source. For example, do not insert a house-price value merely because the document contains an HPI row. Match its quarter or annual definition and update schedule before using it. The supplied register leaves that value unfilled rather than guessing.
Keep actuals, estimates, forecasts and scenarios distinct
A published historical observation describes a measured past period, subject to its source’s method and revisions. An estimate is not automatically a final count. A forecast projects a future period under assumptions. An editorial scenario asks what would happen if chosen inputs held.
Use written labels and a non-color cue in tables and graphics. For example, a filled symbol can identify an actual and an outlined symbol a projection. Always include the words too. A reader should not need to distinguish two colors to know which numbers have occurred.
Fannie Mae’s notes identify unshaded cells as actuals and shaded cells as forecasts. They also say mortgage-originations data are estimates. Retain those qualifications if using those rows; do not silently promote every unshaded or precise-looking number into an observed final market count.
Build a separate fictional property sensitivity
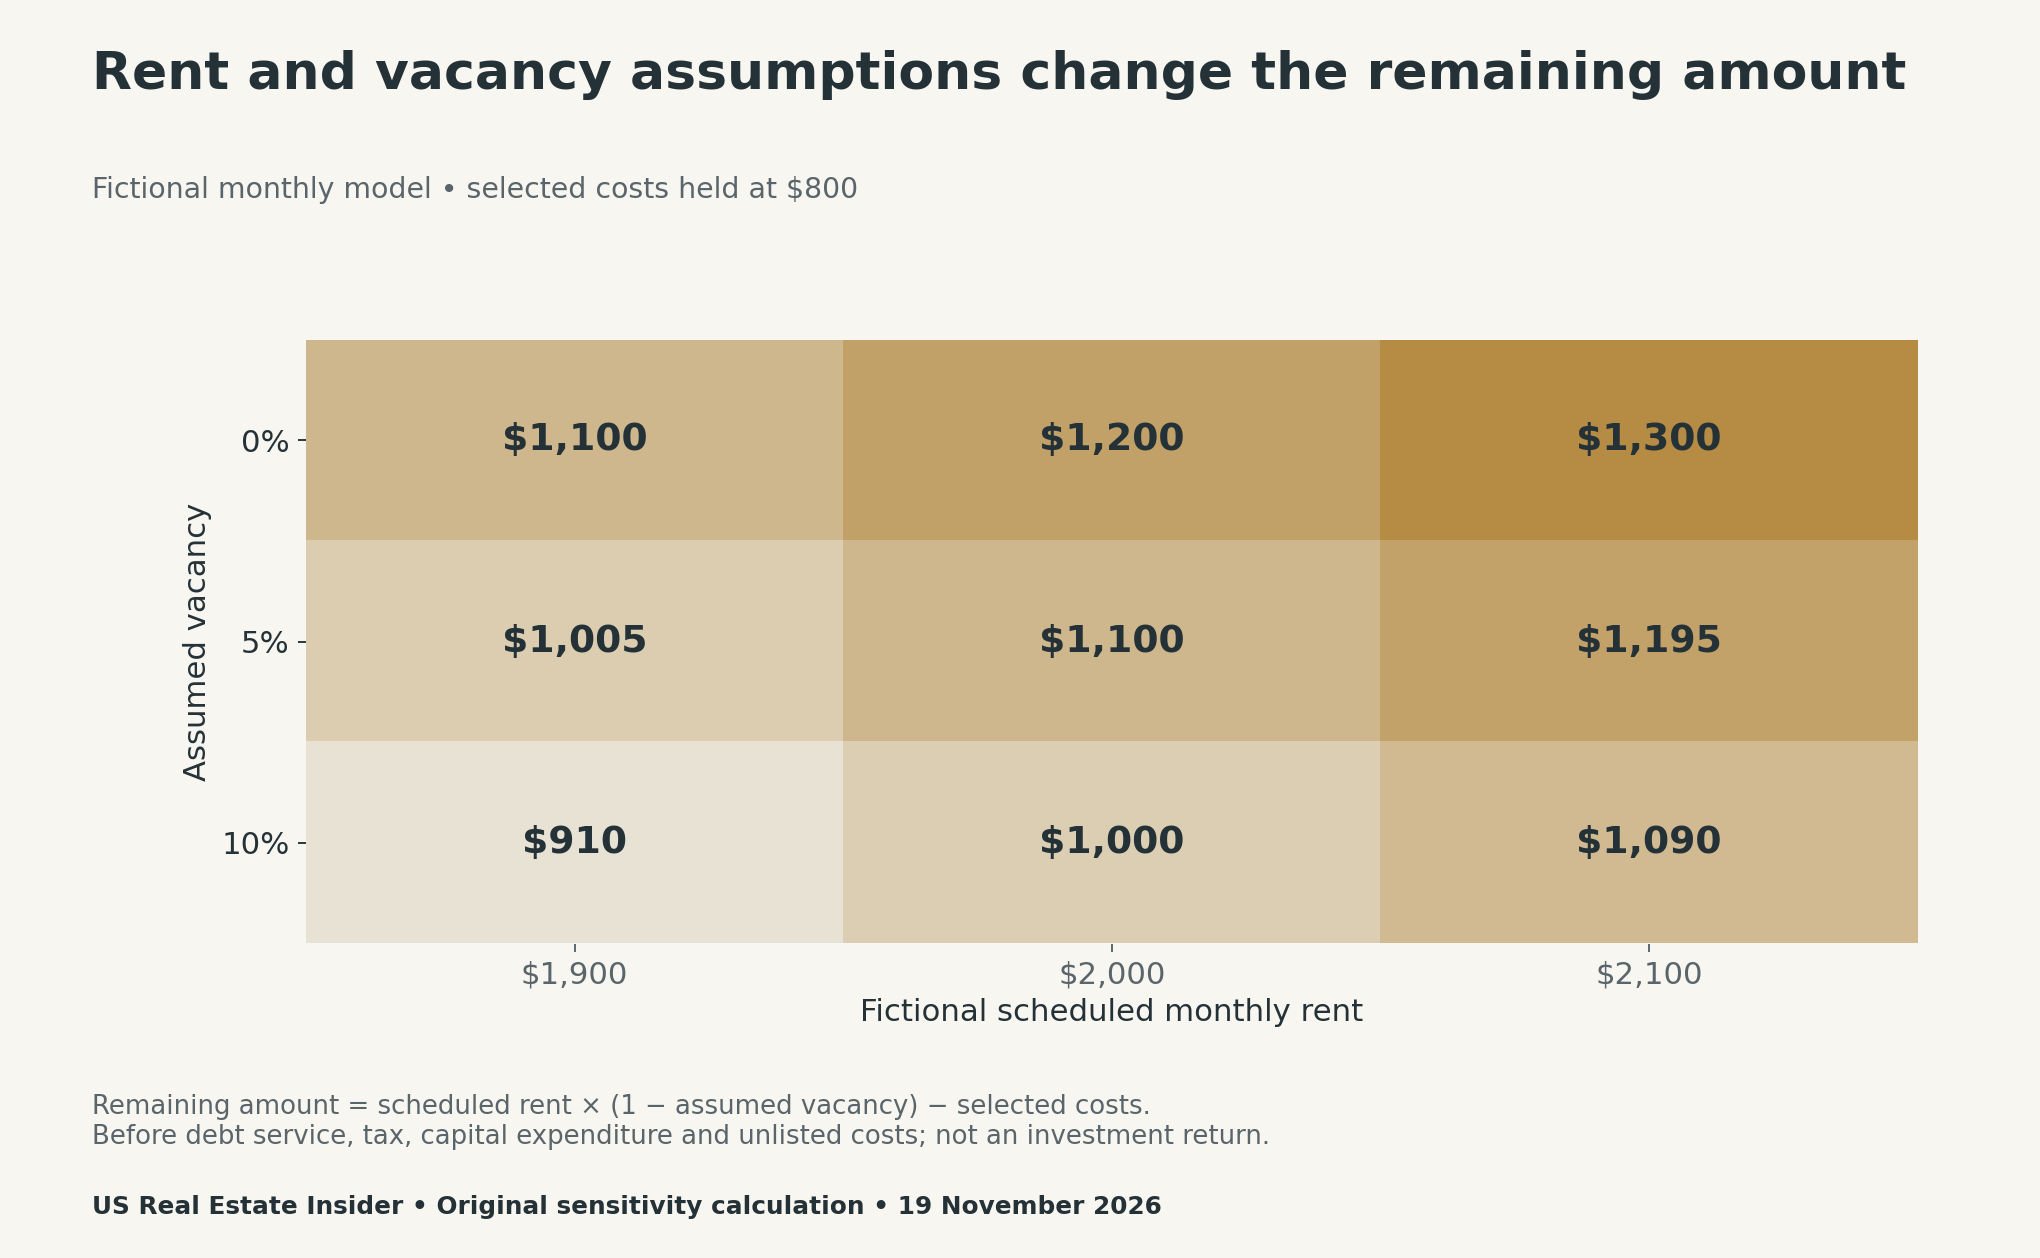
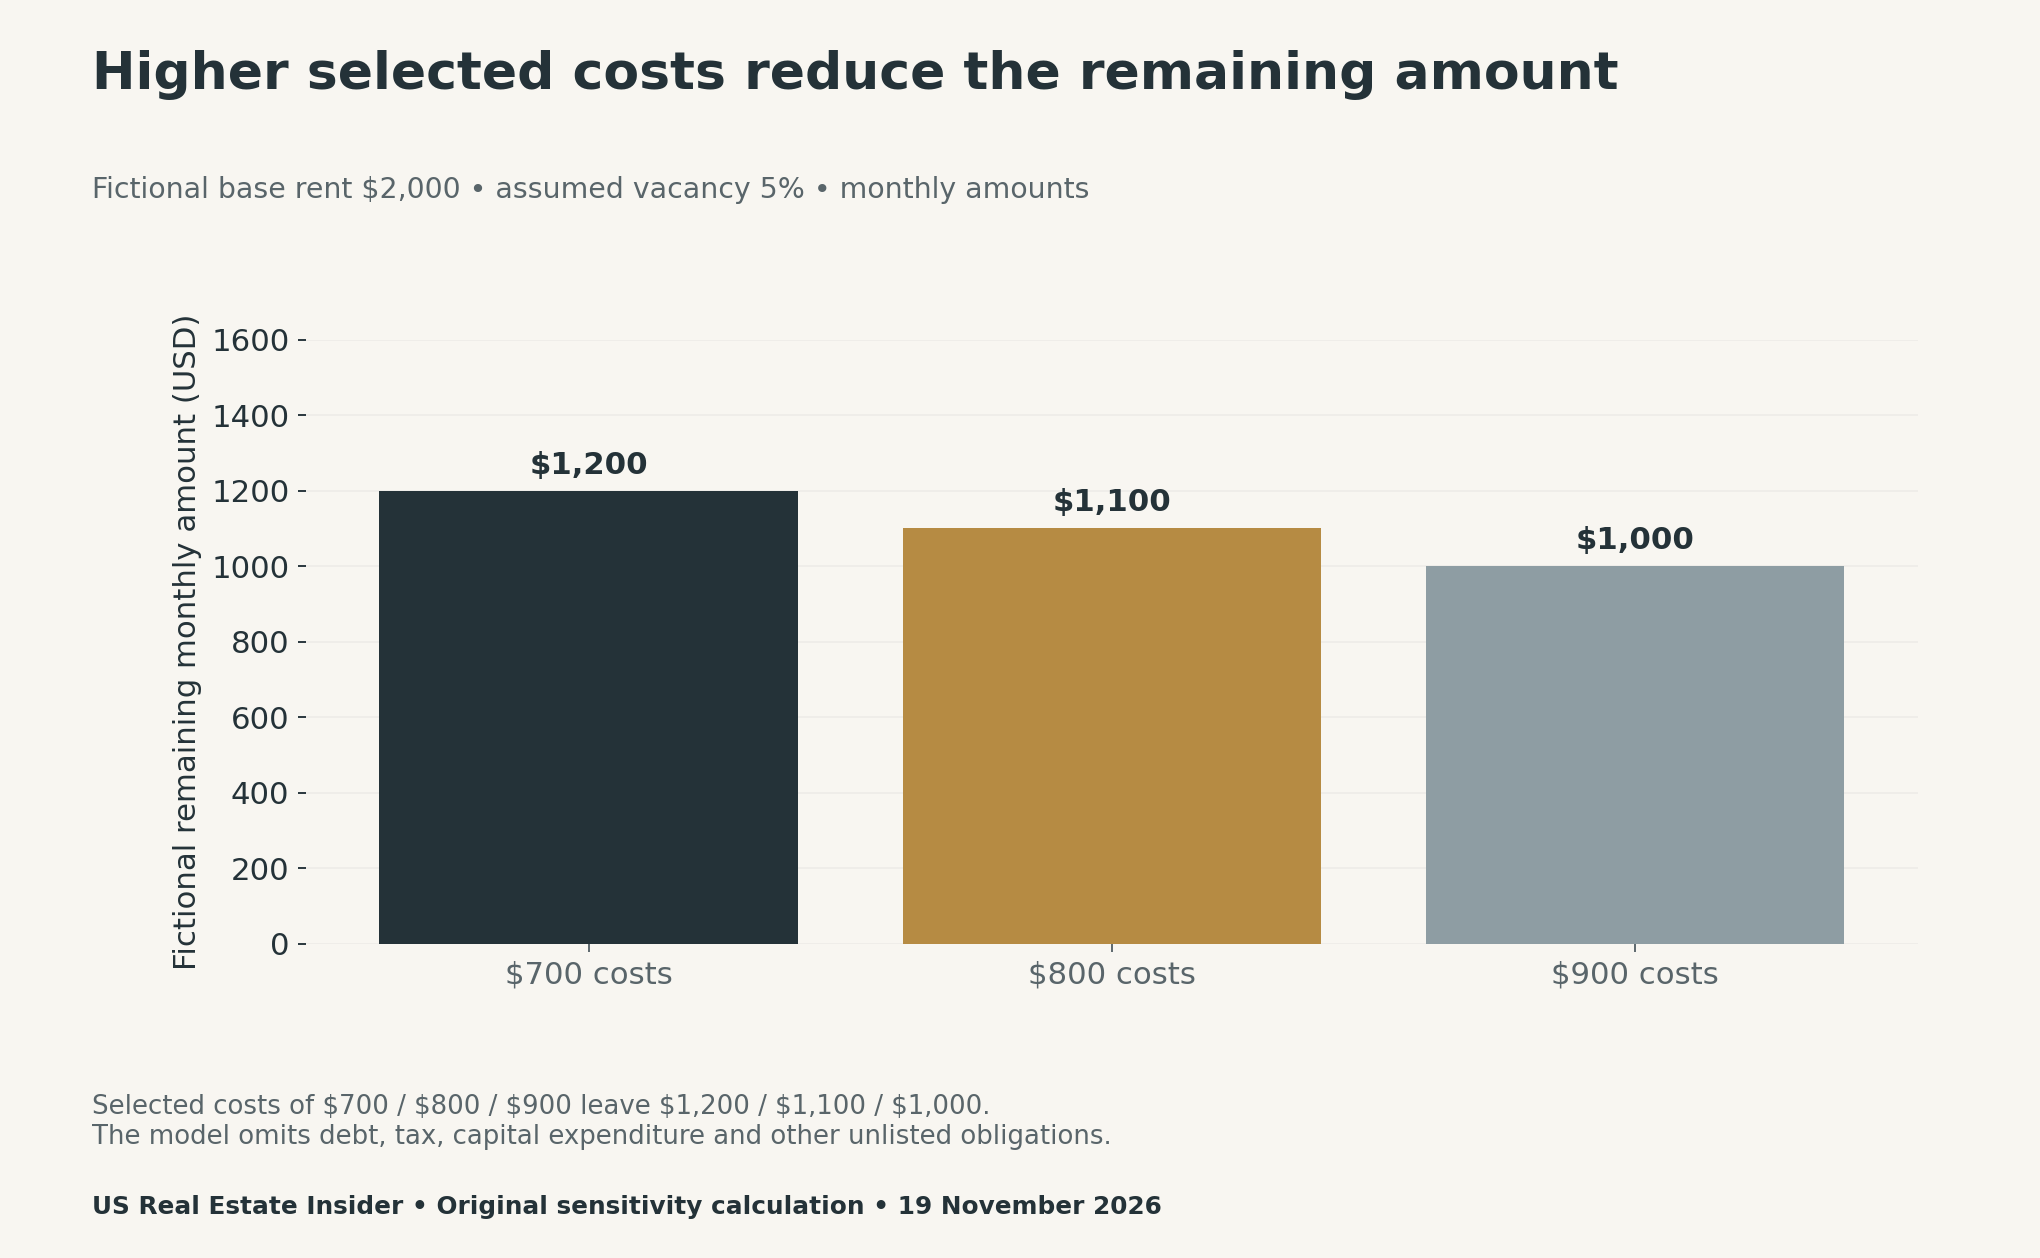
Our property example starts with $2,000 scheduled monthly rent, a 5% vacancy assumption and $800 in selected monthly costs. The calculation is $2,000 × (1 − 0.05) − $800 = $1,100. All three inputs are fictional editorial choices, not Fannie Mae projections or local quotations.
We call the result a remaining amount. It is before debt service, tax, capital expenditure and any unlisted costs. Therefore, it is not a profit, cash-on-cash return, cap rate or recommendation to buy a property. The label matters as much as the arithmetic.
Change one input at a time before combining stresses
The grid keeps costs fixed while rent and vacancy vary. At $2,000 rent, a five-percentage-point increase in assumed vacancy reduces the remaining amount by $100 per month. This is a direct consequence of the chosen rent input, not a market finding.
The downloadable sensitivity file also varies selected costs across $700, $800 and $900. It retains all 27 combinations. This makes the assumptions auditable rather than publishing only the most attractive cell. Do not assign probabilities to those rows without a defensible separate model.
Use national context without substituting it for local evidence
A national forecast may help frame a planning discussion. However, a particular property needs current evidence about rent, operating obligations, financing, condition and legal use. A forecast annual mortgage average cannot replace an actual lender quote for a named borrower and loan.
Similarly, do not apply a national price forecast mechanically to one asset and call the result an appraisal. Our median-versus-value guide explains why property-specific evidence matters. The industrial-fit worksheet applies the same discipline to building requirements.
Decide what will trigger a review
The register includes a next-review trigger rather than an invented expiration date. A new source release, a changed lender quote, a material inspection finding or a verified local lease can justify revisiting an assumption. Record which input changed and preserve the earlier version.
Use Fannie Mae’s monthly forecast archive when comparing releases. Compare the same row, unit, horizon and status in each version. A change in a forecast is a revision of an expectation; it is not automatically a realised market change.
Download the dated register and sensitivity tools
- Selected forecast assumptions with dates, horizon and revision notes (CSV)
- All 27 fictional rent, vacancy and selected-cost combinations (CSV)
- Fictional base-case arithmetic and omitted-cost definition (CSV)
- Blank dated assumption and review-trigger register (CSV)
Methodology and limitations
We checked the official one-page November forecast and its notes on 19 November 2026. The selected 2027 measures come from the annual columns, not a quarterly column. We converted the existing-sales figure from thousands to millions for readability and preserved the original interpretation in the source register.
The date gap is calendar arithmetic. The property model is an independent editorial sensitivity, with no fitted relationship to the national forecasts. It does not measure local availability, achievable rent, financing eligibility or investment performance. Recheck the original source and current property evidence when using any assumption.


