



The median home price vs home value distinction matters when a nearly flat national headline meets a very different local market. A median describes the middle transaction in a defined sales sample. It does not revalue your own home. Our reproducible example shows why a changing sales mix can move that middle price even when both price tiers stay fixed.
What the October release actually says
Homes.com’s 18 November 2026 analysis puts October’s national median sale price at $383,598, down 0.4% from a year earlier. Sales fell 11.7%, while inventory rose 4.8%. These are different measures, with different units. A small price change does not mean the number of transactions was stable.
The same release reports San Francisco’s median up 17.7% alongside a 13% sales decline, while Austin’s median fell 9.7%. Those market differences make the national number a poor substitute for property-level evidence. They do not, by themselves, identify why any local median changed.
We reproduce selected factual measures in the source CSV. We do not estimate how much of October’s movement came from composition. The fictional samples below explain a mathematical possibility, rather than establish a cause in Homes.com’s data.
Median home price vs home value: start with nine sales
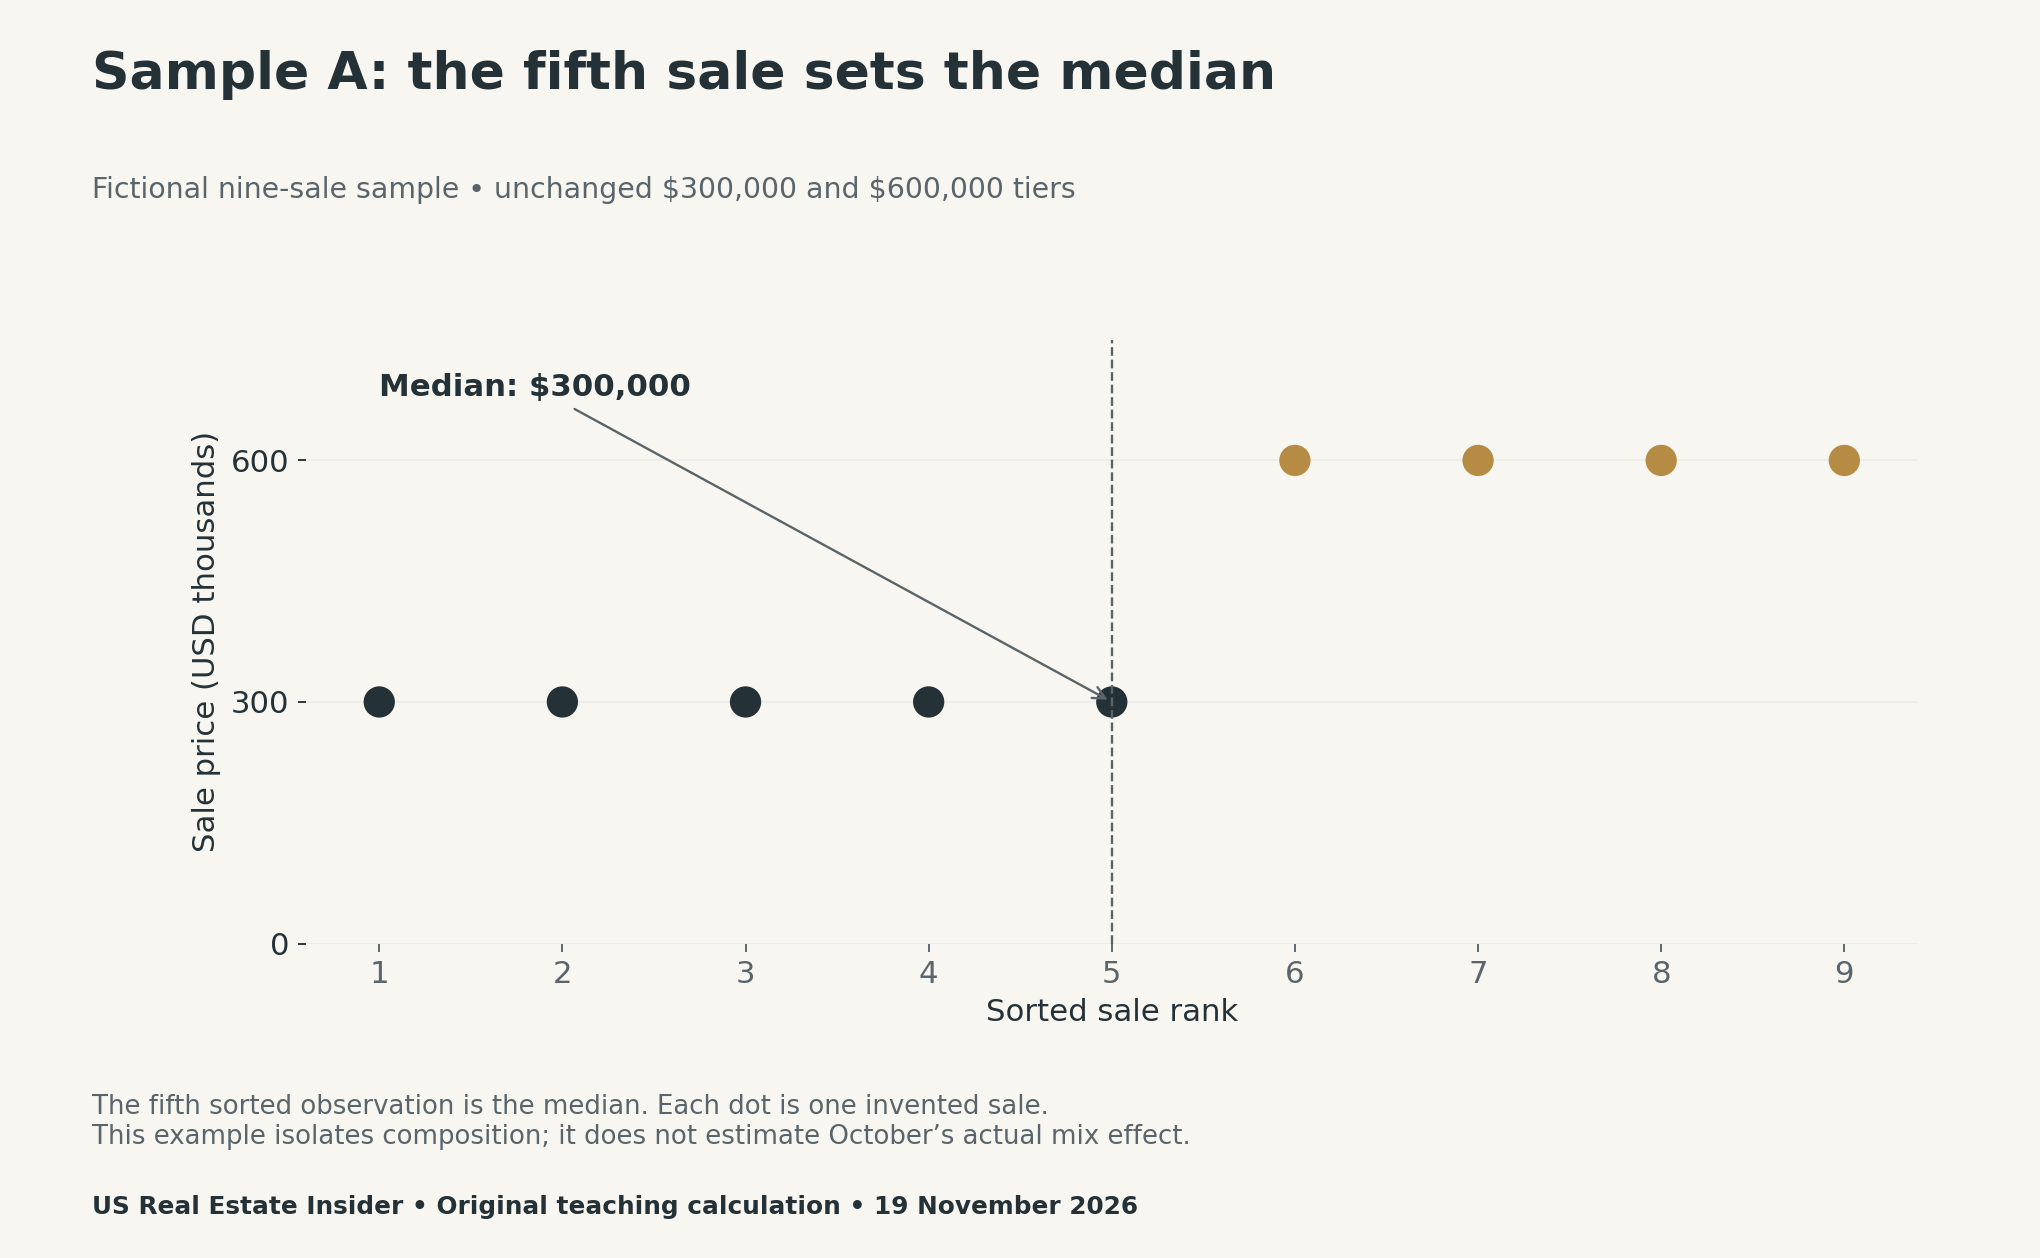
Imagine two price tiers: $300,000 and $600,000. In sample A, five lower-tier homes and four upper-tier homes sell. Sort the nine prices from lowest to highest. The fifth sale is $300,000, so the median is $300,000. Every dot in the first chart is invented for this lesson.
Now swap only the counts. Sample B contains four $300,000 sales and five $600,000 sales. Its fifth sorted price is $600,000. Therefore, its median is $600,000. Neither tier’s price changed, yet the median rose by $300,000, or 100%.
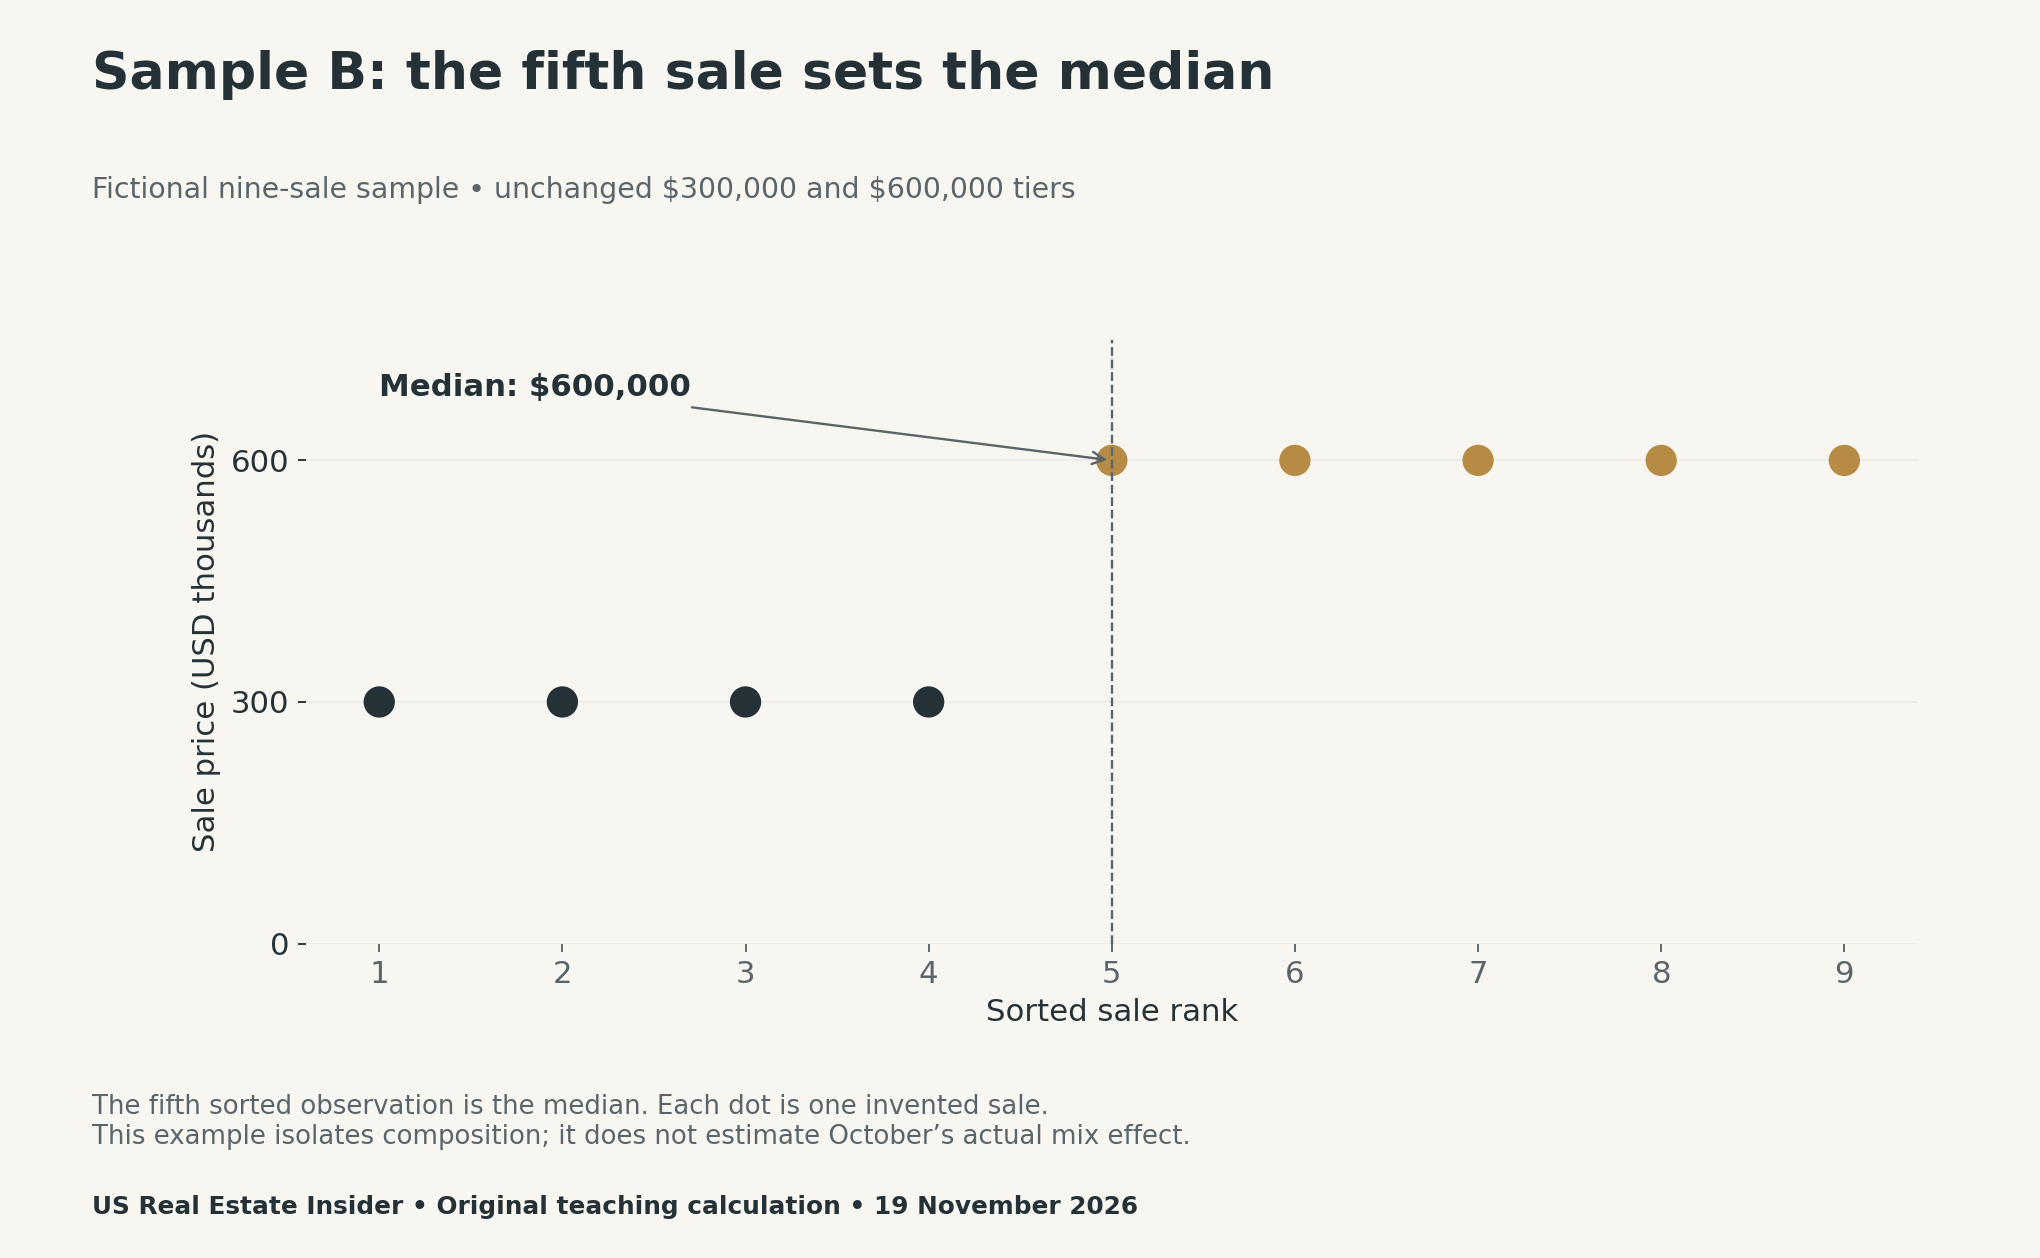
The calculation is (600,000 ÷ 300,000 − 1) × 100 = 100%. That percentage compares the two sample medians. It is not an appreciation rate for a particular property. In addition, the example does not follow the same nine properties through repeat transactions.
Track sales counts alongside the median home price
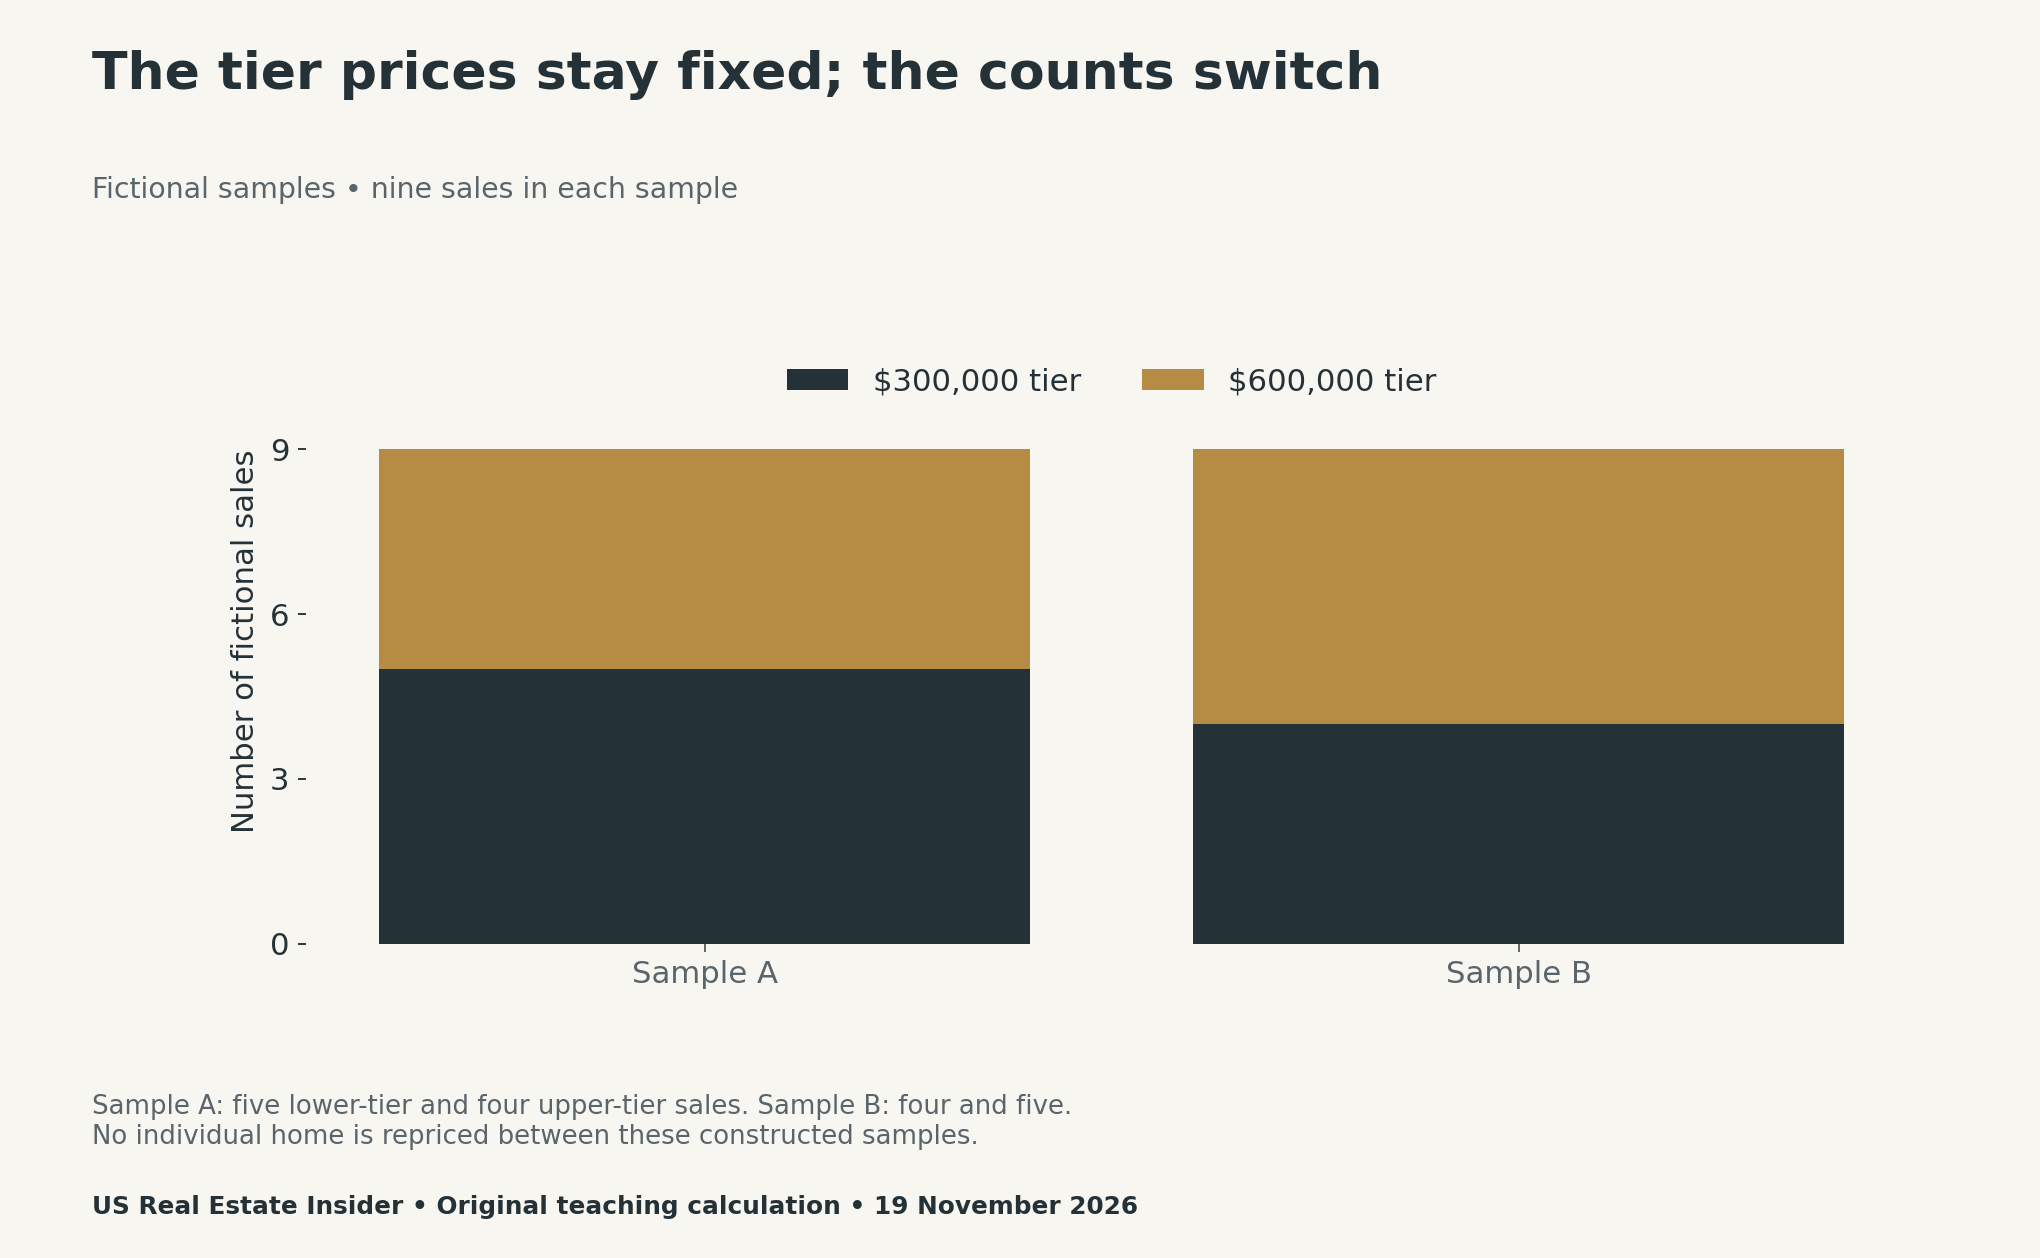
A home can differ from another home in size, location, type, condition and amenities. When the set of properties sold changes, the middle transaction can move. In a real market, prices within segments may change too. Separating those influences requires more detailed evidence than an aggregate median alone.
For instance, a month with more expensive-property transactions could show a higher median without showing the same gain in each neighborhood. Conversely, a lower median does not establish an equivalent loss on every property. Treat either claim as a question to investigate, rather than a conclusion to import into a listing price.
Test the boundary instead of inventing an October explanation
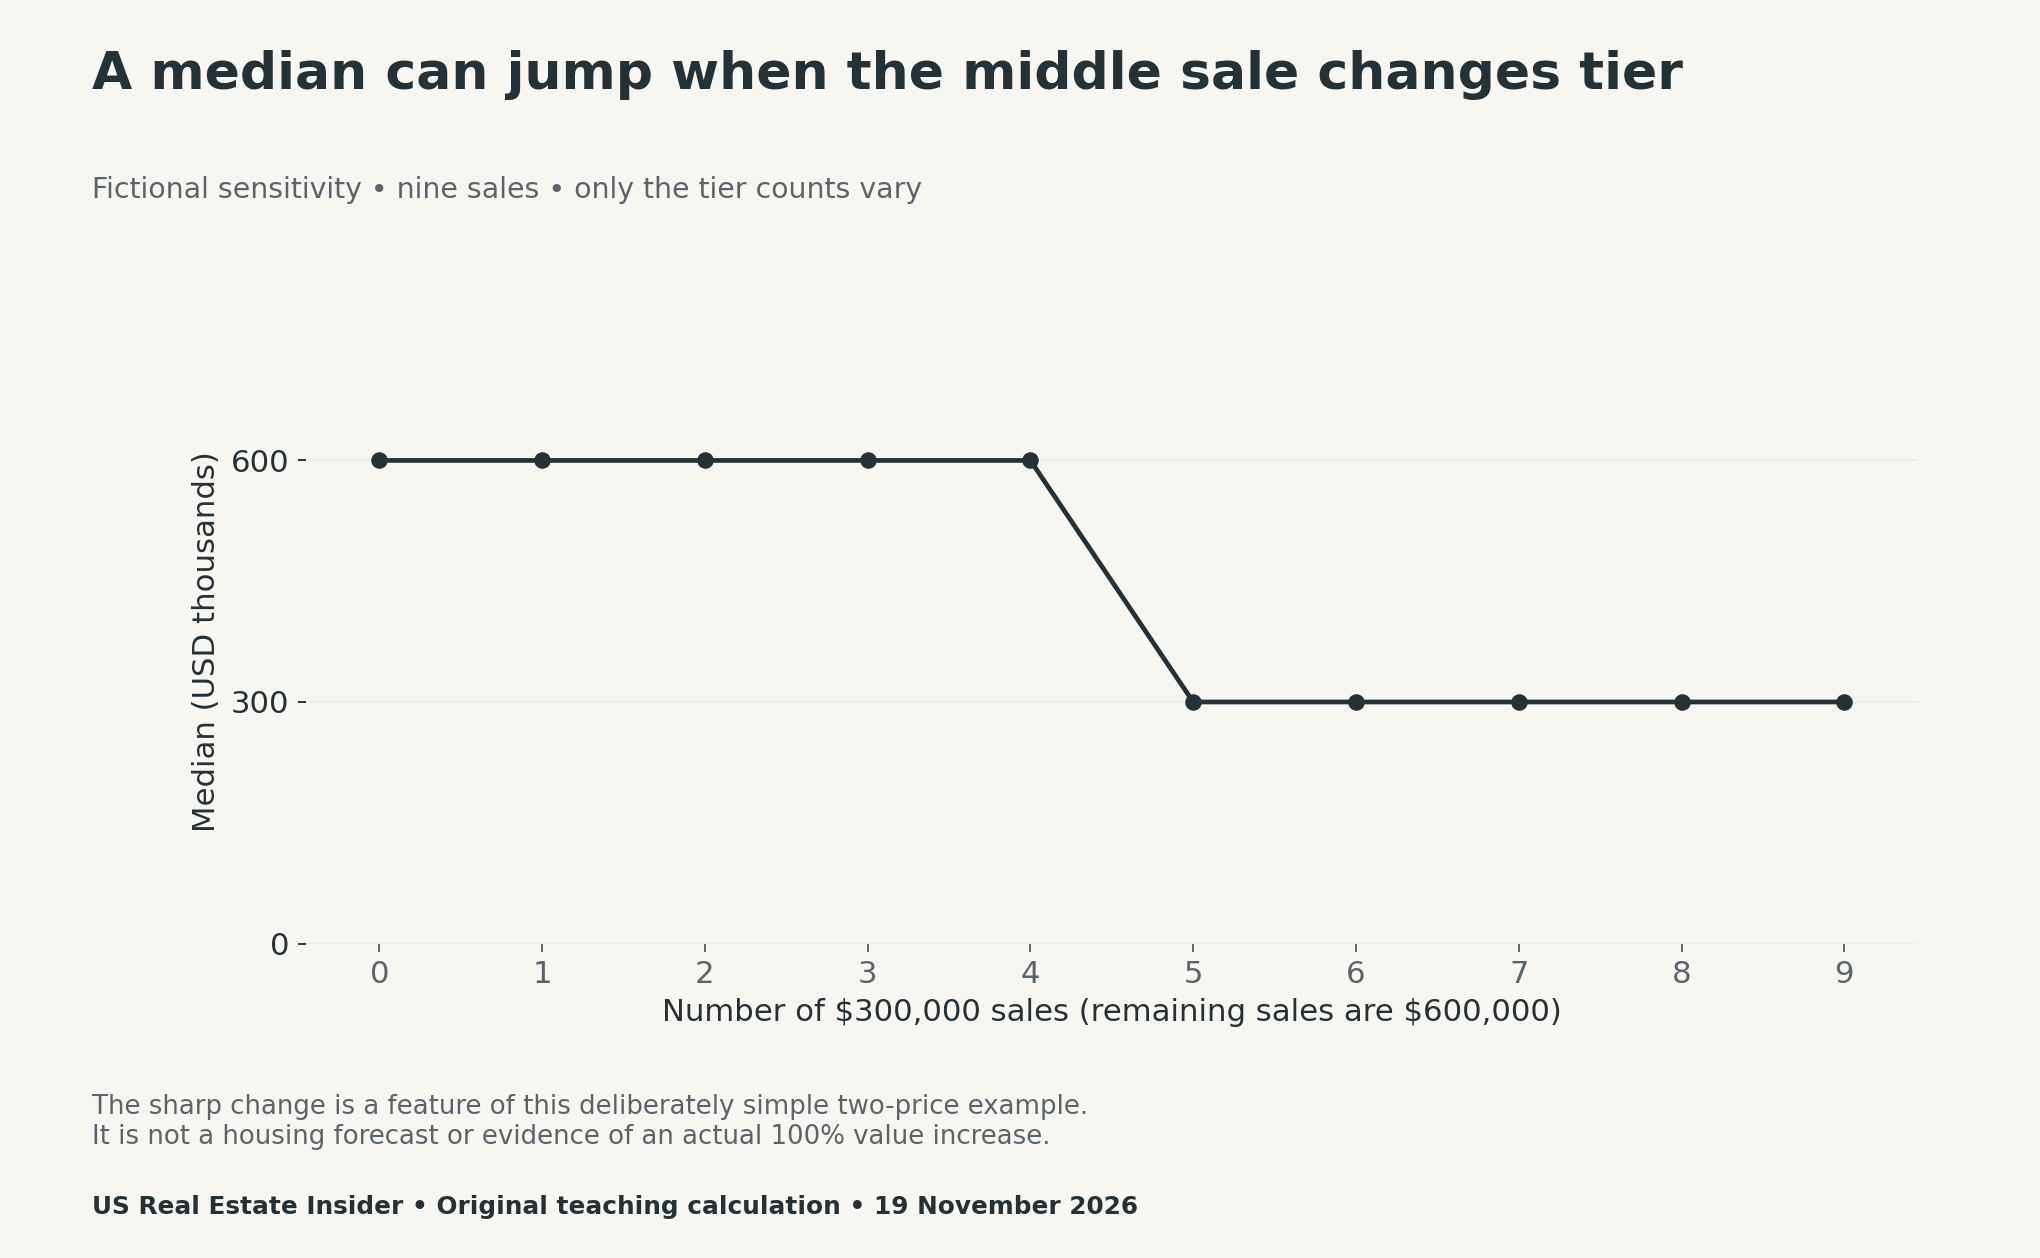
The sensitivity file lists every possible count from zero through nine lower-tier sales. It keeps the total at nine and the two prices unchanged. This makes the mechanism easy to audit: the median changes tier when the lower-price group reaches five sales.
Real sale distributions contain many more price points. As a result, they need not show this exact jump. The example demonstrates why a median can respond to composition; it cannot measure the size, direction or presence of that effect in the October report.
Median home price vs home value: choose the right evidence
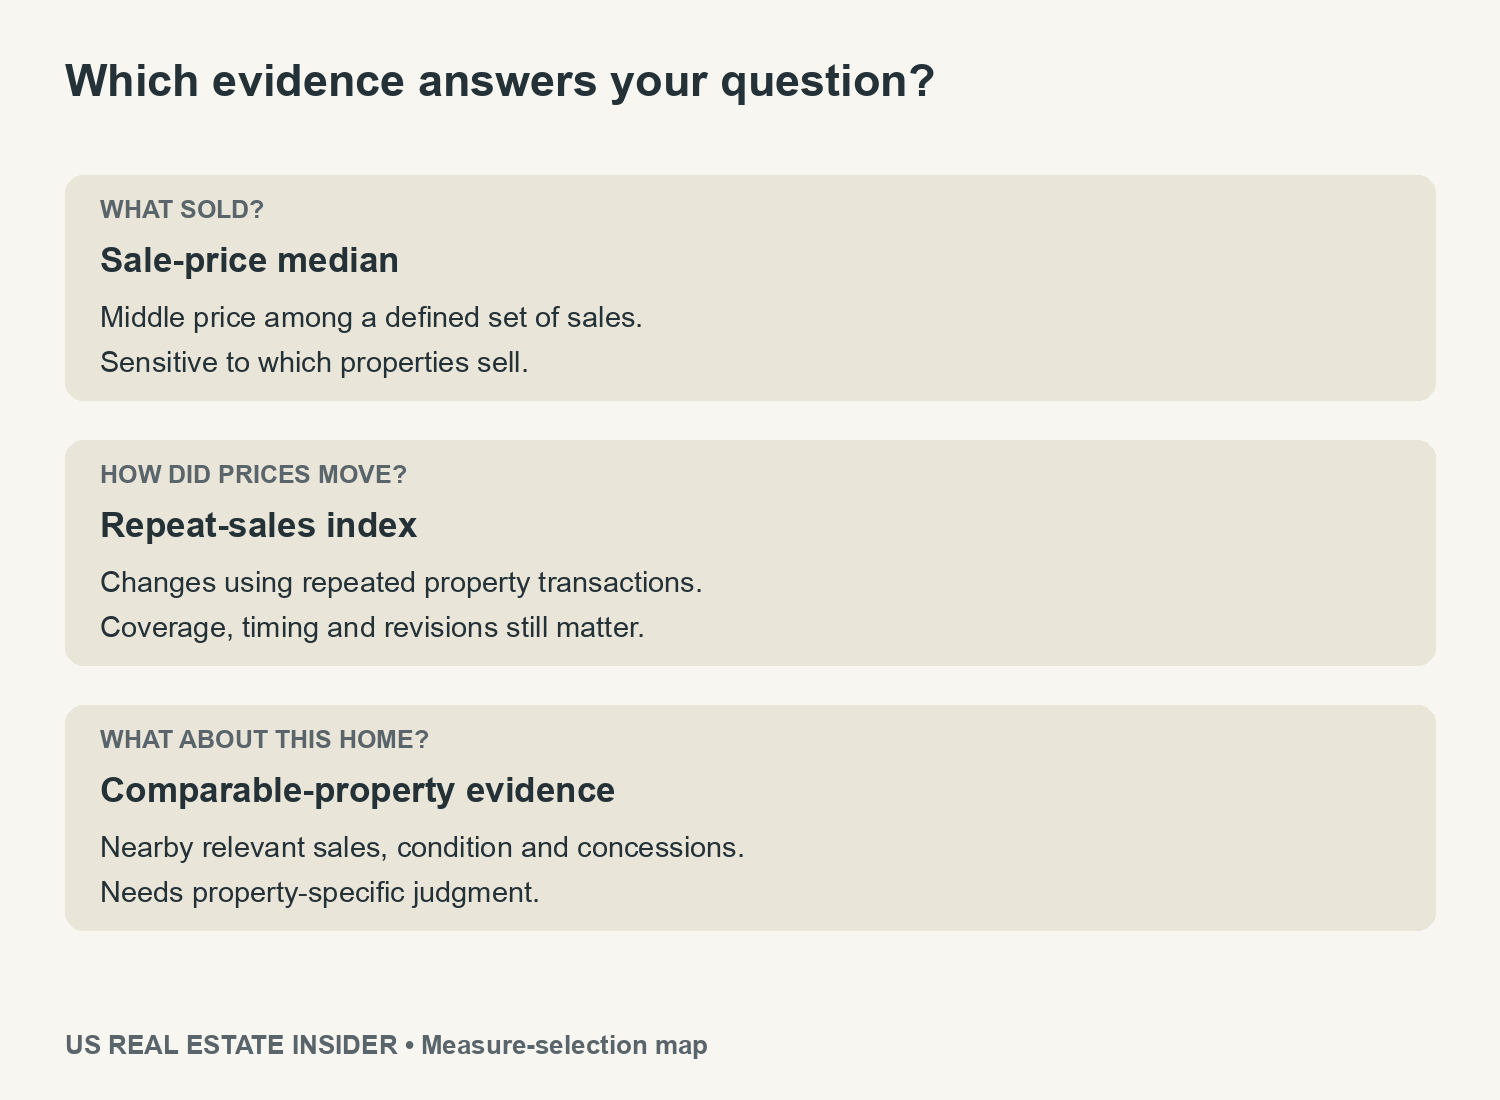
A sale-price median helps describe the transactions in a stated geography and period. Meanwhile, a repeat-sales index uses repeated transactions on the same properties to study change. The FHFA methodology FAQ explains how its weighted repeat-sales procedure helps control sample-quality differences. Its coverage and later revisions still deserve attention.
Neither approach supplies a complete appraisal of an individual house. FHFA’s calculator guidance specifically distinguishes an area-average appreciation calculation from the actual value of a particular home. Condition, improvements and local circumstances can matter. A relevant professional assessment needs property-specific evidence.
Build a comparable-sales evidence file
Start with the property type and a clearly defined local area. Record the source and date for each completed sale. Next, note size, condition, renovations and concessions. Keep asking prices separate from achieved sale prices, and preserve unanswered questions instead of silently filling gaps.
| Evidence field | Why record it? | Avoid this shortcut |
|---|---|---|
| Sale date and source | Establish timing and verifiability | Assuming an old asking price is a current sale |
| Condition and renovations | Identify material differences | Treating similar size as identical quality |
| Concessions | Understand what the stated price includes | Assuming the gross price describes every term |
| Location and property type | Assess relevance to the subject home | Applying the national median as a valuation |
The blank worksheet deliberately has no automatic adjustment percentages. Unsupported precision can make weak comparables look authoritative. Document differences and ask a qualified local professional how to assess them. Revisit the file when a verified new sale changes the available evidence.
Download the source measures and reproducible examples
- Selected October measures with dates, units and source links (CSV)
- Both sorted nine-sale fictional samples (CSV)
- Ten fictional mix scenarios and their medians (CSV)
- Blank comparable-sales evidence worksheet (CSV)
For related measurement pitfalls, read our housing-market attention and returns guide. Our Market Trends archive provides further context for interpreting national and local indicators.
Methodology, reuse and limitations
Research was checked on 19 November 2026. The source ledger retains Homes.com’s publication date, October reference period and selected reported measures. The four charts use original fictional arithmetic; they are not additional market observations. Our script sorts each sample and calculates the median, and the downloads retain all eighteen input rows.
There is no loan-level dataset, property valuation model or causal estimate here. We have not measured the actual sales mix behind October’s national or city medians. The practical finding is narrower: identify what a number measures before using it to make a property-specific decision.


