







Self storage NOI vs FFO can point in different directions because the measures answer different questions. Global Self Storage’s Q3 2026 tables show same-store net operating income falling $12,523 while company-defined funds from operations rose $57,981. Reading the reconciliation explains how both results can be true.
This report is an accounting and operating-data exercise for property owners and analysts. Five charts, a measurement hierarchy and four CSV tools separate observed company results from a fictional cost-sensitivity example. It is one company’s reporting case, not a storage-market benchmark or a recommendation to buy its shares.
Self storage NOI vs FFO: start with period and scope
Global Self Storage’s November 6 release covers the quarter ended September 30, 2026. Its same-store revenue, operating costs and NOI changed by +0.6%, +2.5% and −0.6% year over year. Company FFO rose 5.8%, and adjusted FFO rose 4.7%. These headline percentages are rounded.
The SEC-hosted earnings exhibit corroborates the release and its unaudited tables. Same-store results cover twelve properties; company measures include other accounting items. A shared reporting date does not make the measures interchangeable. Nor does an SEC filing turn an unaudited earnings exhibit into an independent audit.
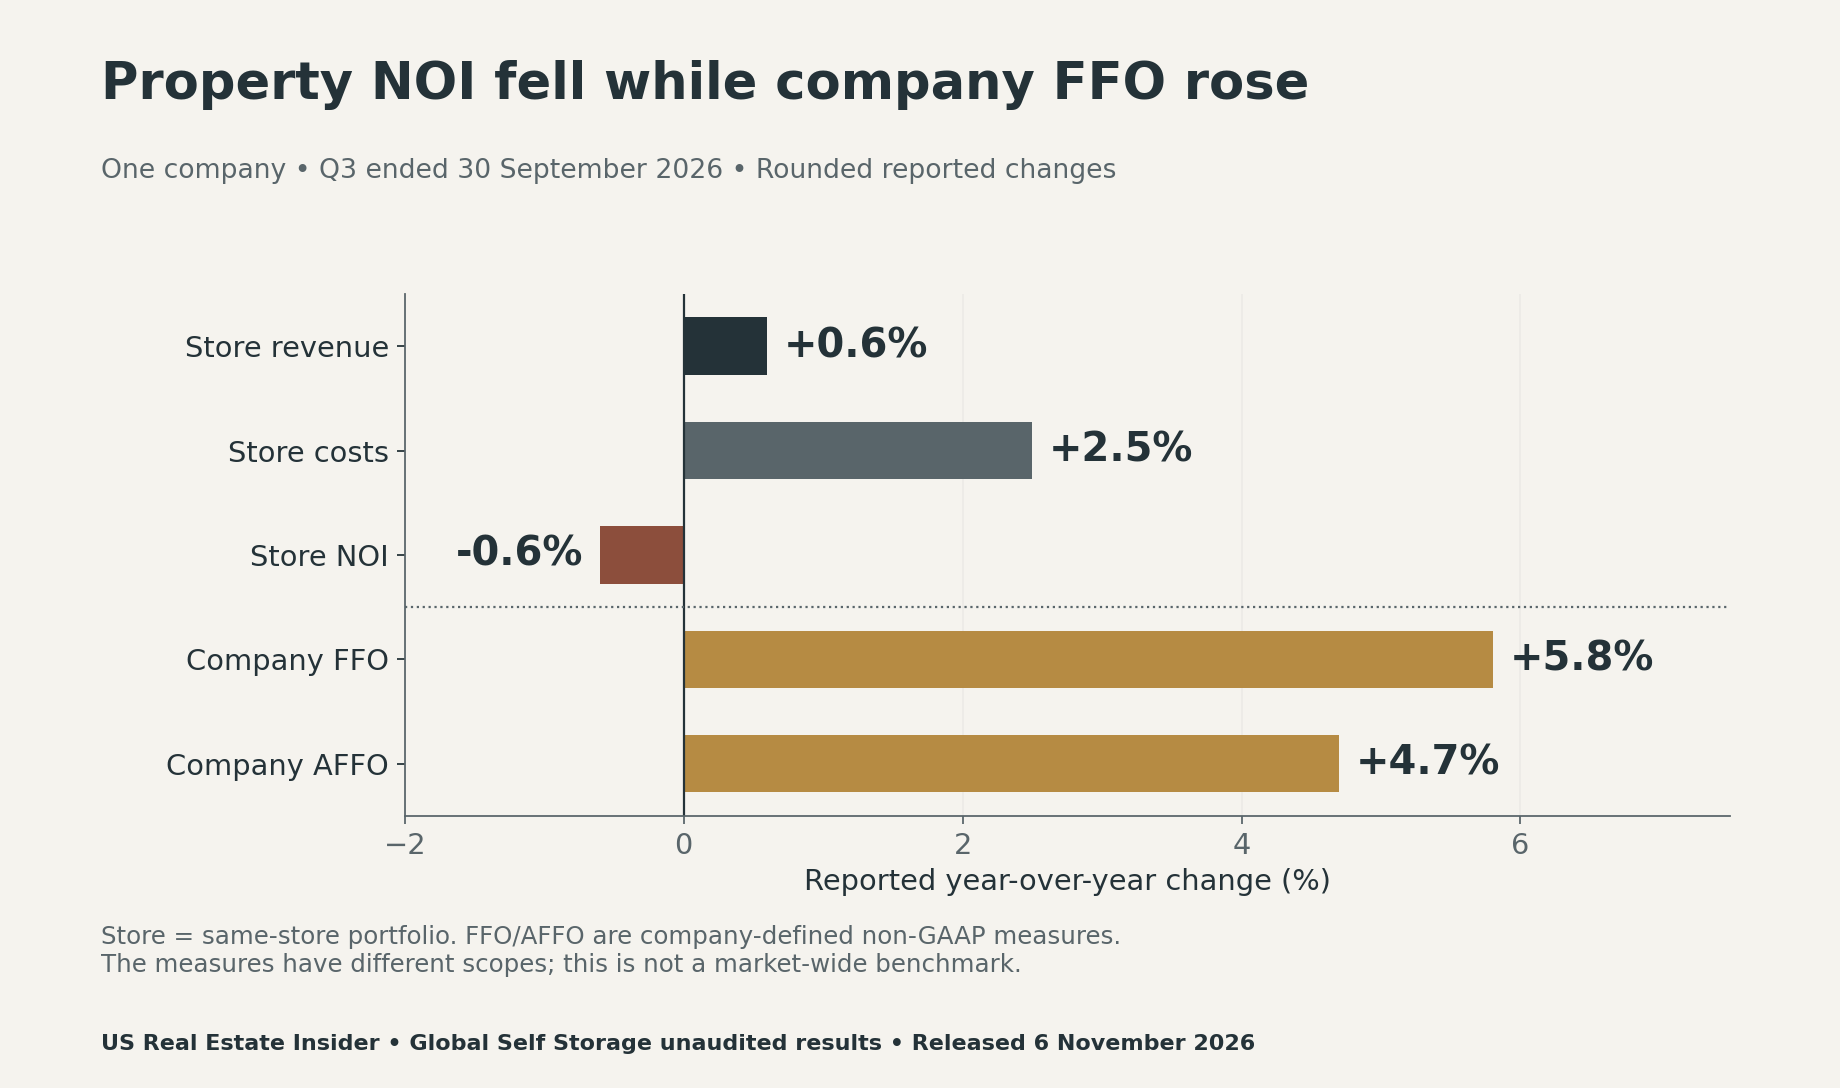
Before comparing another operator, write down the period and portfolio definition beside each measure. An acquisition, sale or stabilisation change can alter the population being measured. A useful comparison starts with matching scope, rather than choosing whichever headline looks strongest.
Rebuild the property NOI change from unrounded dollars
Same-store revenue moved from $3,207,410 to $3,225,940. Costs moved from $1,239,432 to $1,270,485. Subtracting costs from revenue gives NOI of $1,967,978 and $1,955,455. Thus, $18,530 of extra revenue was more than offset by $31,053 of extra costs.
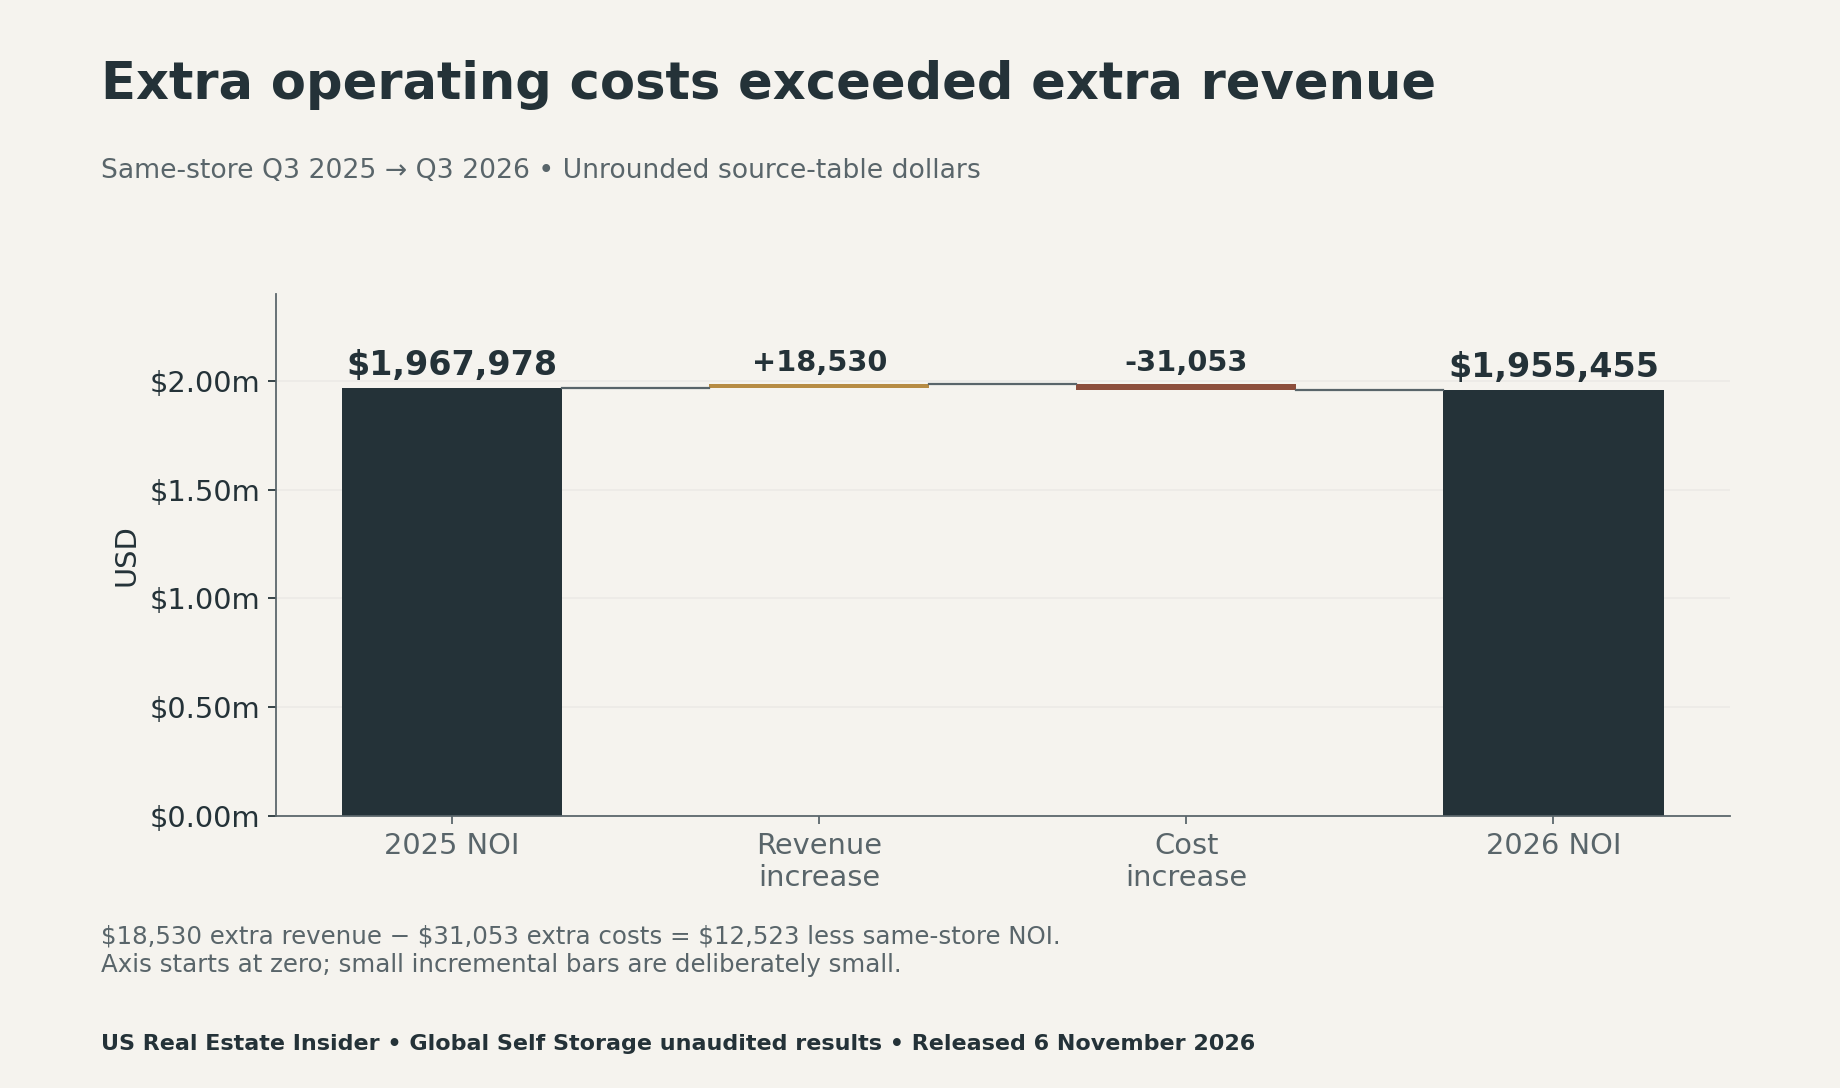
The calculated NOI margins are about 61.36% and 60.62%, using NOI divided by same-store revenue. Their difference is roughly −0.74 percentage points. A margin change in percentage points is different from the percentage change in NOI dollars. Keep those units separate when writing a summary.
The company attributes store-cost pressure primarily to employment costs and real estate property taxes, partly offset by lower marketing expense. That is management’s explanation. Our arithmetic verifies the dollar bridge; it does not independently audit those operational causes or forecast their persistence.
Trace the self storage NOI vs FFO reconciliation
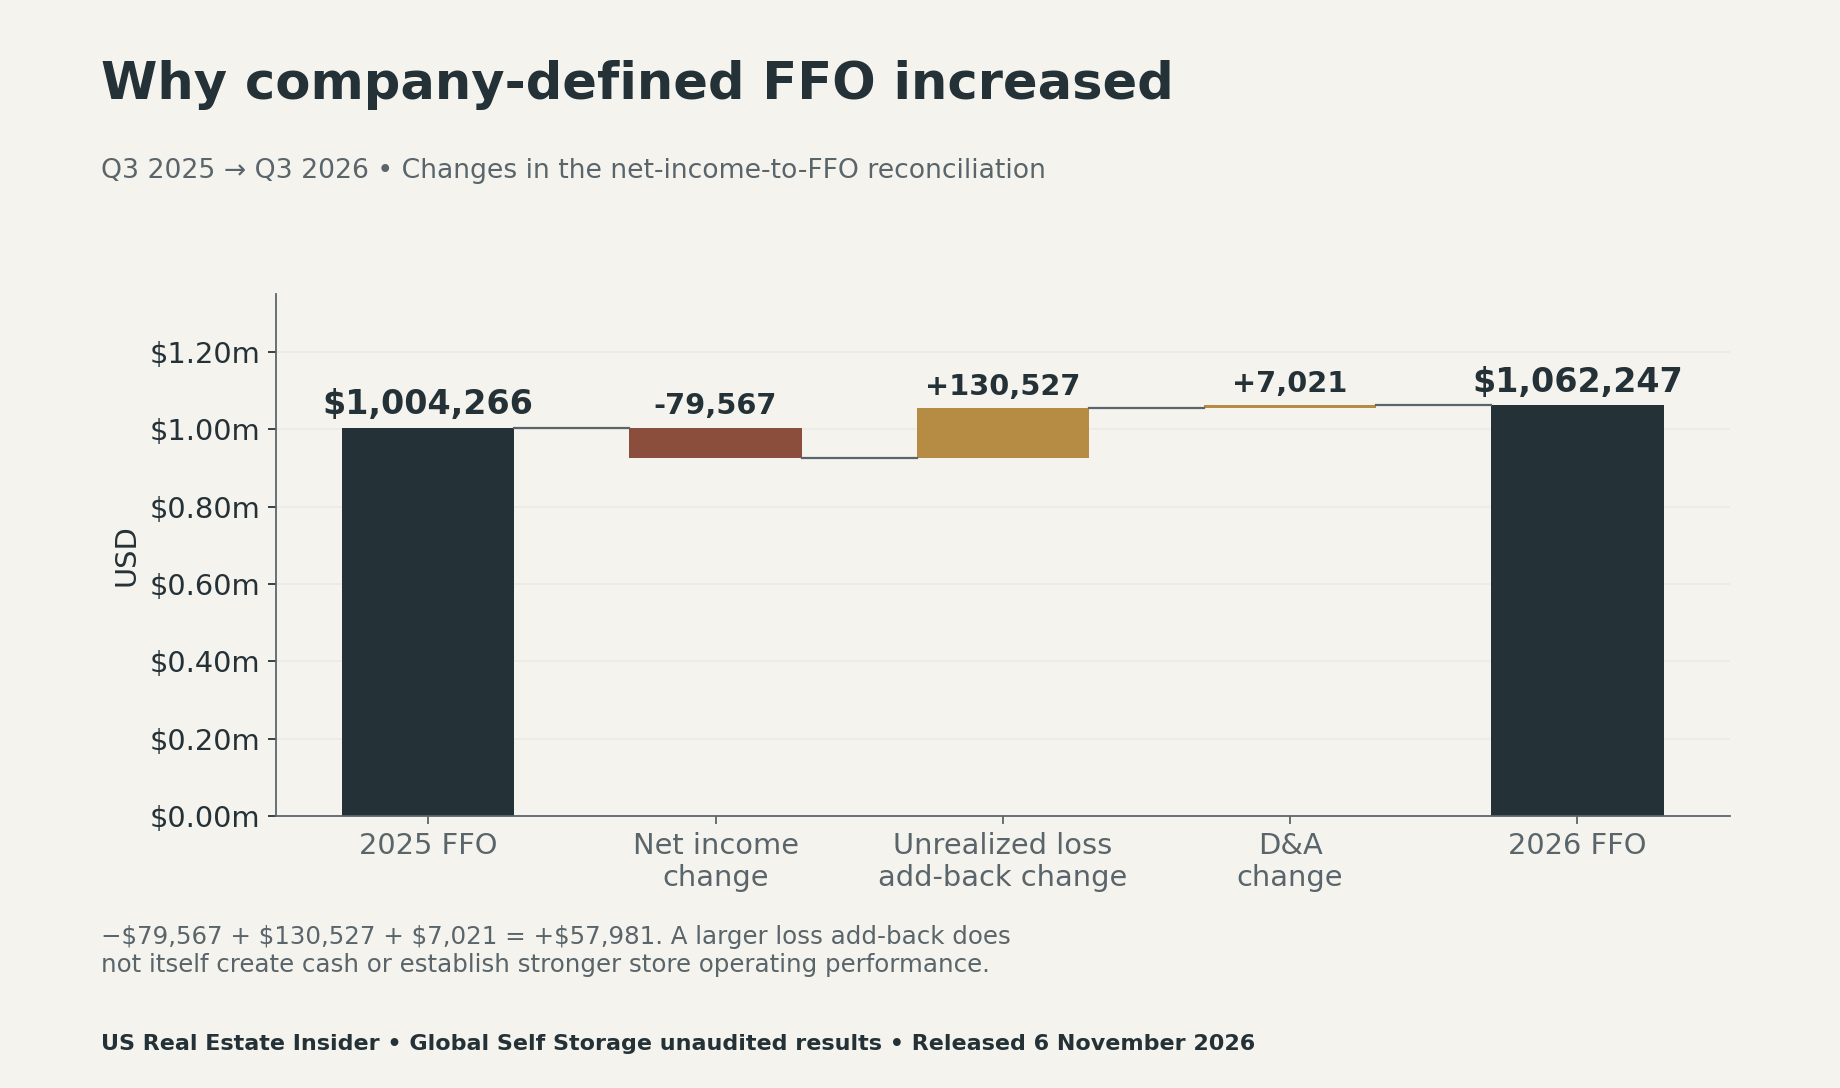
FFO is a supplemental performance measure. Nareit’s FFO guidance provides industry context, but the company’s actual definition and signed reconciliation still matter. In this case, company-defined FFO adds depreciation and amortization and an unrealized securities-loss adjustment to GAAP net income.
For 2026, the reconciliation is $416,692 + $229,231 + $416,324 = $1,062,247. For 2025, it is $496,259 + $98,704 + $409,303 = $1,004,266. Comparing the lines produces −$79,567 in net income, +$130,527 in the loss add-back and +$7,021 in depreciation and amortization. Together, they yield +$57,981 in FFO.
There is another valid route through the same statements. Starting with same-store NOI, add management fees and dividend/interest income, then subtract corporate general and administrative expense, business-development expense and interest expense. The downloadable bridge file reproduces that route for both years. It reaches the same FFO total.
Between the two quarters, lower corporate general and administrative expense contributes $45,728 to that bridge. The absence of the prior $22,286 business-development expense also contributes. These are accounting-line comparisons, not a claim that one management action caused the entire change. The complete signed bridge keeps the offsetting movements visible.
AFFO requires a separate definition and cash-flow check
The company then adds stock-based compensation and business-development expense to its FFO when calculating AFFO. In 2026, $1,062,247 + $86,785 + $0 = $1,149,032. In 2025, $1,004,266 + $70,948 + $22,286 = $1,097,500. The increase is $51,532, which rounds to 4.7%.
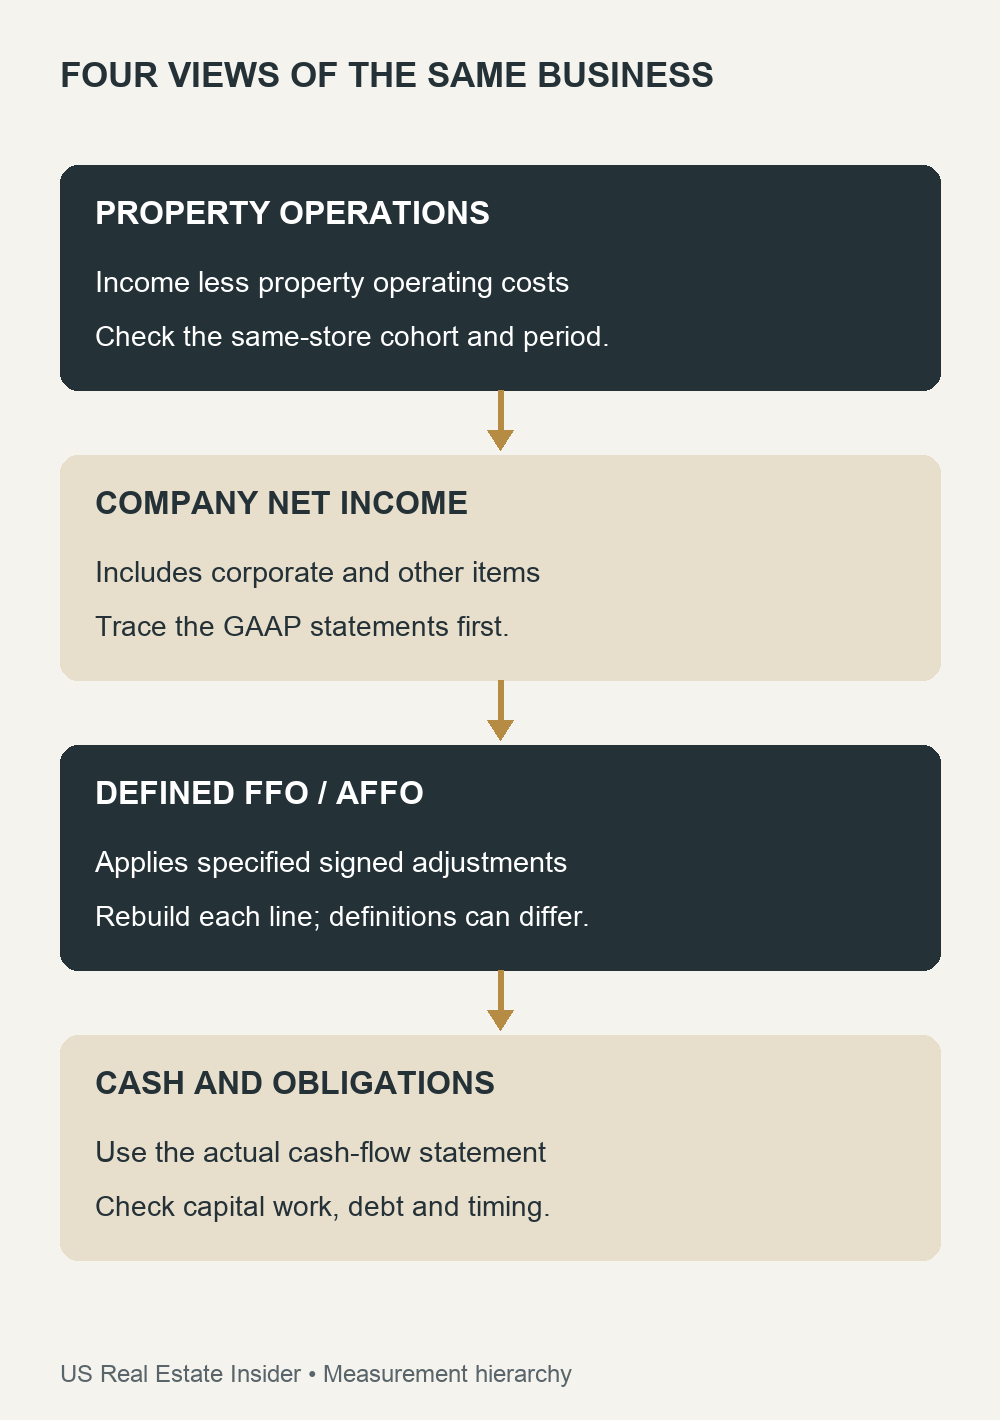
Nareit notes that AFFO has no standardized definition. Therefore, an identically named measure at another REIT can include different adjustments. An add-back also does not erase an item’s economic relevance. Read the actual cash-flow statement, capital spending and debt obligations separately before drawing conclusions about liquidity.
Check the quarter against the longer reporting period
The first-nine-month results change the emphasis. Reported year-over-year NOI, FFO and AFFO growth were −2.8%, −5.9% and −5.1%, respectively. Q3’s positive FFO and AFFO headlines therefore do not describe the whole nine-month period.
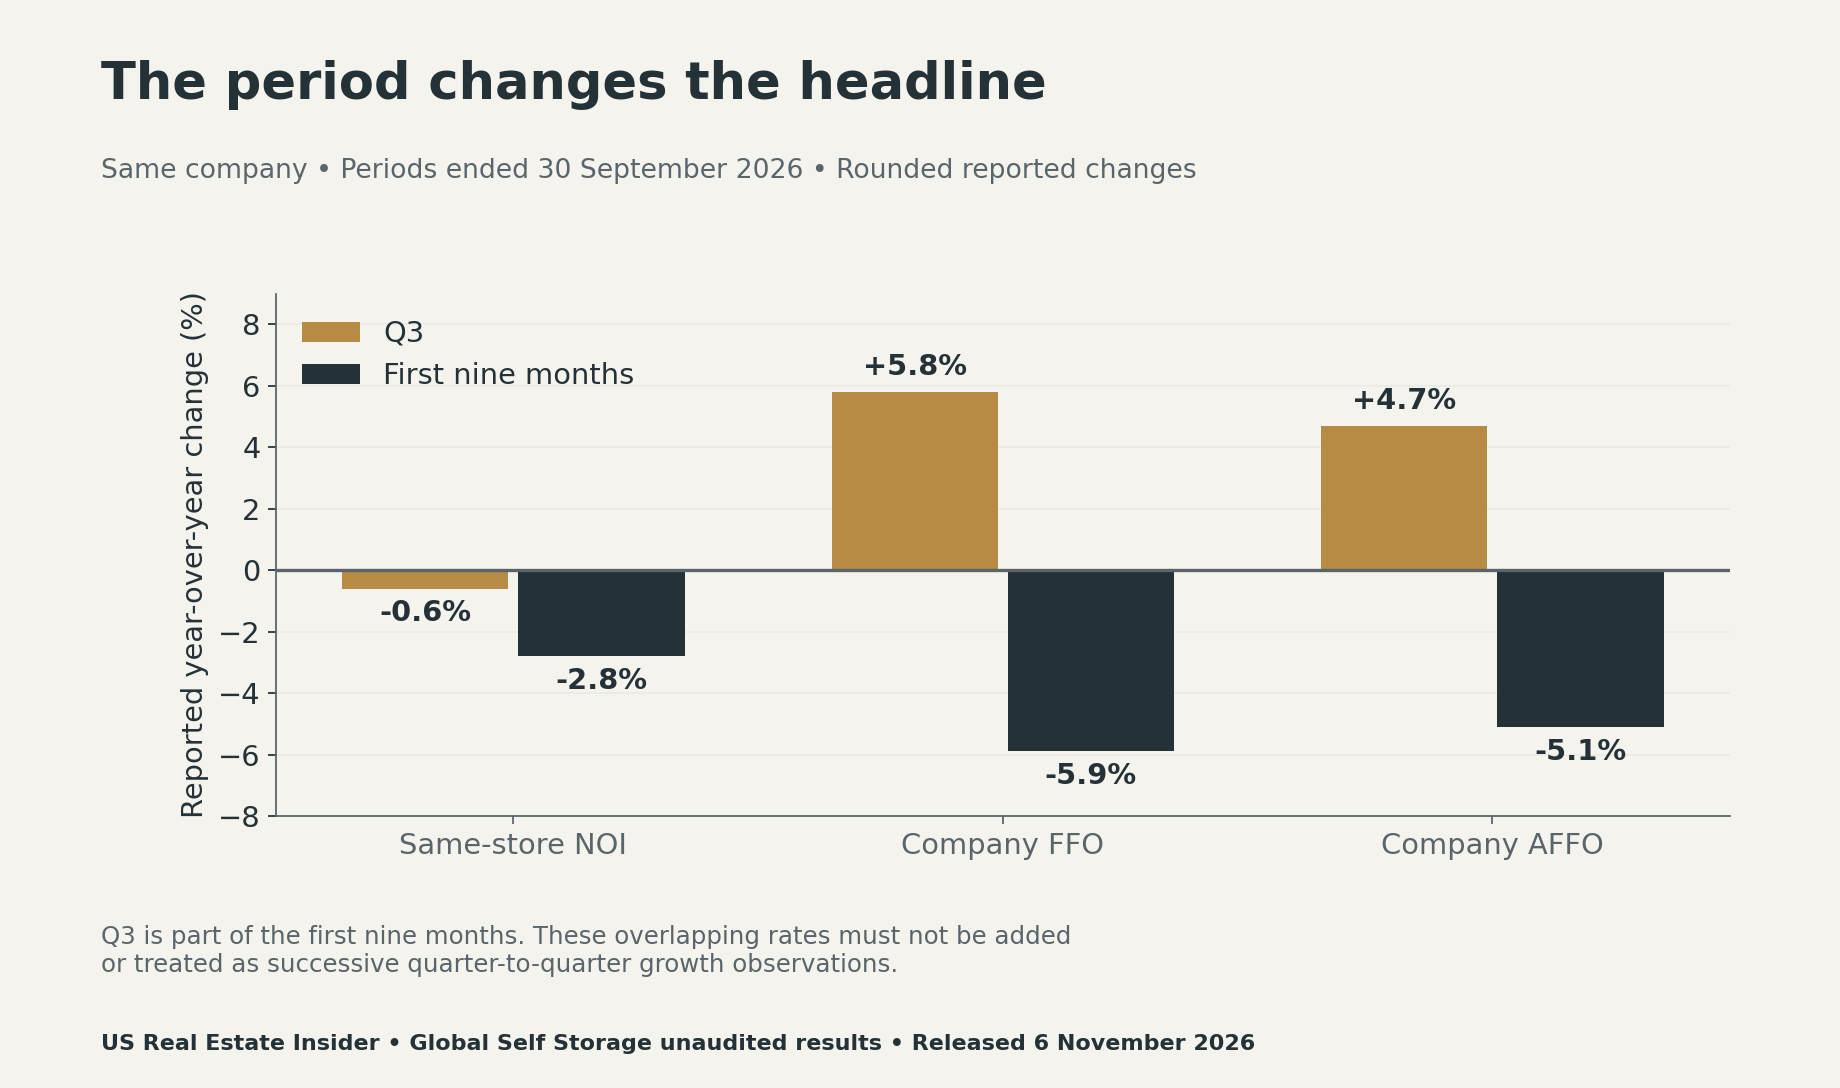
For an operator’s reporting pack, show both the current quarter and year to date, with their matching prior-year periods. Then identify which lines changed and whether the property cohort remained comparable. This makes it harder for a short interval to stand in for a broader trend.
Use a fictional NOI sensitivity test for your own budget
Our separate exercise starts with $100,000 of property income and $60,000 of operating costs, leaving $40,000 of NOI. Assume income rises 0.6%, then change only cost growth. These chosen inputs describe no actual property and are not calibrated to Global Self Storage’s margins.
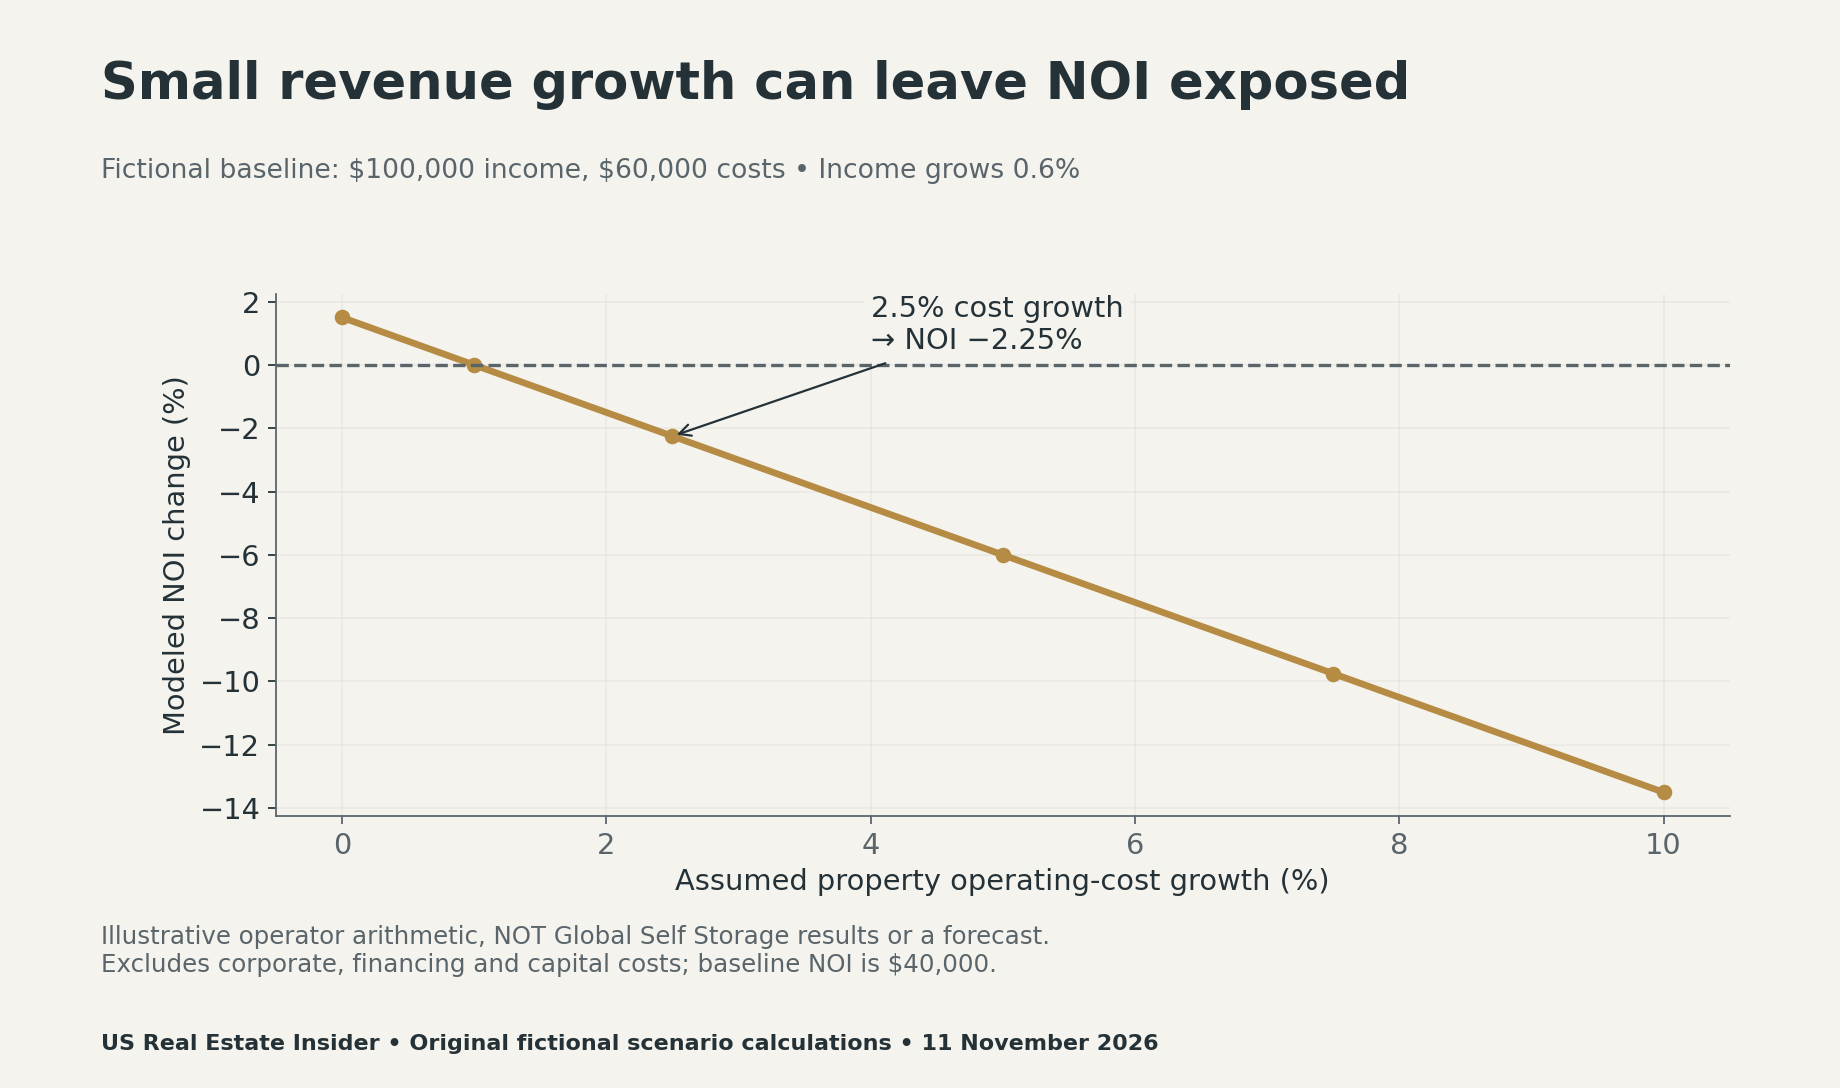
At 2.5% cost growth, income becomes $100,600 and costs become $61,500. NOI is $39,100, down $900 or 2.25%. At 1% cost growth, the $600 income increase exactly matches the $600 cost increase, leaving NOI unchanged. The result depends on the starting cost share, not just the growth-rate labels.
Replace those assumptions with your own consistent property-level accounts. Define which taxes, insurance, staffing and maintenance items belong in operating expenses. Keep capital projects and financing on separate schedules. Otherwise, a changed expense classification can masquerade as improved performance.
Download the source audit and reconciliation tools
- Source-table audit (CSV): quarterly and nine-month dollar values, units, scope and reported-versus-calculated changes.
- Signed reconciliation bridges (CSV): net income to FFO, NOI to FFO, and FFO to AFFO for both years.
- Fictional NOI sensitivity cases (CSV): transparent income/cost assumptions and six modeled outputs.
- Blank operator report audit (CSV): twelve checks for period, cohort, adjustments, cash flow and comparability.
The CSV files preserve values and signed amounts rather than live spreadsheet formulas. For each bridge and year, sum signed_amount_usd and compare it with the expected total. Growth equals (current ÷ prior − 1) × 100. Margin equals NOI ÷ same-store revenue. Calculate with unrounded inputs before rounding the display.
What this reporting case can and cannot tell you
Quarter-end occupancy was 92.9% versus 93.2%, while average tenant stay was approximately 3.7 versus 3.5 years. These are different units and snapshots. Neither high occupancy nor longer tenure alone establishes better profitability, cash collection or investment value. They should prompt questions about rates, costs and the underlying tenant mix.
The evidence is one company’s unaudited reporting, not a representative industry dataset. We verify arithmetic, not the underlying books. NOI, FFO and AFFO do not replace GAAP results, cash-flow analysis, capital needs or a full investment assessment. No stock-price or dividend forecast follows from these charts.
For related measurement checks, see our commercial-property cap-rate stress test and CMBS denominator analysis. The practical next step is to rebuild one complete reporting bridge using dated, clearly scoped accounts before comparing the headline percentages.
Suggested citation: US Real Estate Insider, “Self Storage NOI vs FFO: Read the Q3 Divergence,” November 11, 2026. Company evidence: Global Self Storage Q3 2026 release and SEC exhibit 99.1, November 6. Reconciliations and fictional sensitivity calculations reproduced by US Real Estate Insider.