







The luxury home price threshold is a local entry line, not a universal million-dollar label. In our selected October 2026 examples, a $1 million budget equals about 0.253 times the Bridgeport metro’s entry threshold and 1.391 times Detroit’s. Those ratios describe position against a cutoff. They do not score property quality, value or affordability.
This report turns a new listing-data release into a practical comparison tool. It includes five charts, an interpretation matrix, a budget calculator and four CSV downloads. The aim is to help buyers and relocation advisers ask better local questions before comparing individual homes.
Define the luxury home price threshold before using it
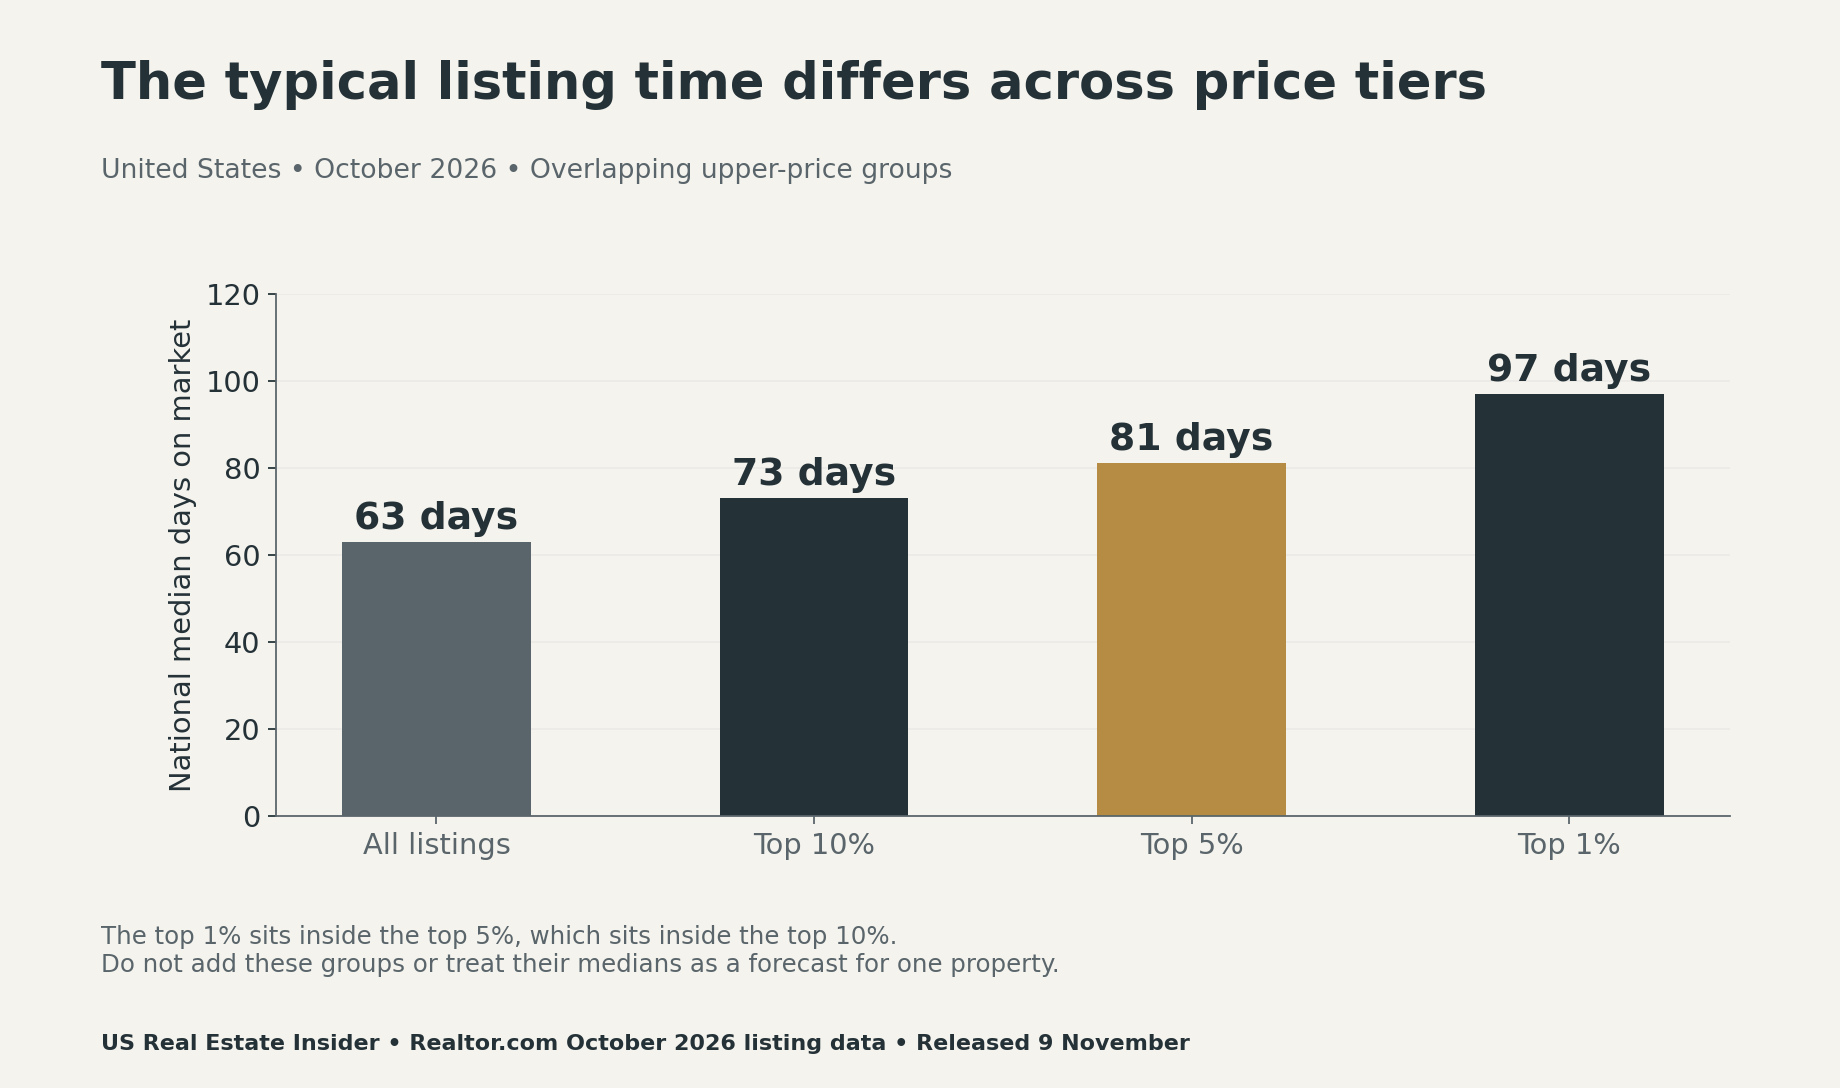
Realtor.com’s report released November 9, 2026 measures October asking-price distributions. Its 90th percentile marks the entry to the top 10%; the 95th and 99th identify narrower upper tiers. National thresholds were $1,197,014, $1,873,040 and $5,125,874, respectively. These are listing measures, not completed-sale prices.
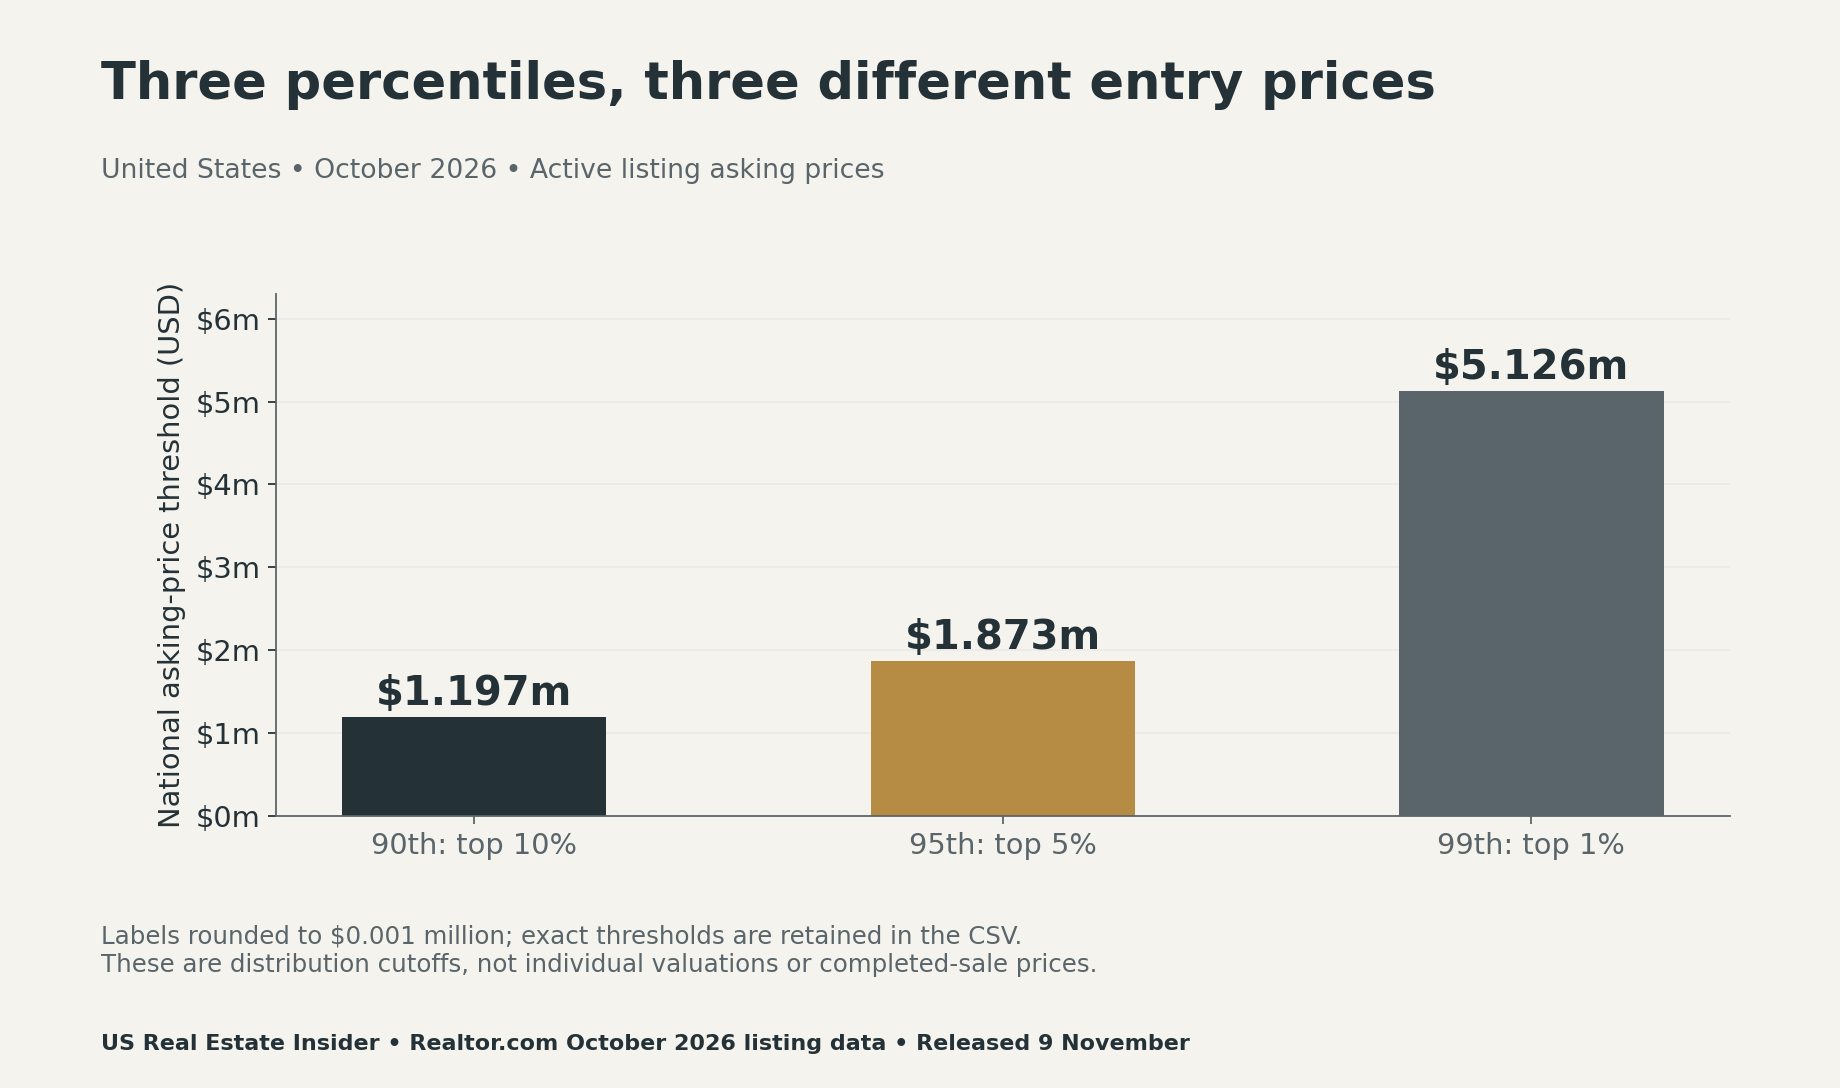
A price cutoff gives a boundary within a particular set of listings. It does not mean every home above it has the same condition, design, location or amenities. Therefore, establish what the number measures before using it to decide where to search.
The upper groups also overlap. A listing in the top 1% is part of the top 5% and top 10%. Adding their shares would count some homes more than once. Similarly, dividing one price threshold by another produces a price multiple, not the share of homes between them.
Compare the luxury home price threshold across local markets
We selected four metros from the report’s expensive-market and rising-threshold tables. The selection illustrates contrasting entry lines; it is not a representative sample or a complete ranking. The October cutoffs were $3,960,000 in Bridgeport-Stamford-Danbury, $3,753,333 in Naples-Marco Island, $1,095,500 in Raleigh-Cary and $719,087 in Detroit-Warren-Dearborn.
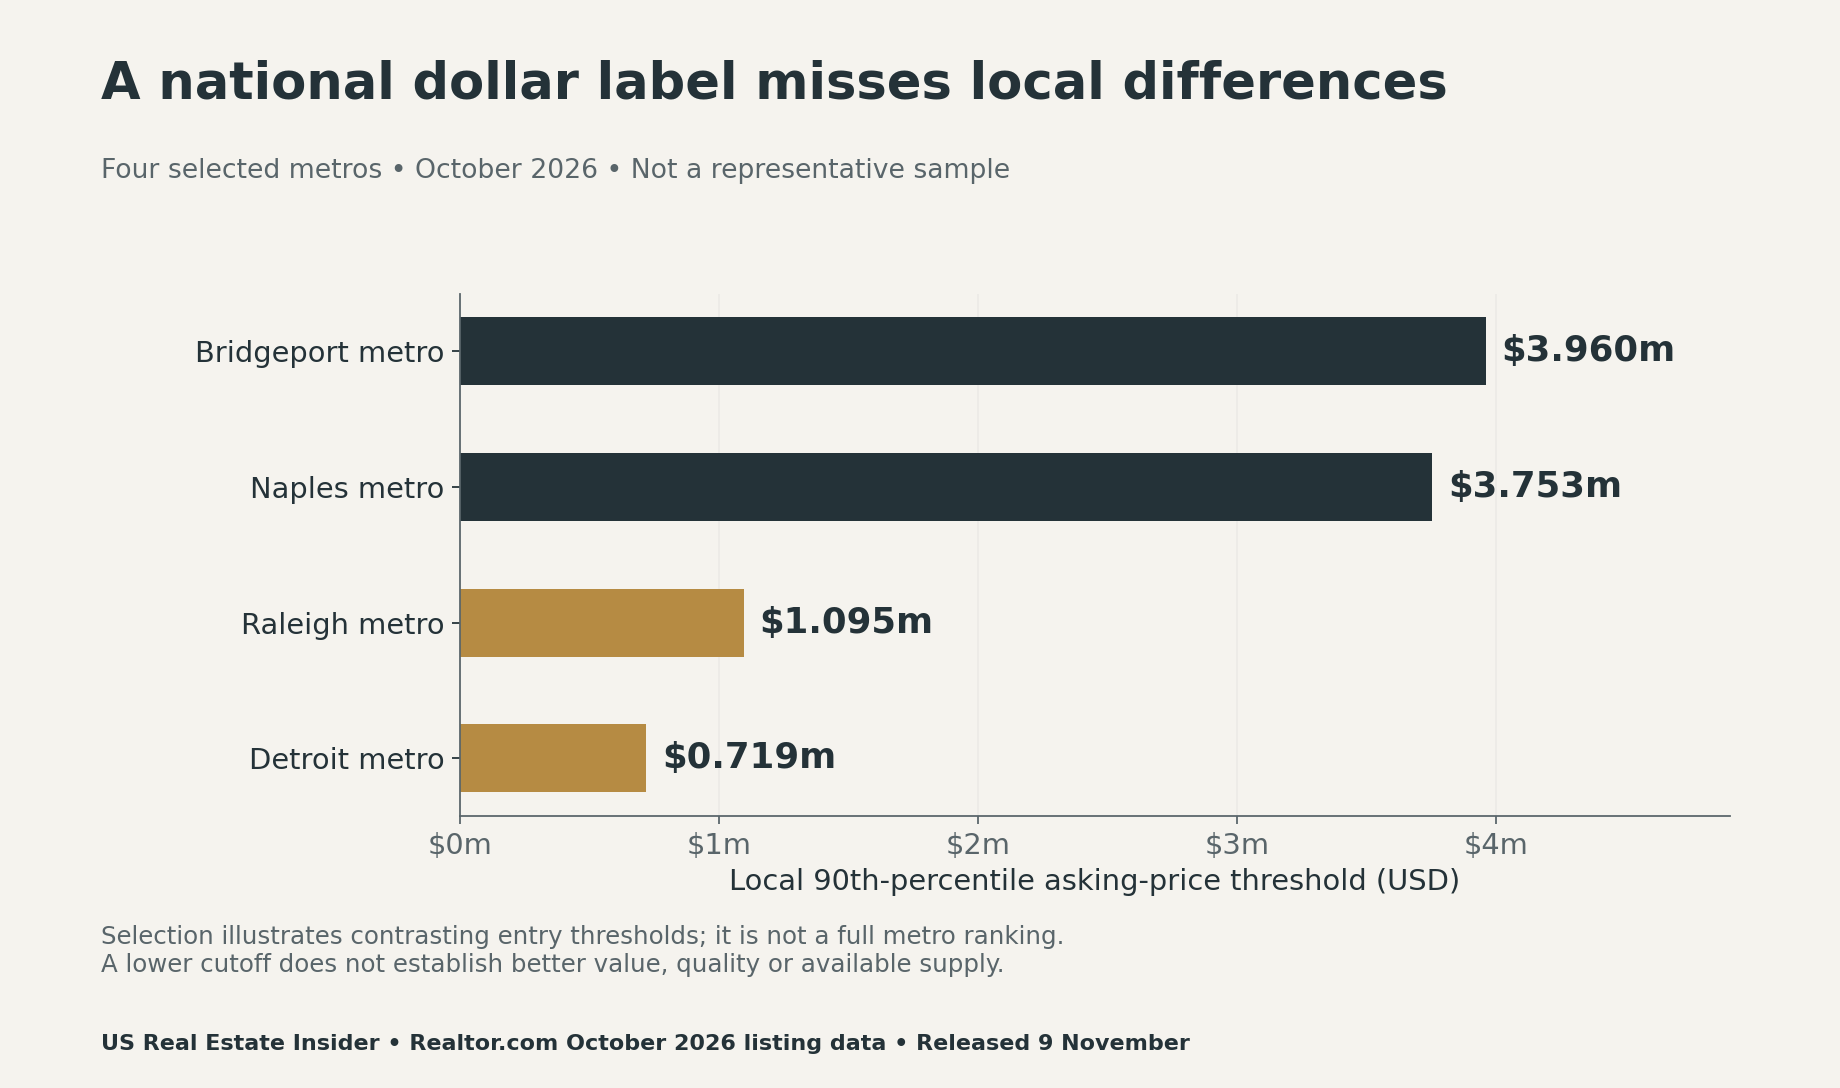
For a relocation comparison, keep the geography attached to each figure. A metro can contain several housing markets with different property types and price ranges. You cannot assume that its cutoff is the right benchmark for a single school catchment, coastal pocket or downtown building.
Next, define the budget consistently. A purchase-price budget is separate from the money needed for closing, repairs and ongoing ownership. If one market’s figure excludes those costs while another includes them, the apparent comparison changes meaning before the arithmetic begins.
Calculate your budget position without inventing a percentile
Our ratio is simple: purchase-price budget ÷ local 90th-percentile asking-price threshold. A result of one means the budget equals that cutoff. Below one, the budget is below it; above one, the budget exceeds it. The calculation does not locate the budget’s exact percentile within the distribution.
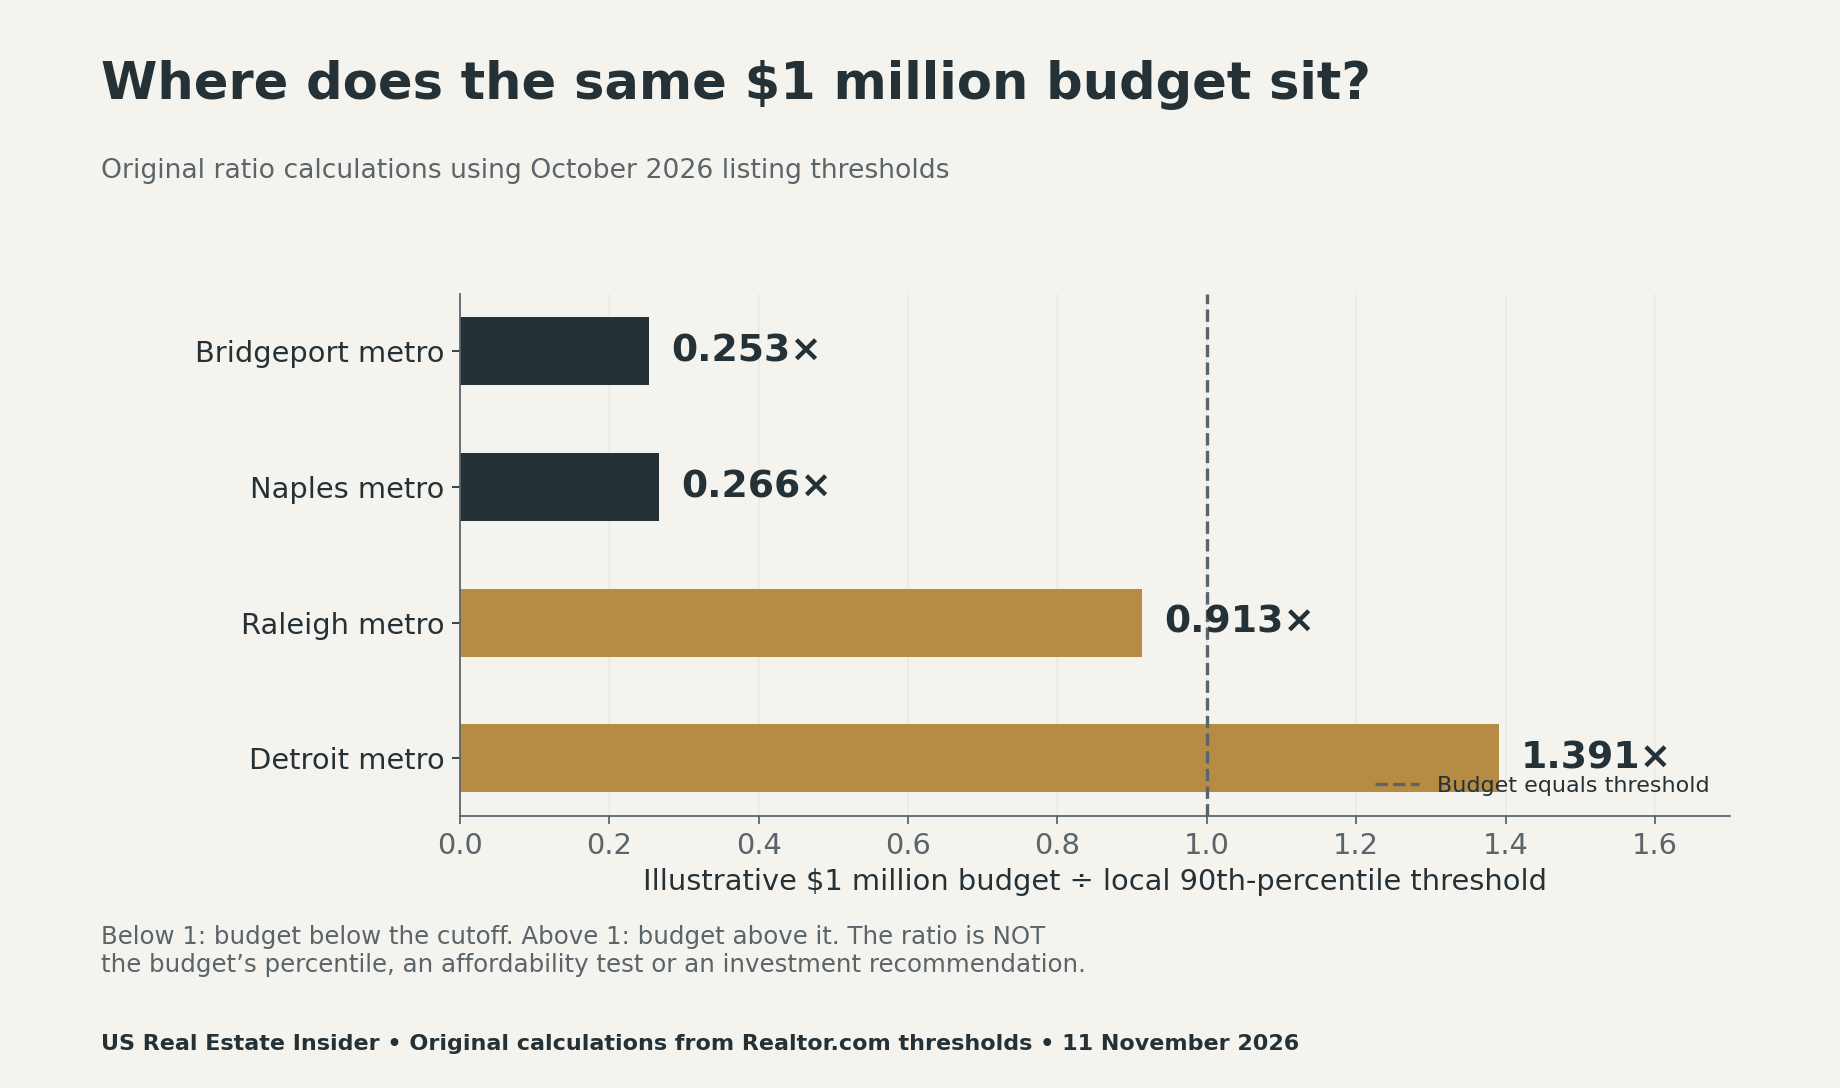
For example, $1,000,000 ÷ $1,095,500 = 0.912825 in Raleigh. The dollar gap is −$95,500. Relative to the cutoff, the budget is about 8.72% below it. Neither result says that the buyer is in the 91st percentile or should increase the budget.
In Detroit, the same division gives about 1.390652. The budget is $280,913 above the selected cutoff, or about 39.07% above it. That does not establish a bargain. Actual listings may differ in condition, carrying costs, availability and features that matter to the buyer.
Try the budget-to-threshold calculator
Enter a non-negative purchase-price budget and choose one of the four selected metros. The tool uses the fixed October 2026 cutoff shown in Figure 2. It does not fetch current listings or estimate borrowing capacity. All amounts are US dollars.
Fixed source: Realtor.com October 2026 luxury report. Position comparison only; no exact percentile, property valuation, inventory count or affordability finding.
You can also test $2 million or $3 million using the scenario CSV. Those amounts are illustrative budgets, not recommended spending levels. Keep the same reference month when comparing the ratios, and obtain a newer cutoff when the underlying release changes.
Read threshold changes and listing time separately
Among three selected metros with both fields, annual entry-threshold changes and top-decile listing-time medians were Naples +9.0% and 100 days, Raleigh +4.3% and 88, and Detroit +1.0% and 56. Bridgeport’s annual change was −6.8%, but its pace field is missing from the selected table; we do not fill it in.
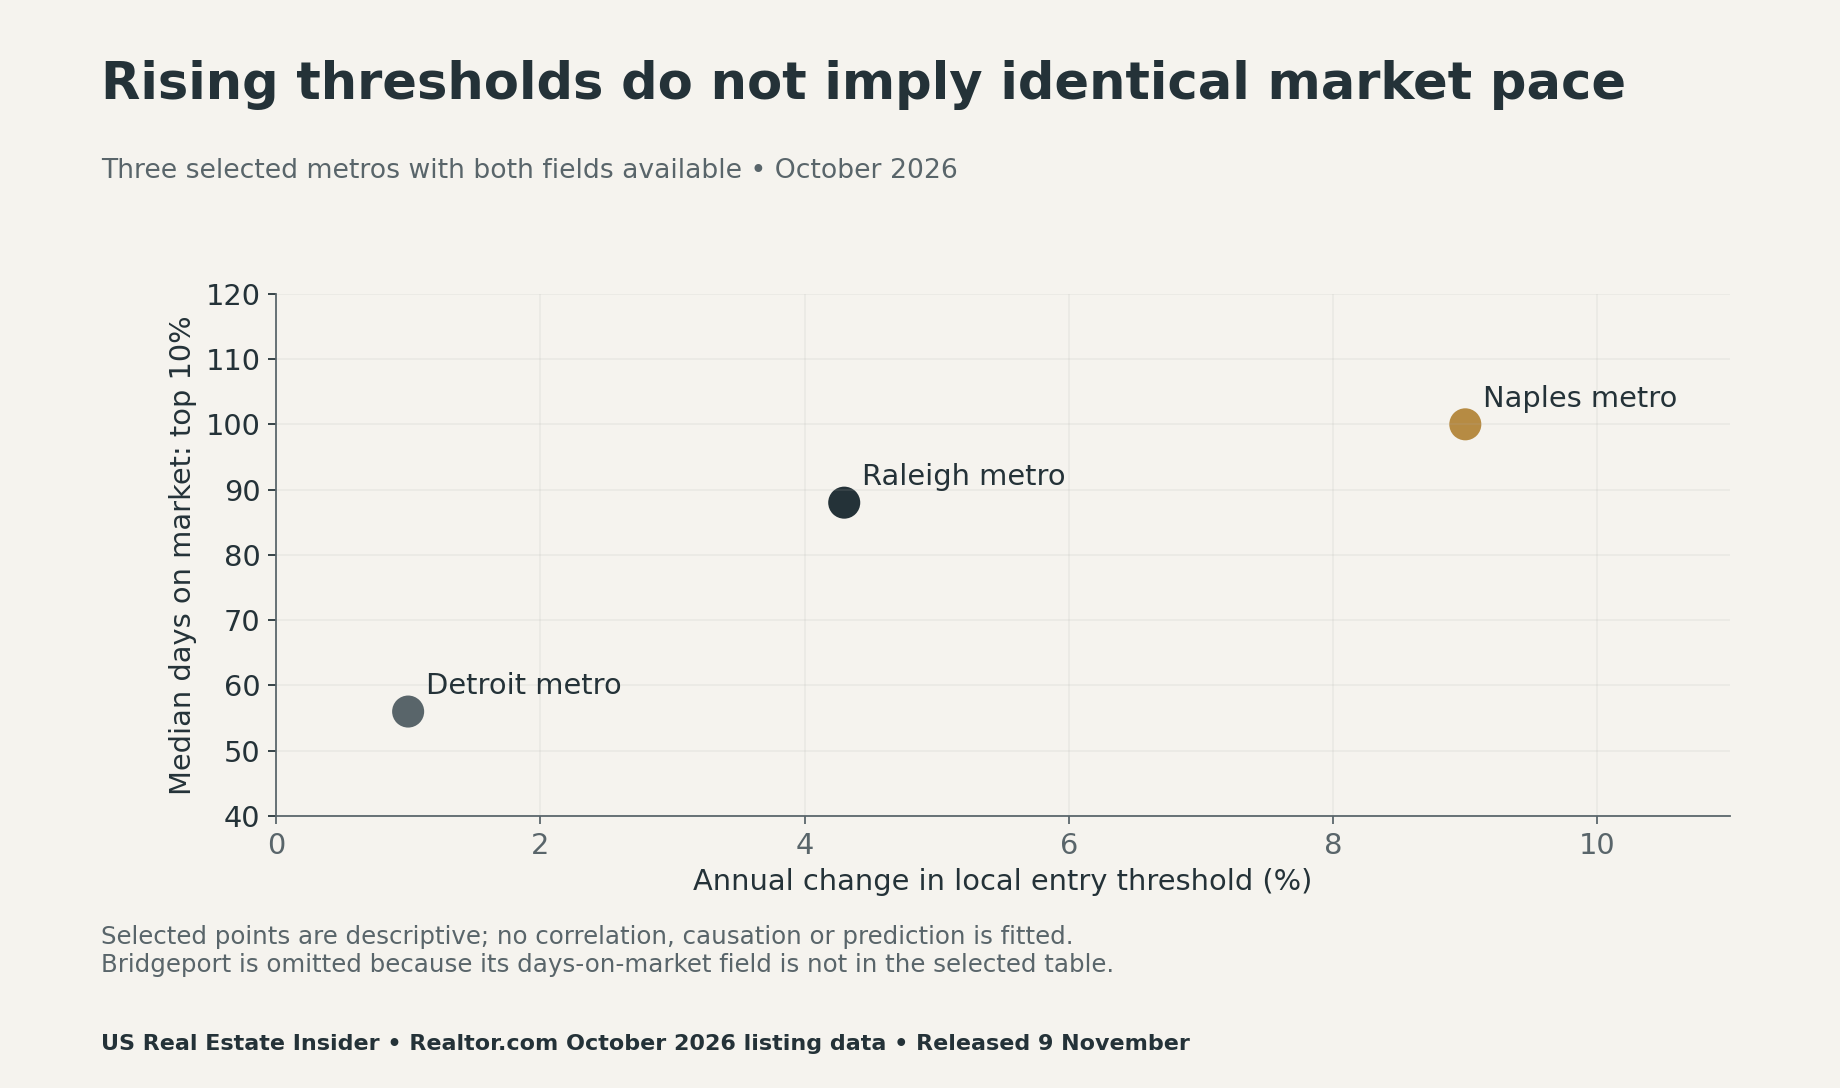
A rising cutoff can coincide with a longer or shorter wait among the listings offered. More expensive homes entering the sample can move the cutoff even if no owner gains value on the same property. For that reason, avoid interpreting threshold growth as an investment return.
Keep each measure in its proper decision lane
Our interpretation matrix separates an entry cutoff, a budget ratio and a listing-time median. Each supports a useful question, but none replaces an inspection, a complete ownership budget or recent comparable sales. Use the matrix to identify the next piece of evidence you need.
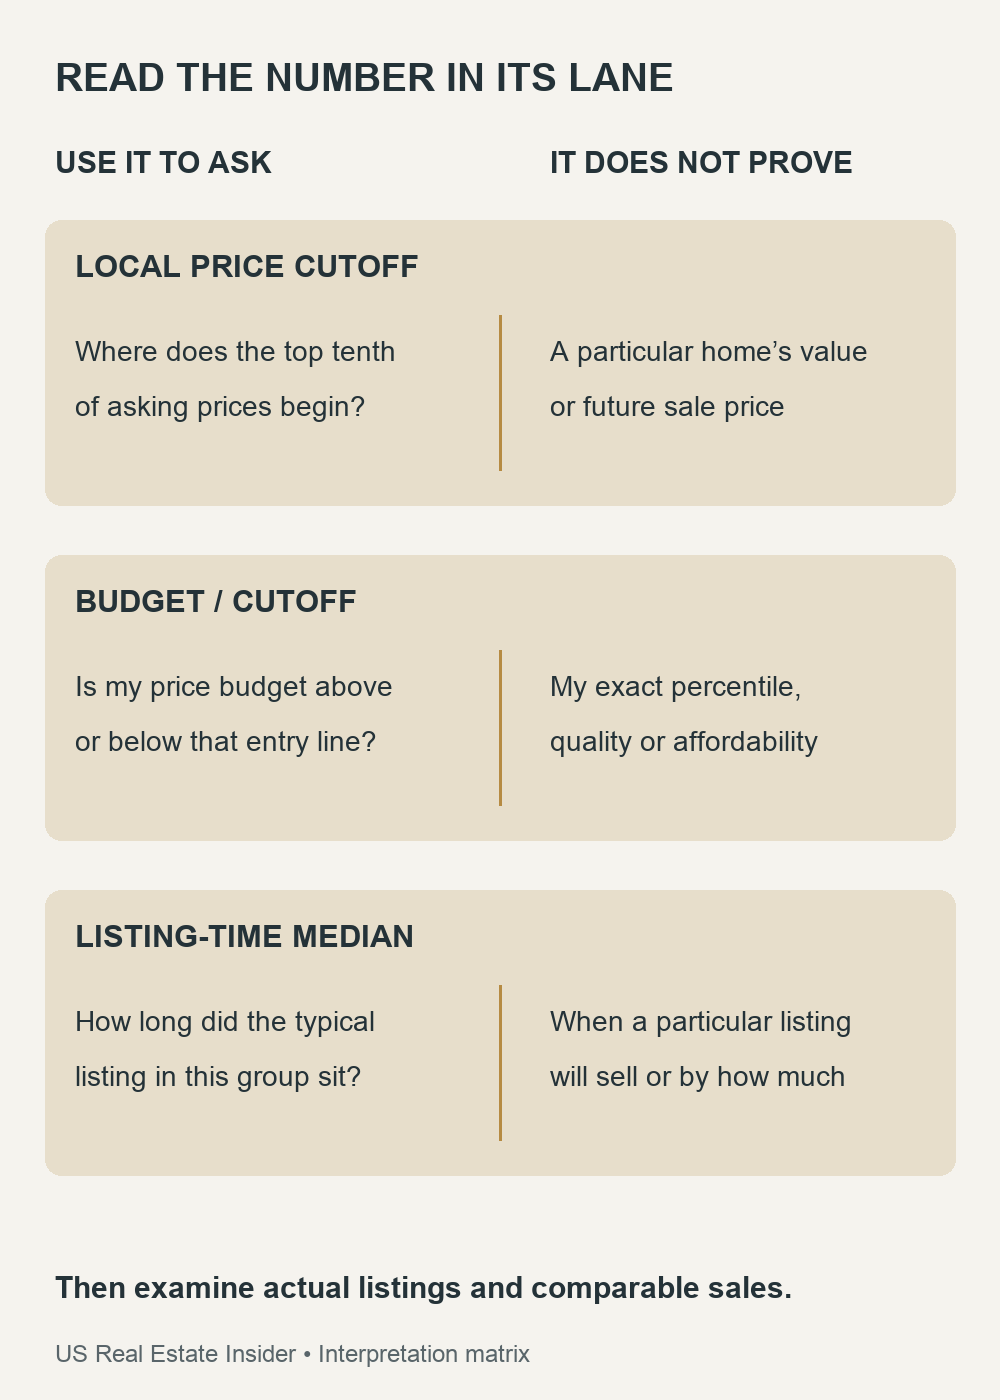
If a ratio is below one, search for real listings that meet the budget and the buyer’s requirements. If it is above one, inspect what the extra spending would buy. The cutoff alone cannot tell you whether a suitable home exists today or whether its asking price is reasonable.
Download the data and comparison worksheet
- National tier source data (CSV): exact thresholds, annual changes and listing-time medians.
- Selected metro source data (CSV): four named examples, selection notes and the unfilled missing pace field.
- Budget-position calculations (CSV): twelve combinations of selected markets and illustrative budgets, including ratios and signed gaps.
- Blank market and property worksheet (CSV): checks for geography, period, property mix, ownership costs and comparable sales.
The CSVs contain values rather than automatic spreadsheet formulas. To reproduce a row, divide its budget by its threshold. For the relative gap, subtract one from that ratio and multiply by 100. For the dollar gap, subtract the threshold from the budget. Calculations use full precision; displayed ratios round to three decimals in charts and six in the calculator.
Method, coverage and a practical next step
The source covers MLS-fed active asking prices. Market analysis is restricted to 43 metros averaging at least 500 million-dollar listings during the preceding twelve months. Our four examples are selected illustrations, and the national row stays separate from metro comparisons. We do not invent missing values or rank markets outside that coverage.
The report is a screening exercise. It excludes financing, taxes, insurance, fees, maintenance, transaction costs and buyer-specific needs. A threshold can change with listing mix. A ratio above one neither establishes affordability nor values a property; a lower or falling cutoff does not by itself create a good purchase.
For the next stage, see our price-index versus median-price explainer and condo ownership-cost comparison. Build a shortlist of actual homes, collect property-specific costs and ask a qualified local adviser about relevant completed-sale comparables.
Suggested citation: US Real Estate Insider, “Luxury Home Price Threshold by Metro: Compare Your Budget,” November 11, 2026. Source data: Realtor.com October 2026 Luxury Housing Report, released November 9. Budget ratios and interpretation tools are our original calculations and editorial framework.