







Rental AVM accuracy needs more than one headline number. ATTOM’s November 3, 2026 announcement reports a 5.9% median absolute error for homes before they are listed for rent. That is a vendor-reported result, not our independent test. It does not mean every estimate falls within 5.9%, nor does it establish the size of the largest misses. Before relying on a rent estimate, check the benchmark, the testing population and the error distribution.
Research date: November 7, 2026. Our contribution is an original, reproducible metric lesson: five fictional properties, a tail-sensitivity exercise, three charts, a benchmark comparison infographic and four CSV tools. Every numerical teaching example below is synthetic. None contains ATTOM property-level predictions or validation records.
What the rental AVM accuracy announcement actually says
The ATTOM announcement describes estimates for nearly 100 million U.S. single-family homes, condos and townhouses. It reports roughly 40% broader coverage and a 5.9% median error before rental listing. The company says it trains and benchmarks the model on cleaned rental listings and supplies low and high values with estimates. These are the provider’s statements; we have not audited its test sample.
Coverage and error are separate measures. A product can produce more estimates without a coverage figure telling you how accurate those additional estimates are. Likewise, a national median does not provide a local-market error rate. Do not turn the complement of 5.9% into a claim of “94.1% accuracy.” Percentage error is not a pass-or-fail classification score.
The current product page describes monthly market-rent estimates and monthly updates. It also explains that lease transactions are generally private and that observed listings underpin its benchmark. A fresh model update can be useful, but update frequency does not establish independent validation or prove that a particular estimate matches the eventual lease.
Calculate the error before interpreting the median
For our teaching example, define absolute percentage error as the absolute difference between estimated and reference rent, divided by the positive reference rent, multiplied by 100. This is the formula for our worksheet. We do not claim access to every implementation detail behind the vendor’s published statistic.
Imagine five properties with a reference rent of $2,000 a month each. Their fictional estimates are $2,040, $2,080, $2,118, $2,400 and $2,800. The corresponding absolute percentage errors are 2%, 4%, 5.9%, 20% and 40%. For property C, the dollar error is $118; $118 divided by $2,000 is 0.059, or 5.9%. The denominator is reference rent, not estimated rent.
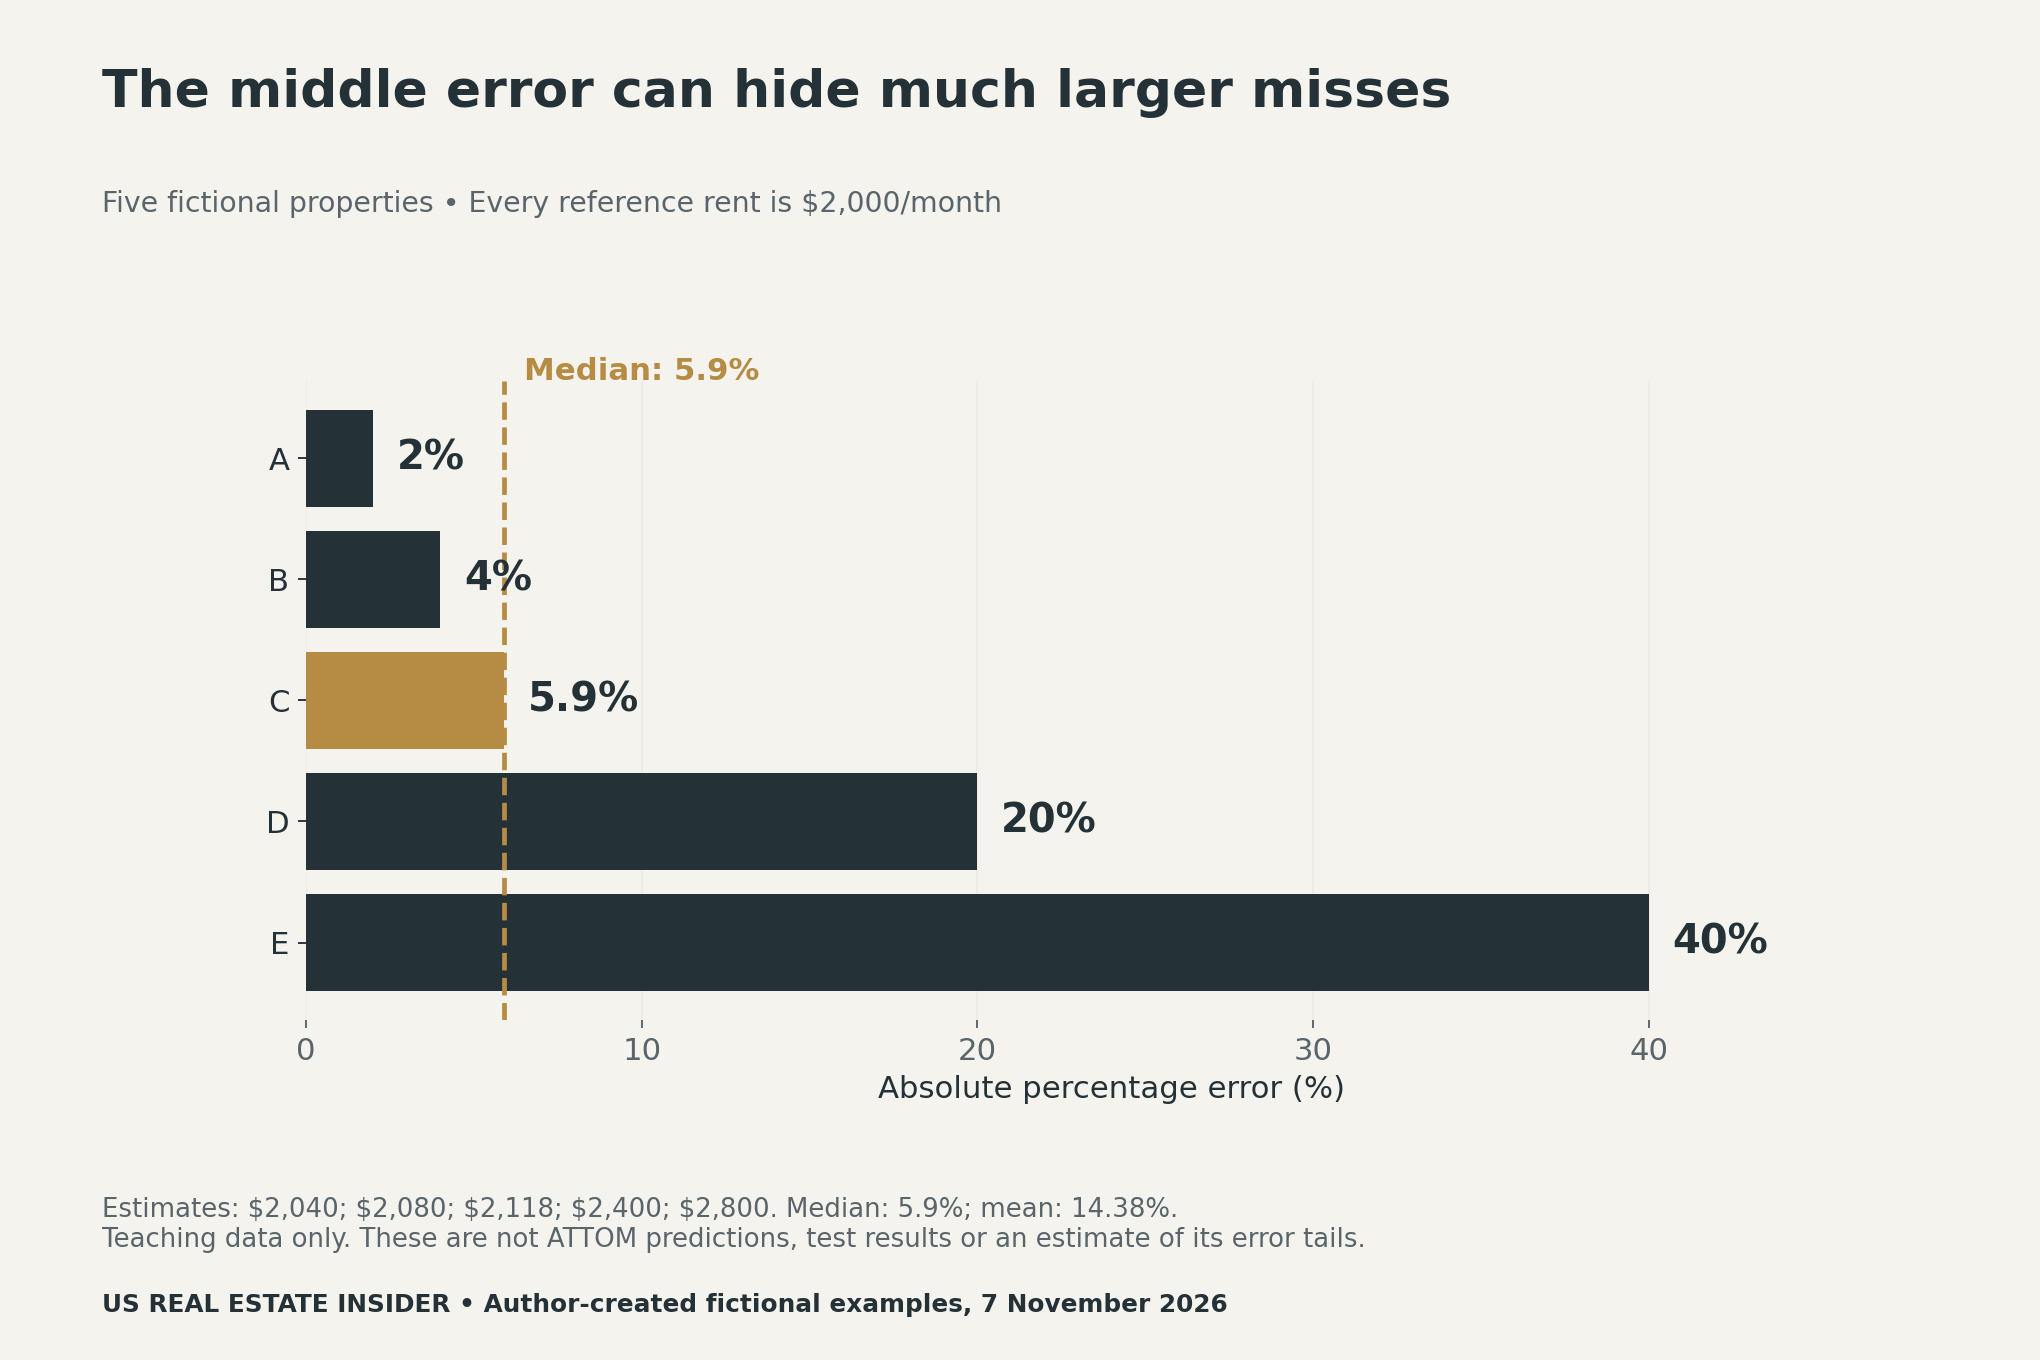
All five estimates in this small example sit above the reference. Absolute errors remove the direction of a miss, so the same summary could also arise from estimates below the reference. A useful evaluation should therefore inspect signed errors as well. A balanced-looking absolute summary alone cannot establish whether overestimation or underestimation is more common.
Median and mean answer different questions
The NIST guide to measures of location explains the distinction between the mean and median. For an ordered list with five entries, the median is the third entry. The mean adds all entries and divides by five. The middle position and the average magnitude need not agree when the tail is uneven.
In our example, the median is 5.9%. The mean is (2 + 4 + 5.9 + 20 + 40) divided by 5, giving 14.38%. Neither calculation is wrong. They describe different features of the same fictional list. Reporting only one of them leaves part of the distribution unseen.
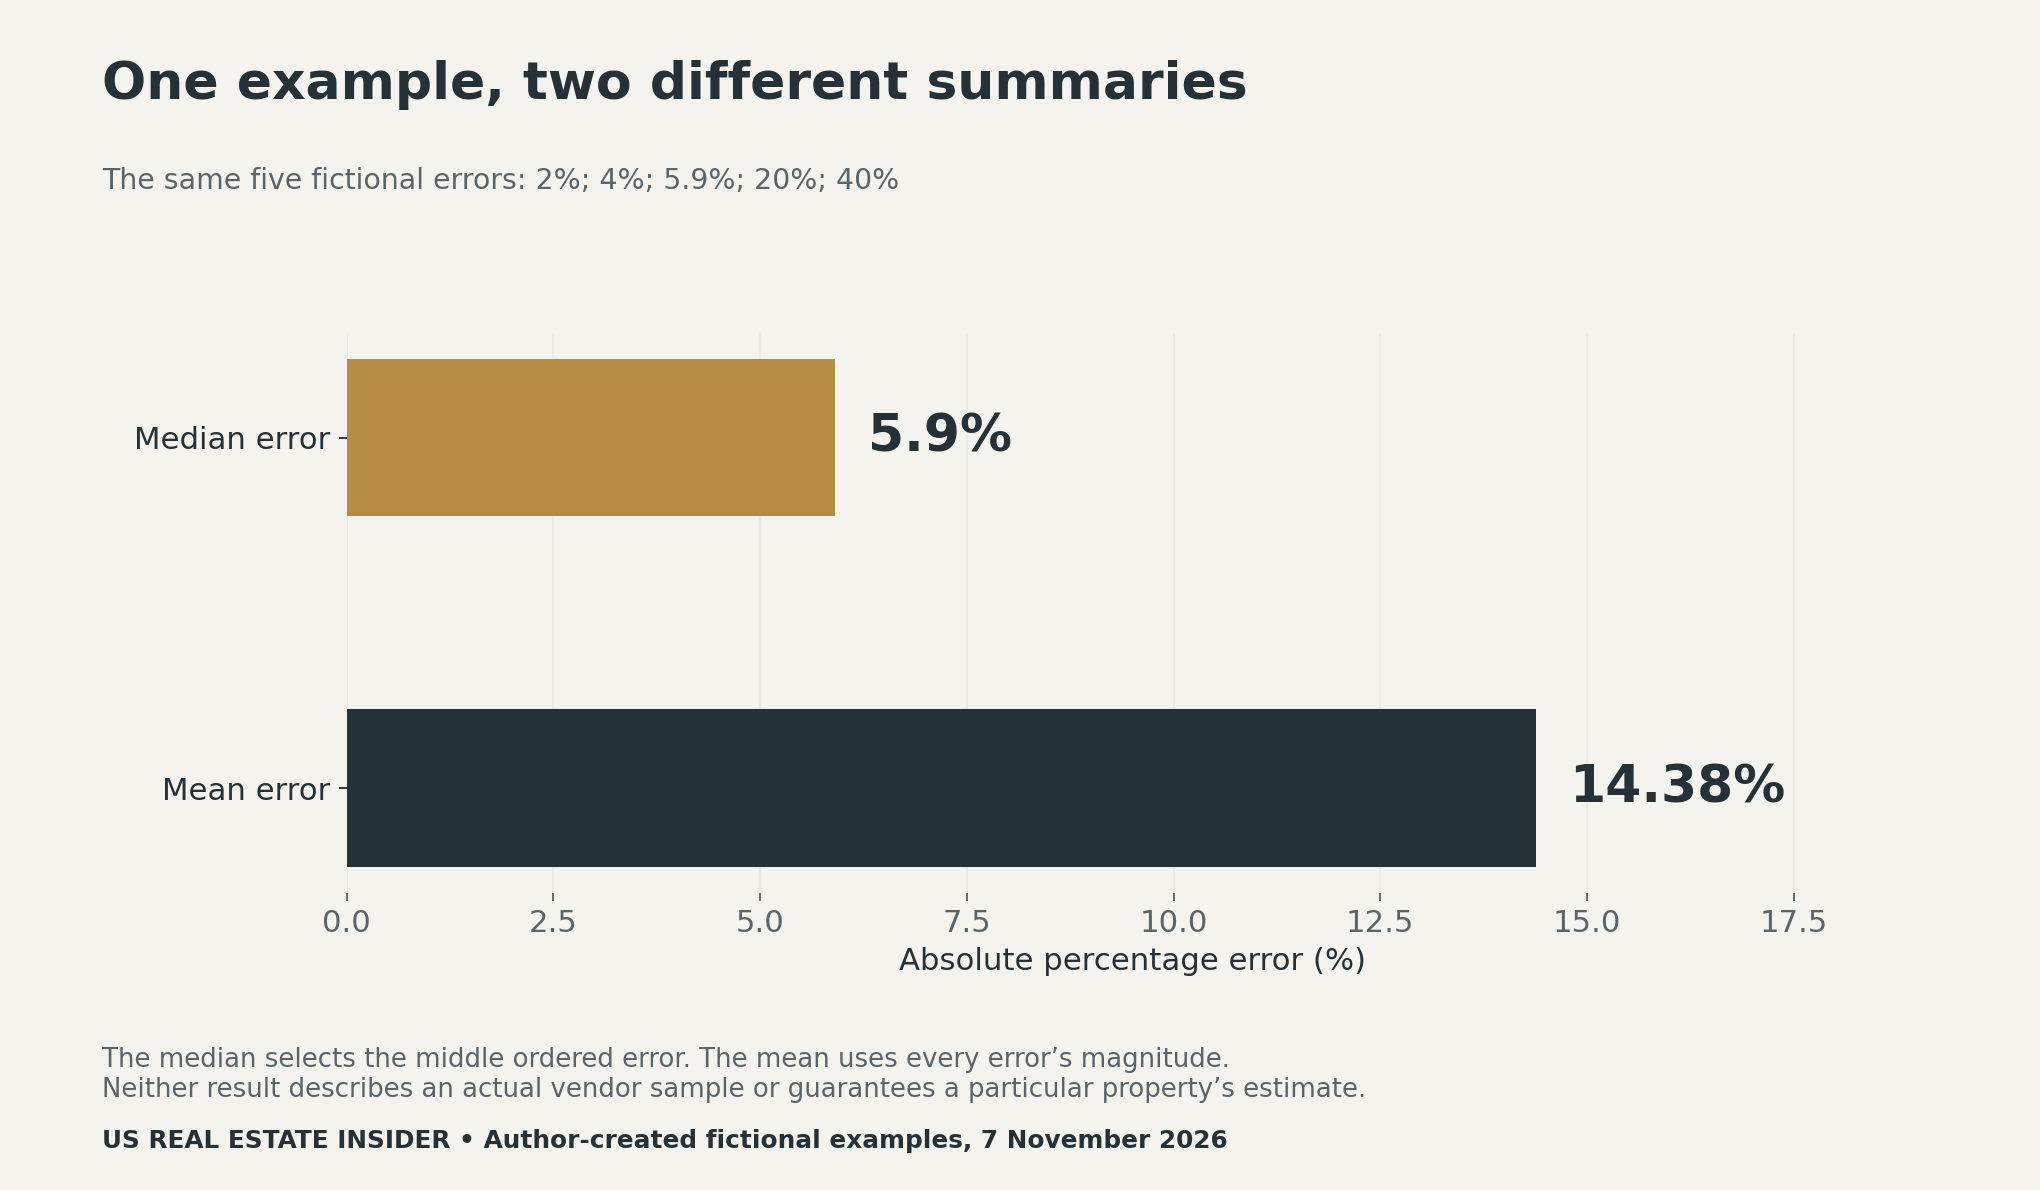
A median also does not provide the probability that your next property estimate is within a chosen threshold. That requires assumptions about how closely your property resembles the validation population, alongside an appropriate evaluation of future cases. Avoid moving from a sample summary to a property-level guarantee without that evidence.
A larger tail can leave the median unchanged
Now change only the last fictional error from 40% to 80%. Leave the other four values at 2%, 4%, 5.9% and 20%. The median stays at 5.9%, because the third ordered entry has not changed. However, the mean rises from 14.38% to 22.38%. This simple sensitivity test shows why the median cannot tell the full story about large misses.
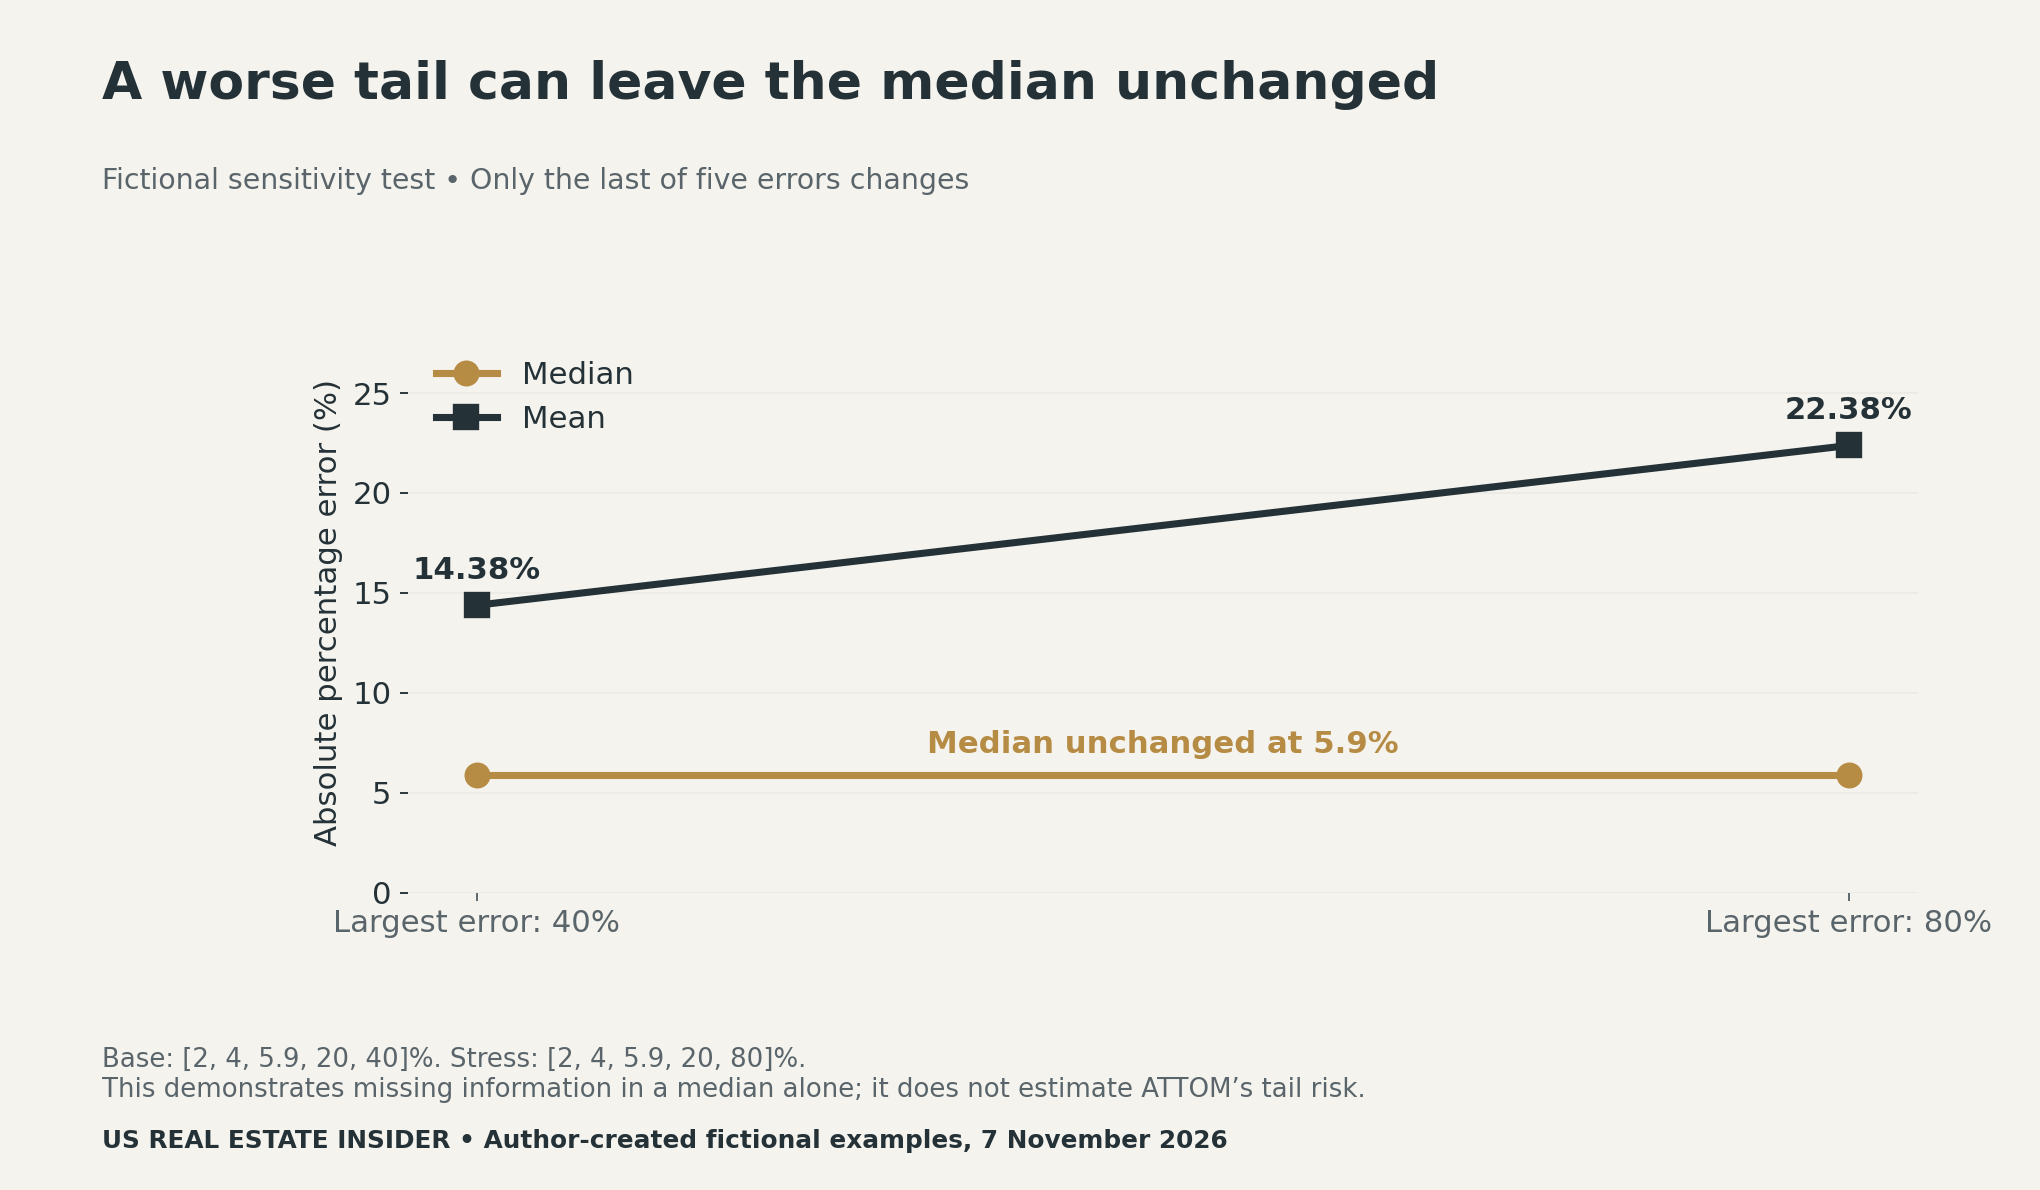
Ask for percentile errors, threshold hit rates and the number of usable test cases. For example, a 90th-percentile error would help describe a different point in the distribution. It still needs a clearly defined sample, date range and benchmark. Do not invent those values from the published median.
Separate asking rent, lease rent and collected rent
An advertised asking rent, a signed lease rent and cash collected during a period are different records. Concessions can also change what a quoted rent means. A model tested against listings answers a different question from a model independently checked against signed leases or realized collections. That distinction matters when moving from screening properties to forecasting cash flow.
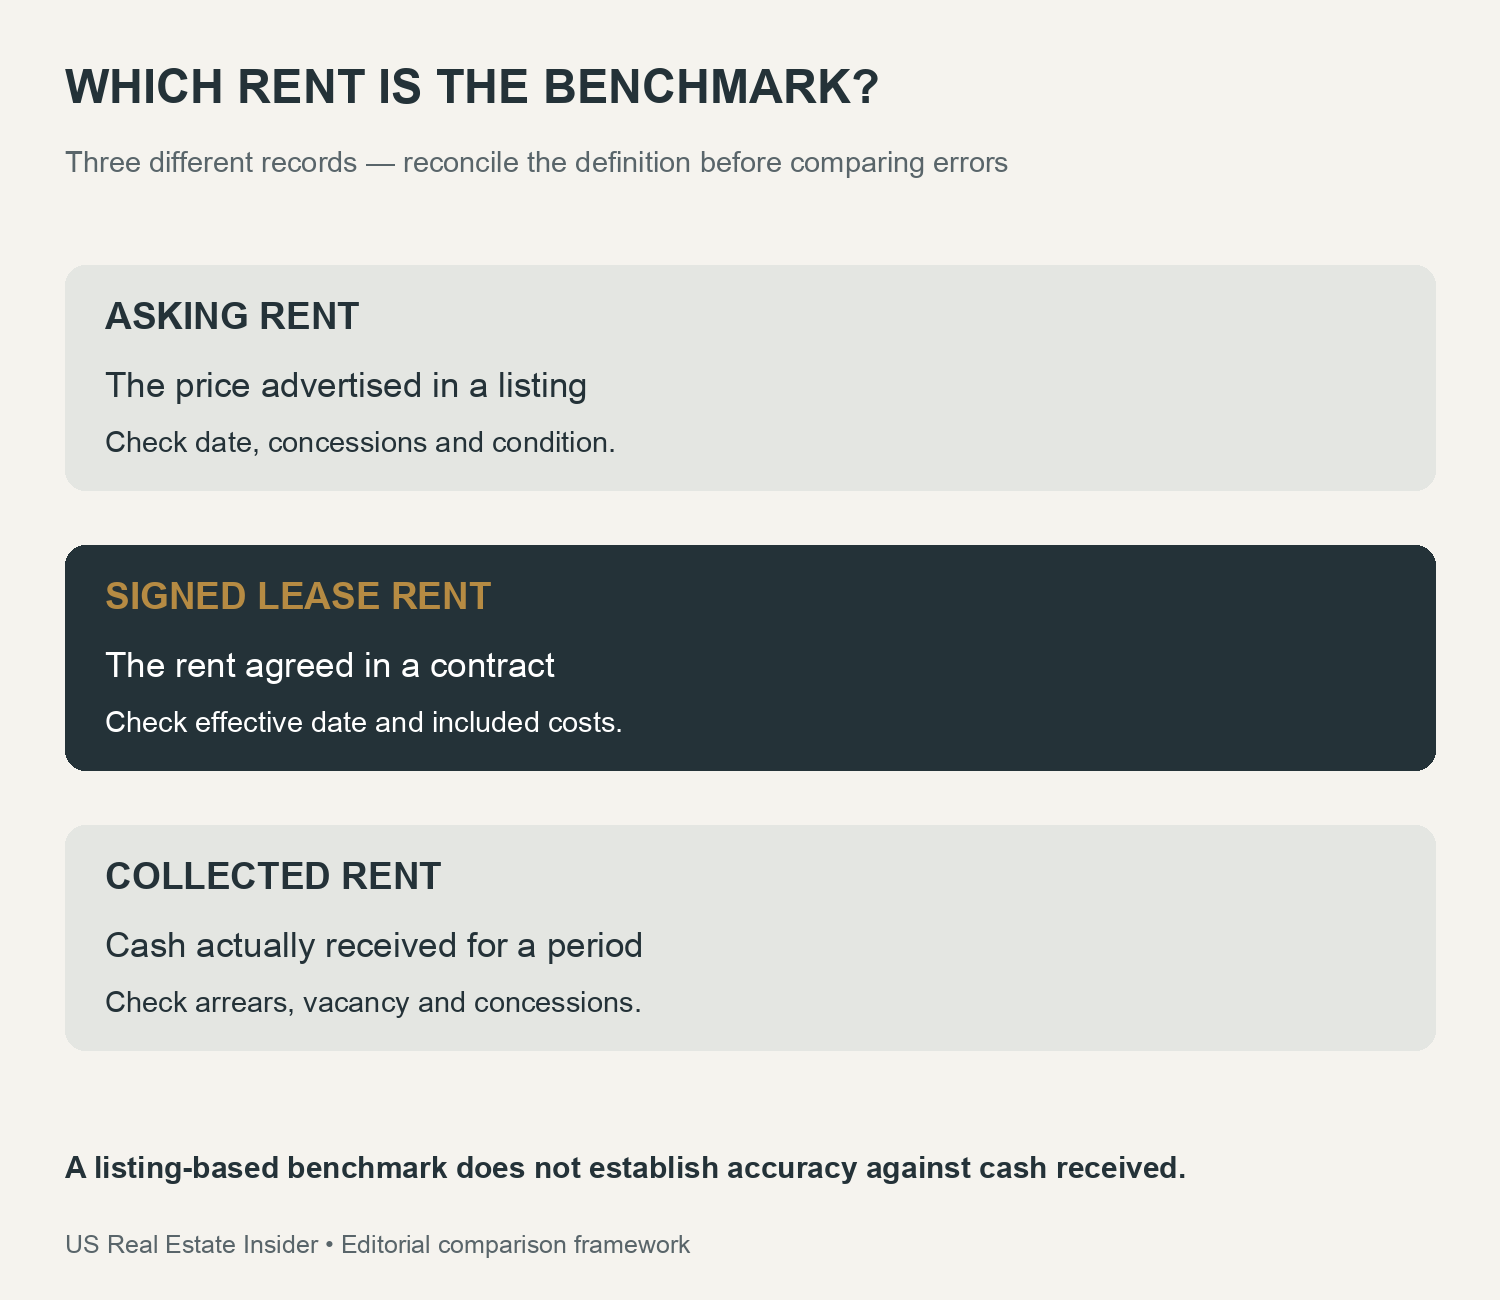
Record the reference type beside every comparison in the property worksheet. Also retain the estimate date, comparison date, condition notes and concessions. Without these fields, an apparent error might combine a model miss with a date mismatch, different property condition or a different definition of rent.
Which validation questions remain open in this review?
The public announcement does not supply the complete held-out sample, local error distributions or independently verified coverage of the low-high ranges. Its linked technical white-paper page requires a form to obtain the full paper. We reviewed that public landing page but did not submit the form or review the gated paper. Consequently, this article describes limits of the public material we inspected, rather than claiming that the provider has no additional validation.
Before using a range as an interval, ask what probability coverage it targets and what share of independent test outcomes actually fell inside it. A narrow range is not automatically a reliable range. Also ask whether predictions were frozen before the benchmark listing appeared, how exclusions were handled, and how performance varies across markets, property types and rental-history groups.
Treat an automated estimate as one input to a documented comparison. Check recent, relevant local evidence and the property’s actual condition before making a pricing decision. For a related measurement distinction, see our active-listings versus new-listings analysis. Our CMBS weighting study shows another case where a headline summary can hide variation beneath it.
Download the rental AVM accuracy tools
The first two CSVs reproduce the fictional examples and identify their synthetic status. The validation checklist and blank property worksheet help organize evidence; they contain no actual properties, tenant details or vendor model outputs. They are teaching and documentation tools, not an underwriting model.
- Five-property fictional error example (CSV)
- Fictional median and tail sensitivity (CSV)
- Rental AVM validation questions (CSV)
- Blank property-rent comparison worksheet (CSV)
We used decimal arithmetic to calculate each fictional absolute percentage error and checked the median and mean separately. No proprietary model was run and no independent vendor ranking was produced. Three substantive charts cover individual errors, summary choice and tail sensitivity. Additional plots would repeat those examples. The findings concern statistical interpretation, not investment returns or a guarantee of achievable rent.
Suggested citation: US Real Estate Insider, “Rental AVM Accuracy: What a 5.9% Median Error Leaves Unsaid,” November 7, 2026. Vendor claim: ATTOM, November 3, 2026. All five-property calculations and tail scenarios are author-created fictional examples.


