




A commercial property cap rate stress test asks two questions together: what happens to operating income, and what valuation multiple applies to it? In our hypothetical example, $100,000 of annual net operating income at a 5% cap rate implies $2 million. Raising the cap rate to 5.5% lowers that value even when income stays unchanged.
This guide provides an interactive calculator, a reproducible sensitivity grid and a break-even income formula. The chosen rates are assumptions, not quotes for a building. The result measures simplified unlevered property-value sensitivity, rather than an investor’s equity return.
Separate CBRE’s assessment from its forecast
CBRE’s 28 October 2026 briefing describes an approximately 160-basis-point cap-rate spread over the 10-year Treasury, against a roughly 325-basis-point long-run reference. Its near-term discussion anticipates cap-rate increases of 40–60 basis points. That discussion is a forecast, not an already realized future outcome.
Read the chart notes too: its “now” comparison uses Q2 2026 modeled cap rates against a 5% Treasury threshold, with a four-sector simple average. The publication date does not turn every input into an October observation or a transaction quote for an individual asset.
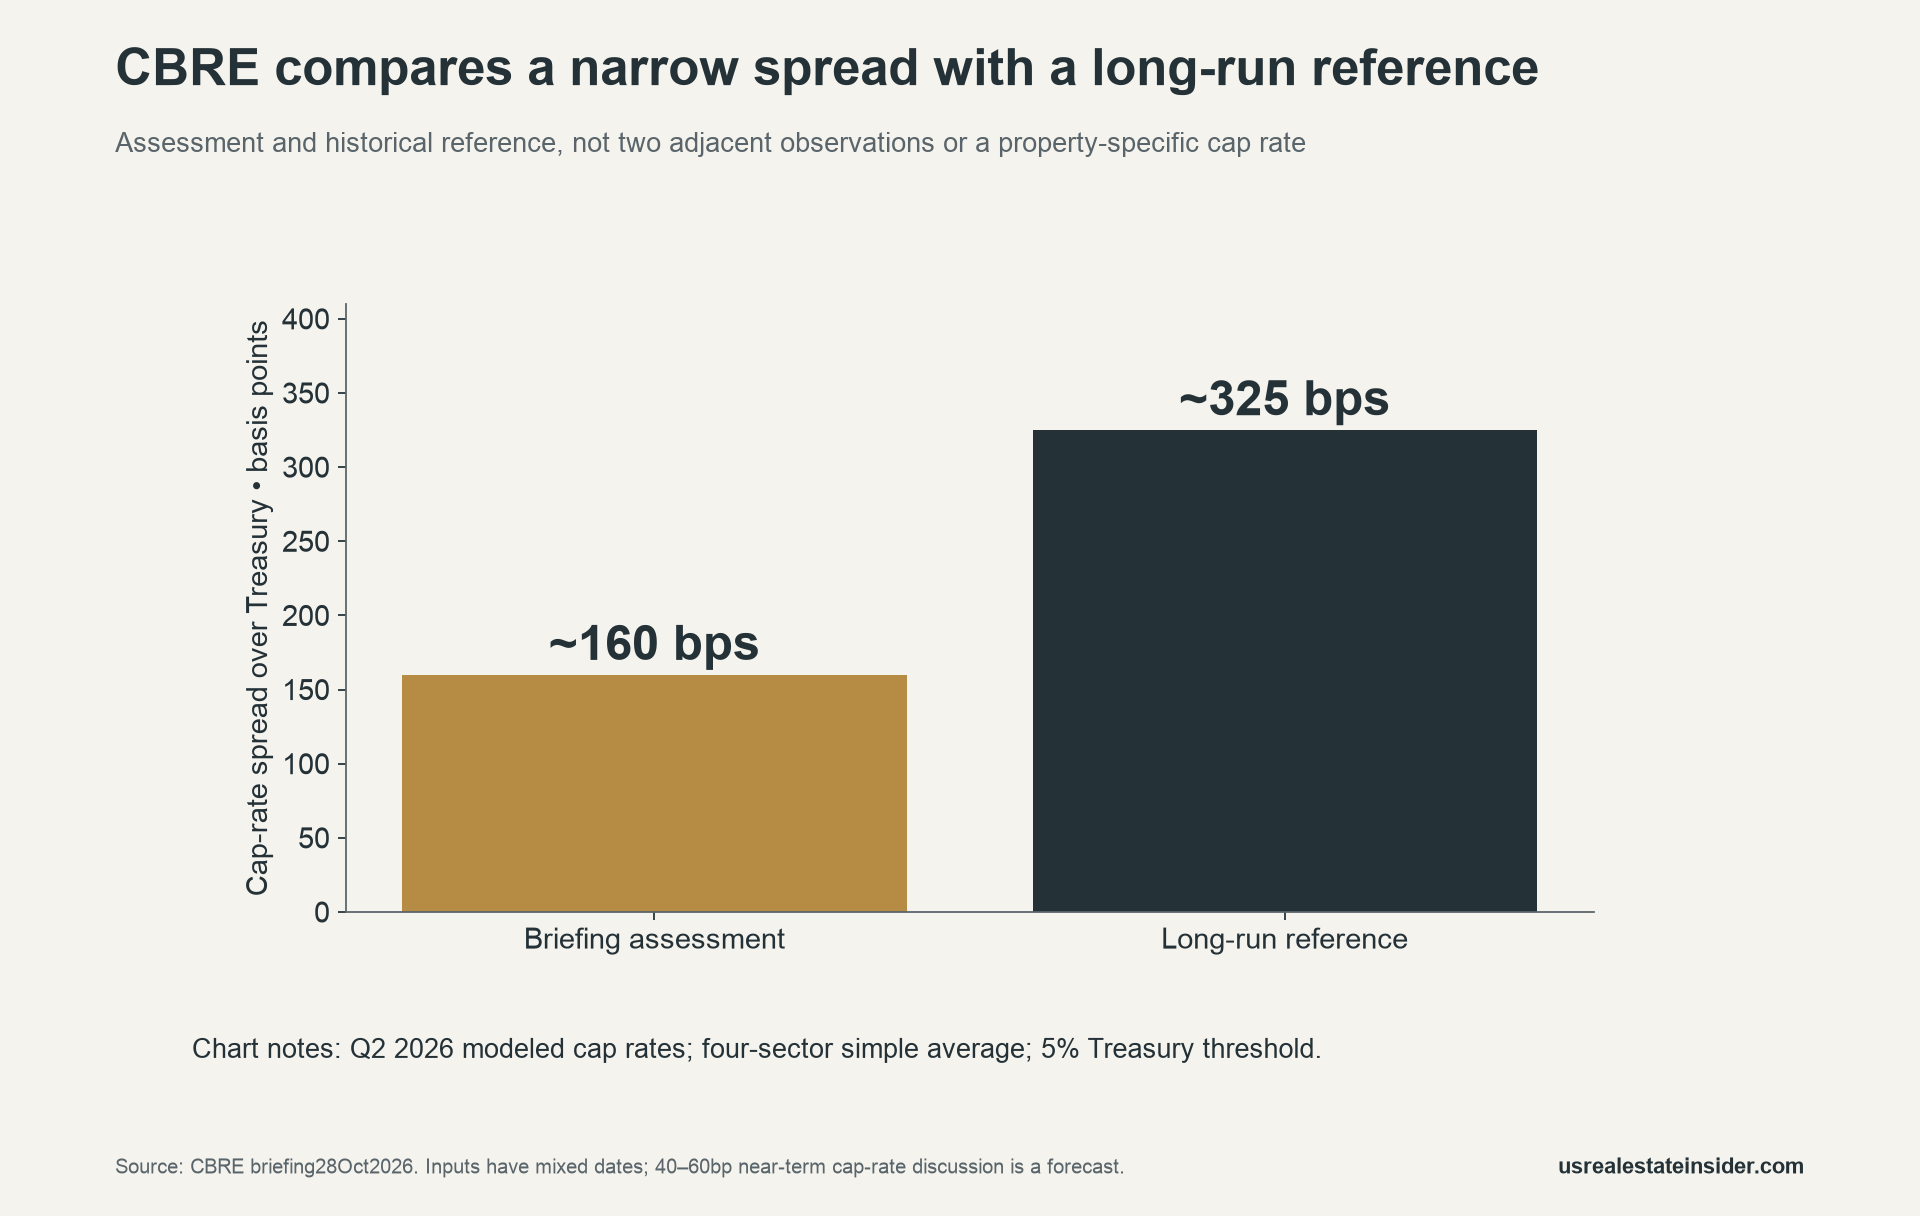
We use that briefing to motivate a transparent stress test. We do not assume its forecast must occur or recommend a purchase based on it. A user-selected scenario remains useful even when a forecast later changes.
Define the cap-rate arithmetic
For this simplified model, value = annual NOI ÷ cap rate expressed as a decimal. Therefore, 5% enters the equation as 0.05. Annual NOI and the selected cap-rate evidence must use compatible definitions; mixing an annual amount with a monthly amount changes the meaning of the result.
A basis point is 0.01 percentage point. A move from 5% to 5.5% is 50 basis points, or 0.5 percentage point. It is a 10% relative increase in the rate, which is different from a 10-percentage-point increase.
| Hypothetical calculation | Result |
|---|---|
| $100,000 ÷ 0.05 | $2,000,000 starting value |
| $100,000 ÷ 0.055 | $1,818,181.82 selected value |
| Selected value ÷ starting value − 1 | −9.09%, rounded |
| $2,000,000 × 0.055 | $110,000 NOI needed to preserve value |
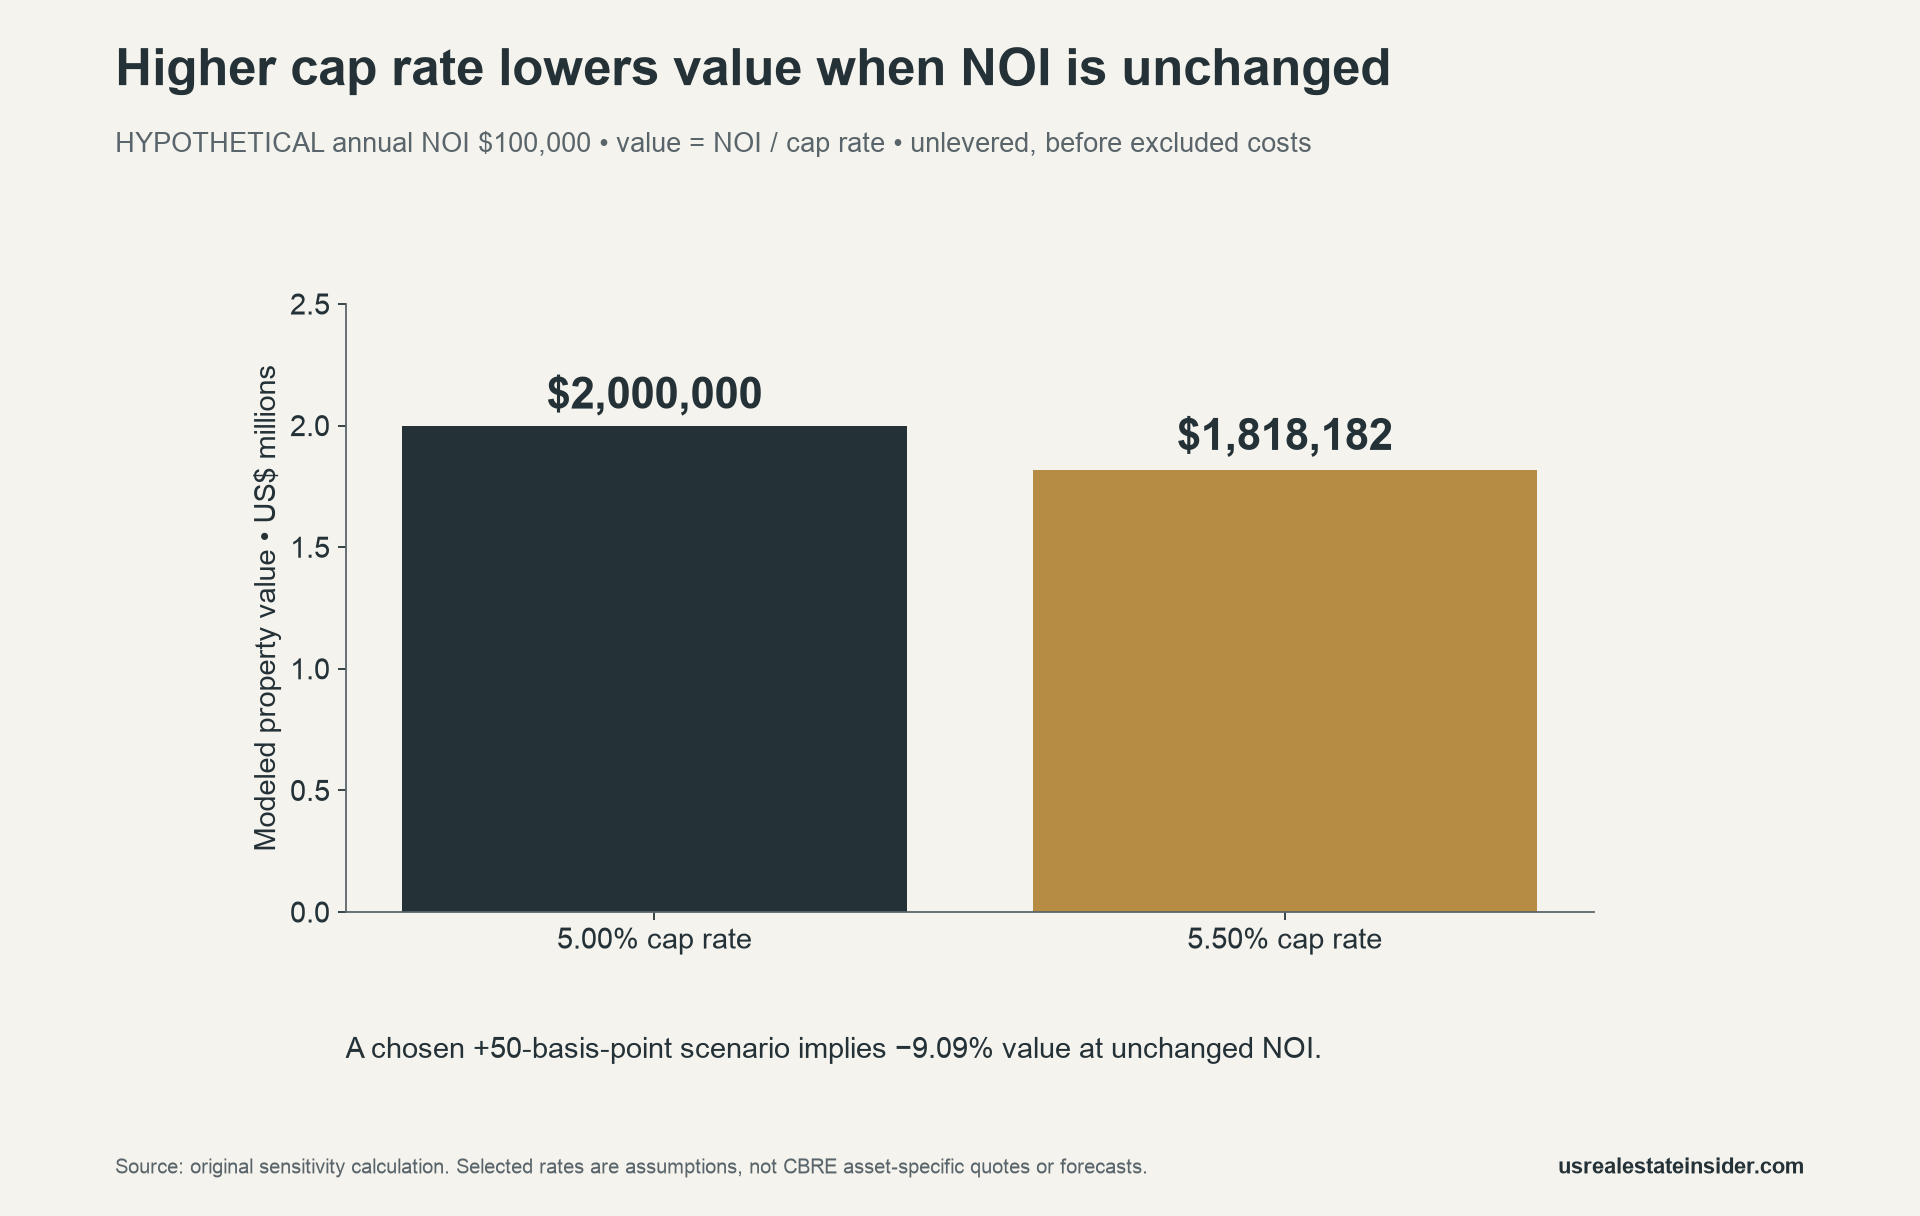
The value decline is not 10% because value is inversely related to the rate when NOI is fixed. Keep percentage changes, percentage points and basis points in separate labelled fields. Otherwise, a plausible-looking spreadsheet can contain the wrong operation.
Use the commercial property cap rate stress test
Enter starting annual NOI, the starting cap rate, a selected cap rate and a selected percentage change in NOI. The tool first establishes the starting modeled value. Then it changes income and the rate together, reporting the selected value and the income needed to preserve the starting value.
Test income and cap-rate assumptions
Hypothetical unlevered value = annual NOI ÷ cap rate. No debt, income tax or disposition costs. Enter percentages as 5 for 5%, not 0.05. This tool does not select a suitable market cap rate.
Inputs remain in this browser. Monetary NOI is rounded to cents. NOI must stay positive; cap rates must be 0.01%–100%. Extreme or unsafe arithmetic is rejected. This is a simplified educational calculation, not an appraisal or return forecast.
Enter a rate as 5 for 5%, rather than 0.05. The tool requires positive starting and selected NOI, cap rates from 0.01% to 100%, and finite inputs. Blank values remain unknown. Extremely large calculations outside the tool’s safe range are rejected rather than displayed as valid estimates.
These input limits protect the arithmetic; they do not identify realistic rates for an asset. Record the period, source and relevance of each assumption separately. No input is sent to a server or saved by the calculator.
Read the two-variable sensitivity grid
Our grid begins with $100,000 NOI at 5%, so every cell compares with the same $2 million starting value. Rows vary annual NOI from a 10% fall to a 20% rise. Columns vary the selected cap rate from 4.5% to 6.5%.
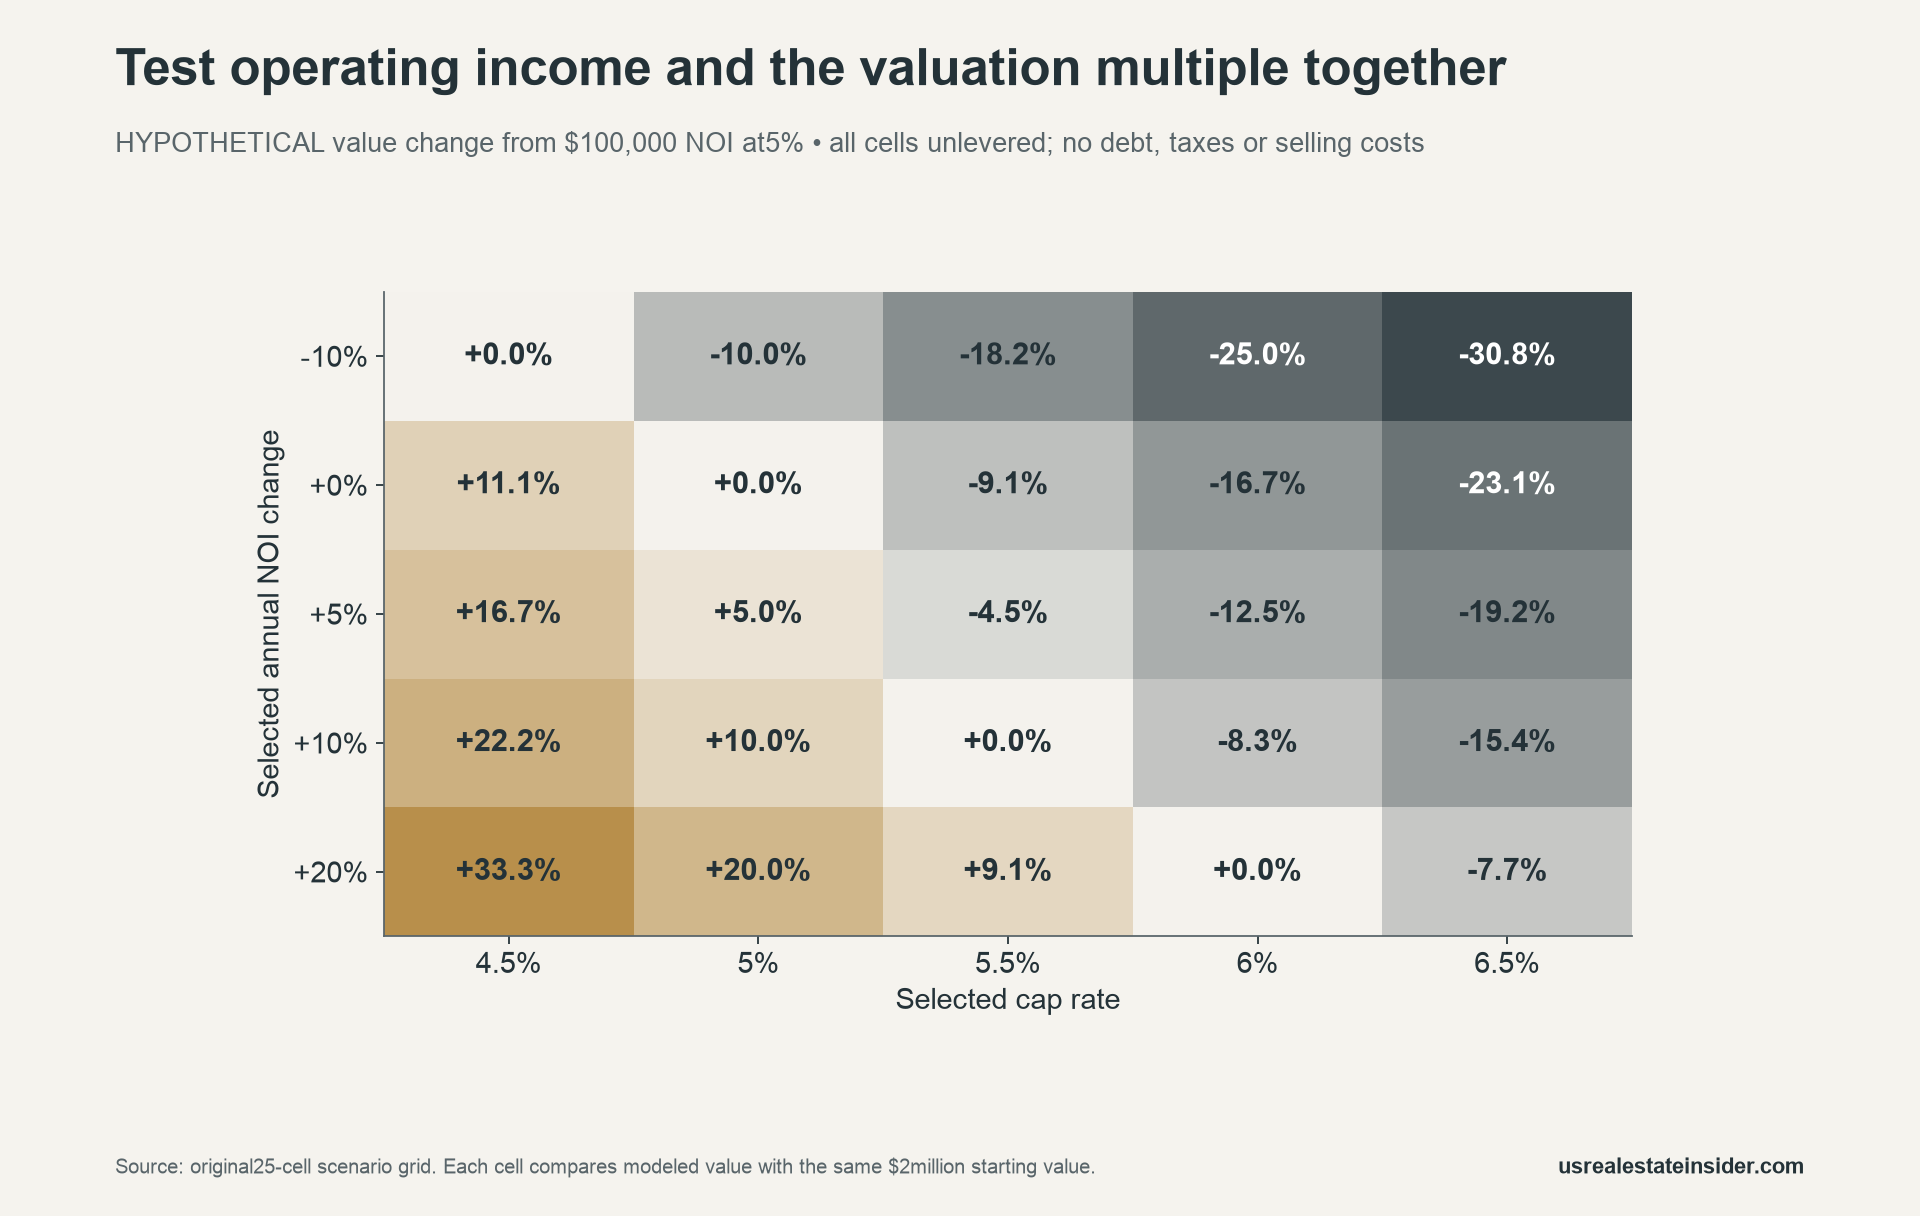
For example, a 5% income increase combined with a 5.5% rate gives about $1.909 million, below the starting value. By contrast, a 10% income increase at that rate preserves $2 million in this model. The cells are scenario calculations, not probabilities or a ranking of investments.
Calculate the break-even NOI change
Holding the target value constant gives a compact formula: required NOI change = selected cap rate ÷ starting cap rate − 1. Use the same units for both rates. For the 5% to 5.5% example, 5.5 ÷ 5 − 1 = 10%.
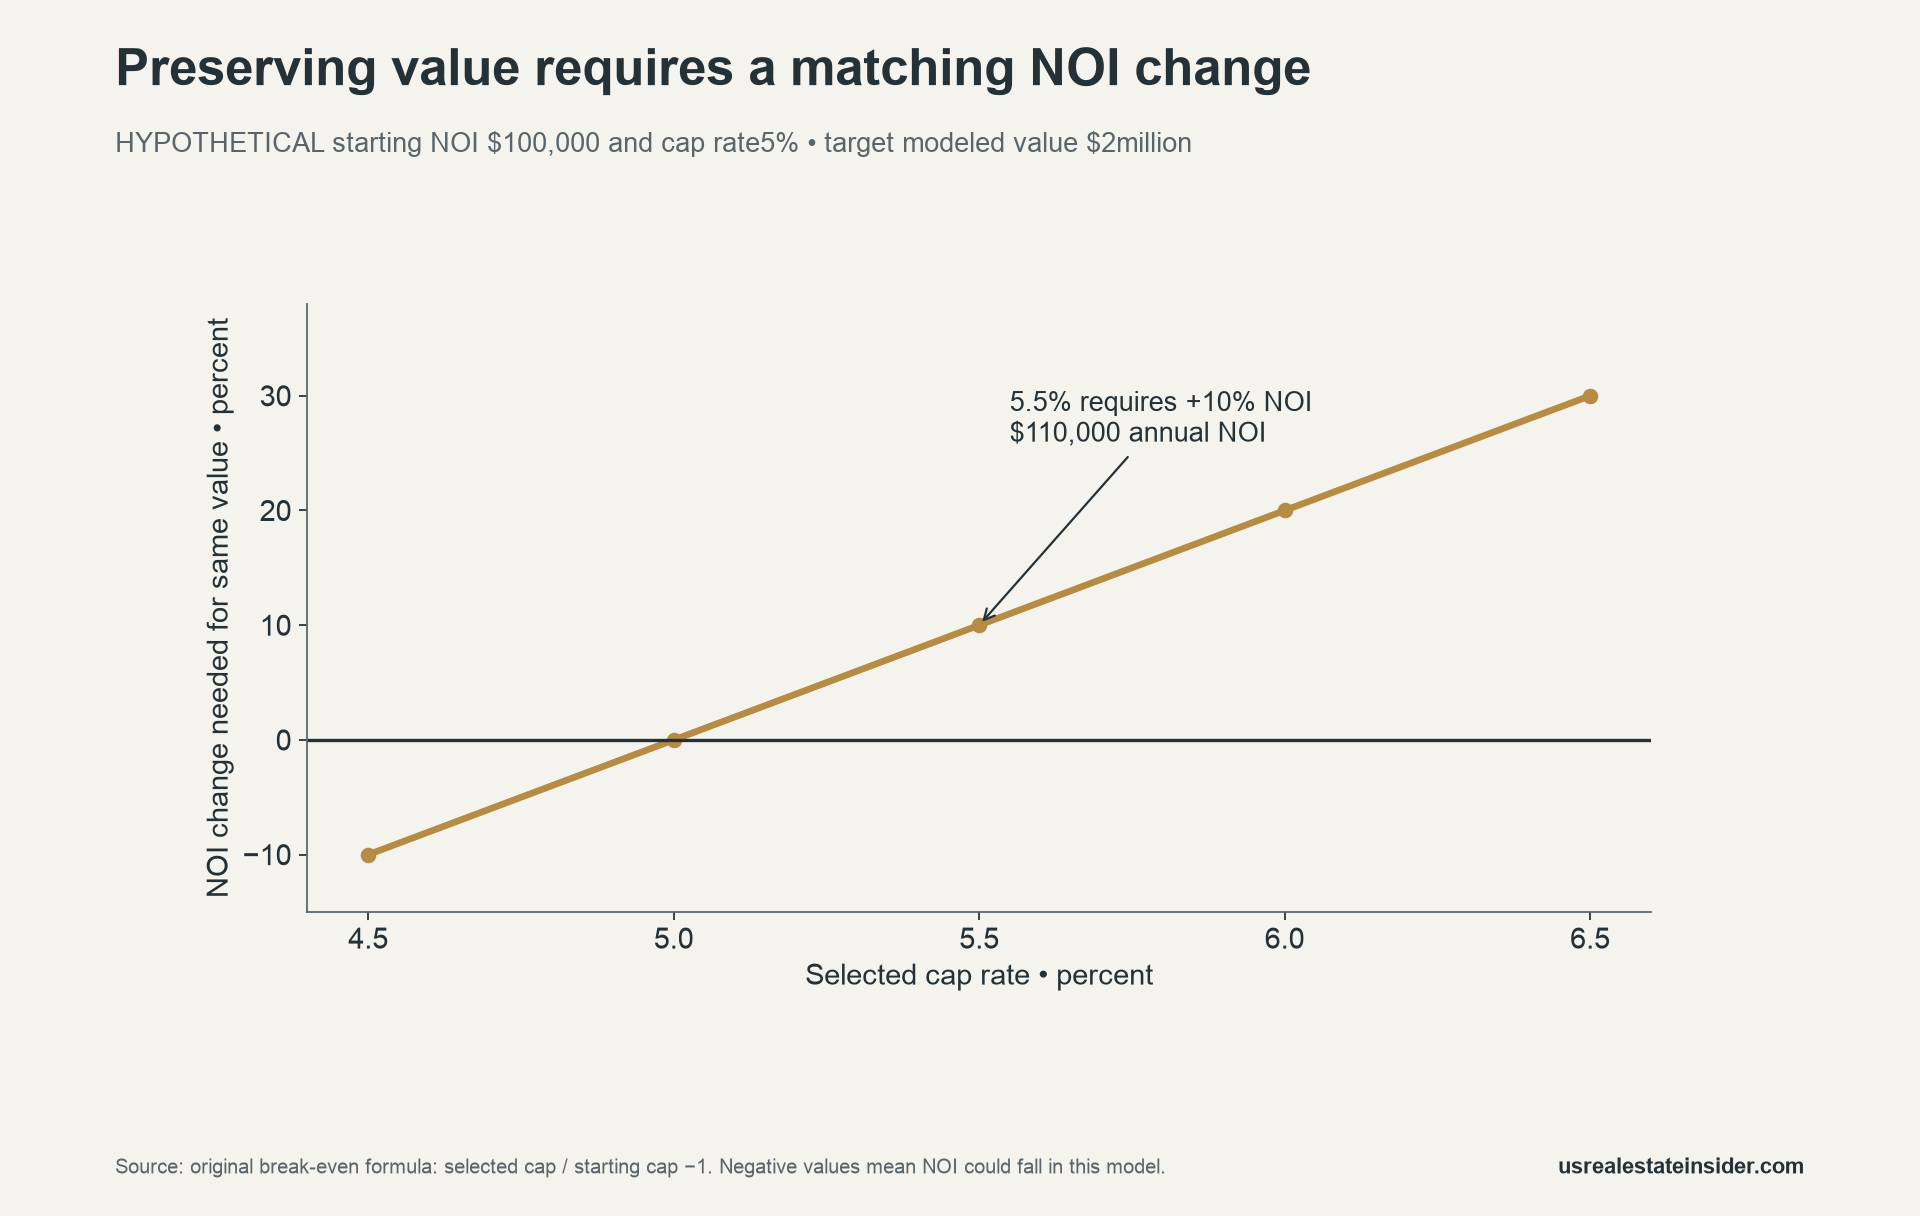
The dollar version multiplies the starting modeled value by the selected rate as a decimal. Here, $2 million × 0.055 = $110,000. A lower selected rate can imply a negative required change, meaning income could fall while preserving value under these assumptions.
This threshold is arithmetic, not a forecast that the required income improvement is achievable. Leasing costs, vacancy, expense growth and tenant changes can make an operating plan more difficult than a single growth percentage suggests.

A growing operating business can still reprice lower
Suppose NOI rises from $100,000 to $105,000 while the selected rate rises from 5% to 5.5%. The income change is +5%, yet modeled value becomes $1,909,090.91, a 4.55% decline from the starting value. These results describe different quantities and can coexist.
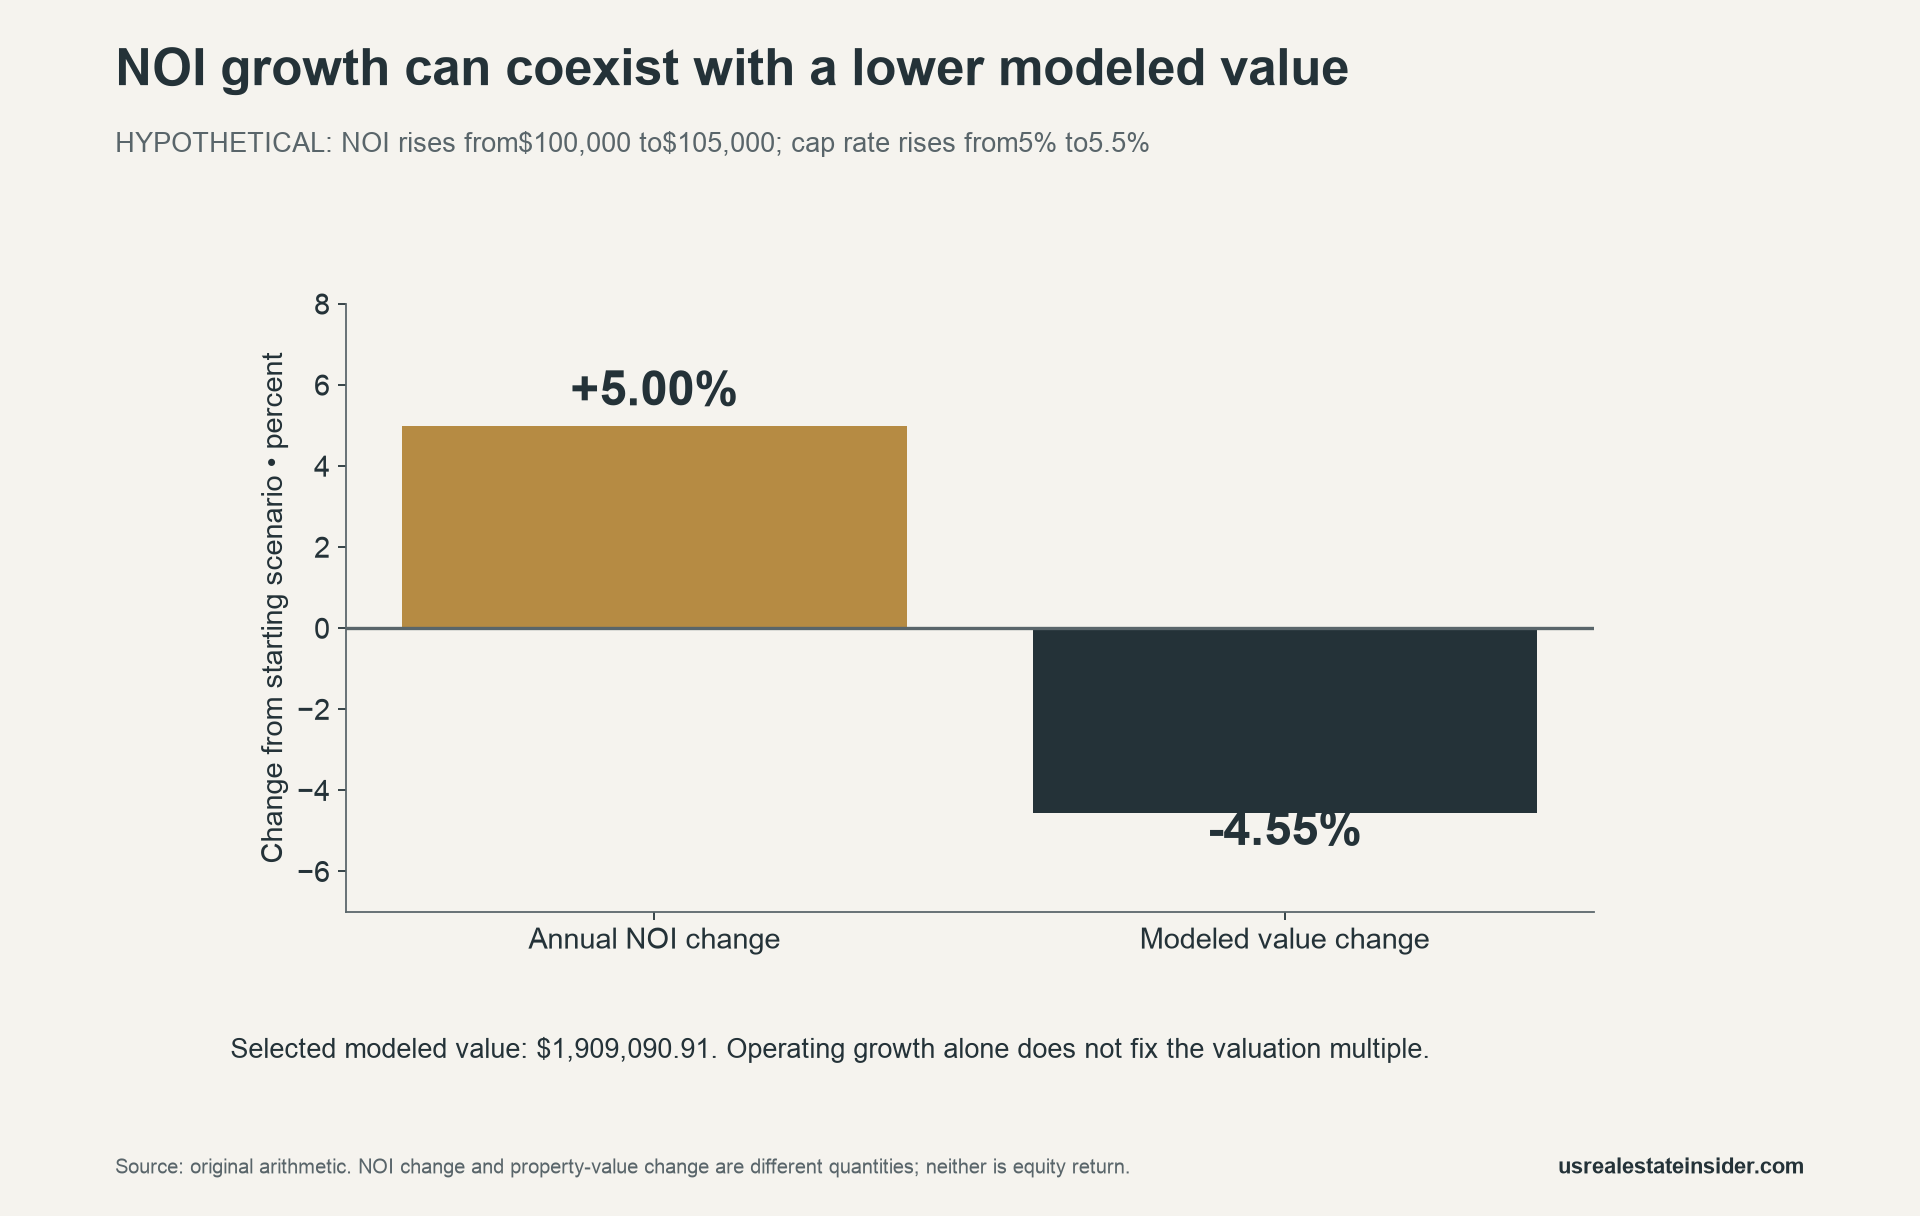
Therefore, test the operating plan and valuation assumption together. A higher income estimate does not by itself justify keeping an unchanged exit value. Equally, this simple exercise cannot establish an appropriate cap rate or replace a fuller cash-flow model.
Document asset-specific assumptions
Record the NOI period and any annualization, recurring income and expenses, vacancy treatment and capital-expenditure treatment. Then document the source and relevance of each cap-rate assumption. Keep unresolved evidence visible rather than choosing a convenient rate to reach a desired valuation.
Also, record lease expiry, tenant-credit assumptions and disposition costs. State whether an expense is included in NOI, excluded entirely or handled elsewhere. A consistent definition matters more than adding detail that cannot be verified.
Debt, income taxes and sale costs are outside this calculator. They can materially change investor outcomes. Property-value sensitivity is not equity-return sensitivity, and a modeled sector average is not an appraisal of an individual building.
Download the reproducible calculations
The hypothetical cap-rate sensitivity grid (CSV) retains all 25 cells and their assumptions. The break-even NOI calculations (CSV) show the income needed at selected rates. Both use decimal arithmetic in our retained analysis.
Use the blank assumptions dictionary (CSV) for actual evidence. Our executed calculator validation cases (CSV) document nine arithmetic and boundary checks. The CBRE context and vintage notes (CSV) separate the briefing’s assessment, historical reference and forecast discussion.
Method, limitations and related research
US Real Estate Insider verified CBRE’s public briefing and its chart notes on 2 November 2026. Our original figures use openly stated hypothetical inputs. Validation checks cover the unchanged-income example, value preservation, income growth, lower rates, income decline and invalid input boundaries.
This is a simplified educational tool, not an appraisal, discounted cash-flow analysis or instruction to buy or sell. Local conditions, asset quality, lease terms and required capital work can change the relevant analysis. Appropriate independent underwriting should address those facts directly. Our mixed-use commercial risk guide provides related background; the calculator remains a separate, limited arithmetic tool.
For another measurement comparison, see our FHFA index and sale-price median guide. Our property-status verification worksheet likewise separates a national statistic from evidence needed for an individual property.
Suggested citation: US Real Estate Insider, “Commercial Property Cap Rate Stress Test,” 2 November 2026. Cite CBRE for its dated briefing and this article for the original formulas, grid and calculator.


