




Comparing the FHFA house price index vs median sale price starts with a measurement question: what does each number describe? A national appreciation index and the midpoint of completed sales can both be useful. However, neither supplies an automatic asking price for a specific home.
Two late-October releases illustrate the issue. This guide separates their dates and definitions, then offers an original sales-mix demonstration and a blank comparable-sales worksheet. Use them to organize evidence for a discussion with your agent or appraiser.
Start with the dated releases
FHFA’s 27 October 2026 release reports a seasonally adjusted August monthly increase of 0.3% and an annual increase of 2.4%. Its flagship purchase-only series uses Fannie Mae and Freddie Mac data and a weighted repeat-sales method.
Meanwhile, NAR’s 29 October release reports a third-quarter existing single-family median of $432,900, up 1.7% annually. It also reports annual median-price increases in 78% of covered metro markets. These are transaction medians for a quarter, rather than an August repeat-sales index.
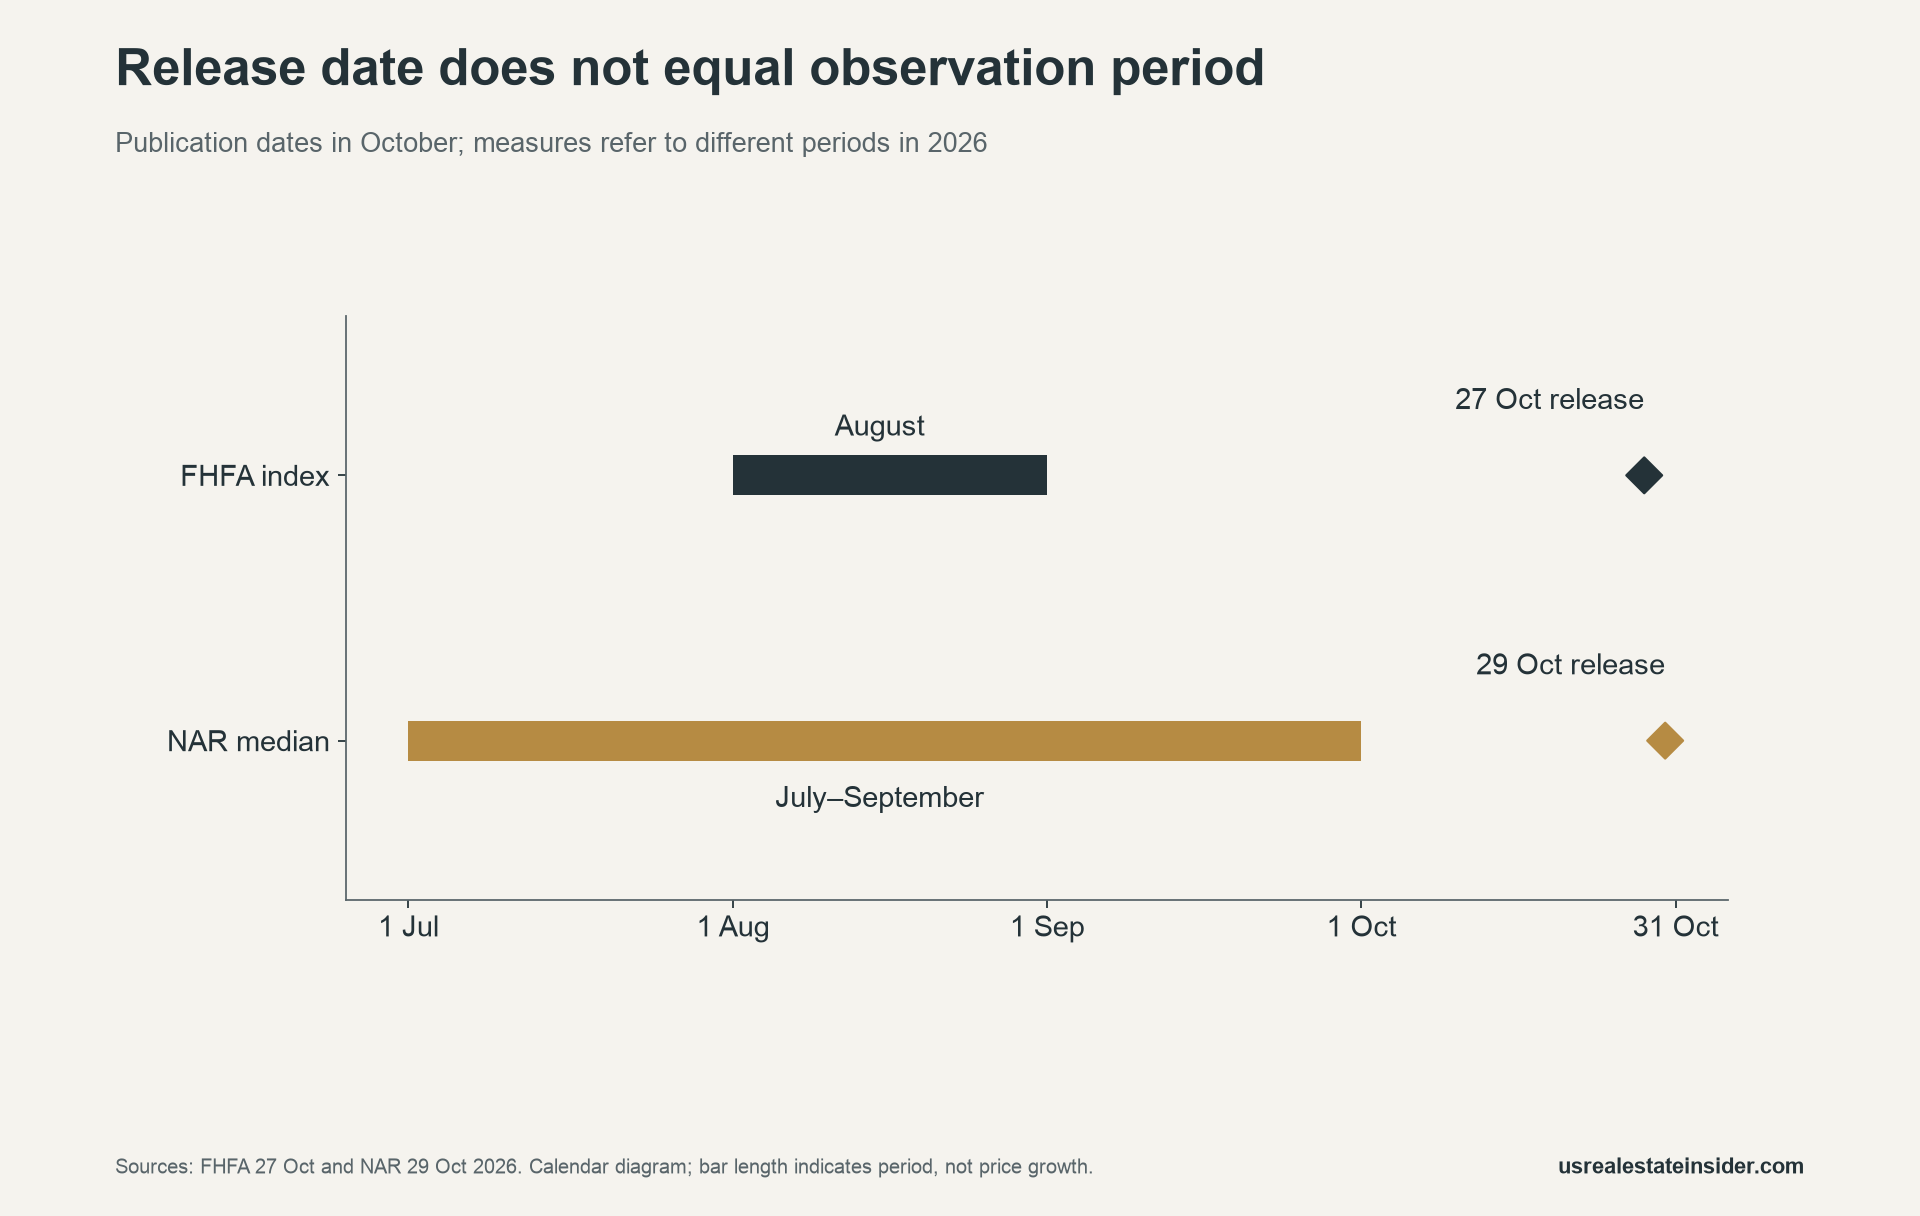
Therefore, the publication month is not the measured month. Before comparing headlines, record the reference period beside each figure. Also, distinguish a national dollar median from a percentage change and a share of metro markets.
FHFA house price index vs median sale price: definitions
A repeat-sales index uses repeat transactions to estimate price movement. A sale-price median is the middle value after the transactions in a sample are sorted. The former targets change through a specific method; the latter describes the center of the sales observed in its period.
| Check | FHFA release | NAR release |
|---|---|---|
| Reference period here | August 2026 | Q3 2026 |
| Statistic | Weighted repeat-sales index | Existing single-family sale median |
| Coverage question | Purchase-only enterprise-financed universe | Covered existing single-family transactions |
| Use in this guide | Broad price-change context | Sales-sample midpoint context |
| Property-specific value? | No | No |
The difference between the reported growth figures is not evidence that one agency made a calculation error. It is also not proof that a change in sales mix explains the entire gap. Different periods, coverage and methods prevent that conclusion from these releases alone.
Record revisions rather than hiding them
FHFA revised July’s previously reported monthly increase from 0.3% to 0.2%. That is a revision of minus 0.1 percentage point, not a negative monthly appreciation rate. Preserve both the reference month and the release vintage when retaining evidence.
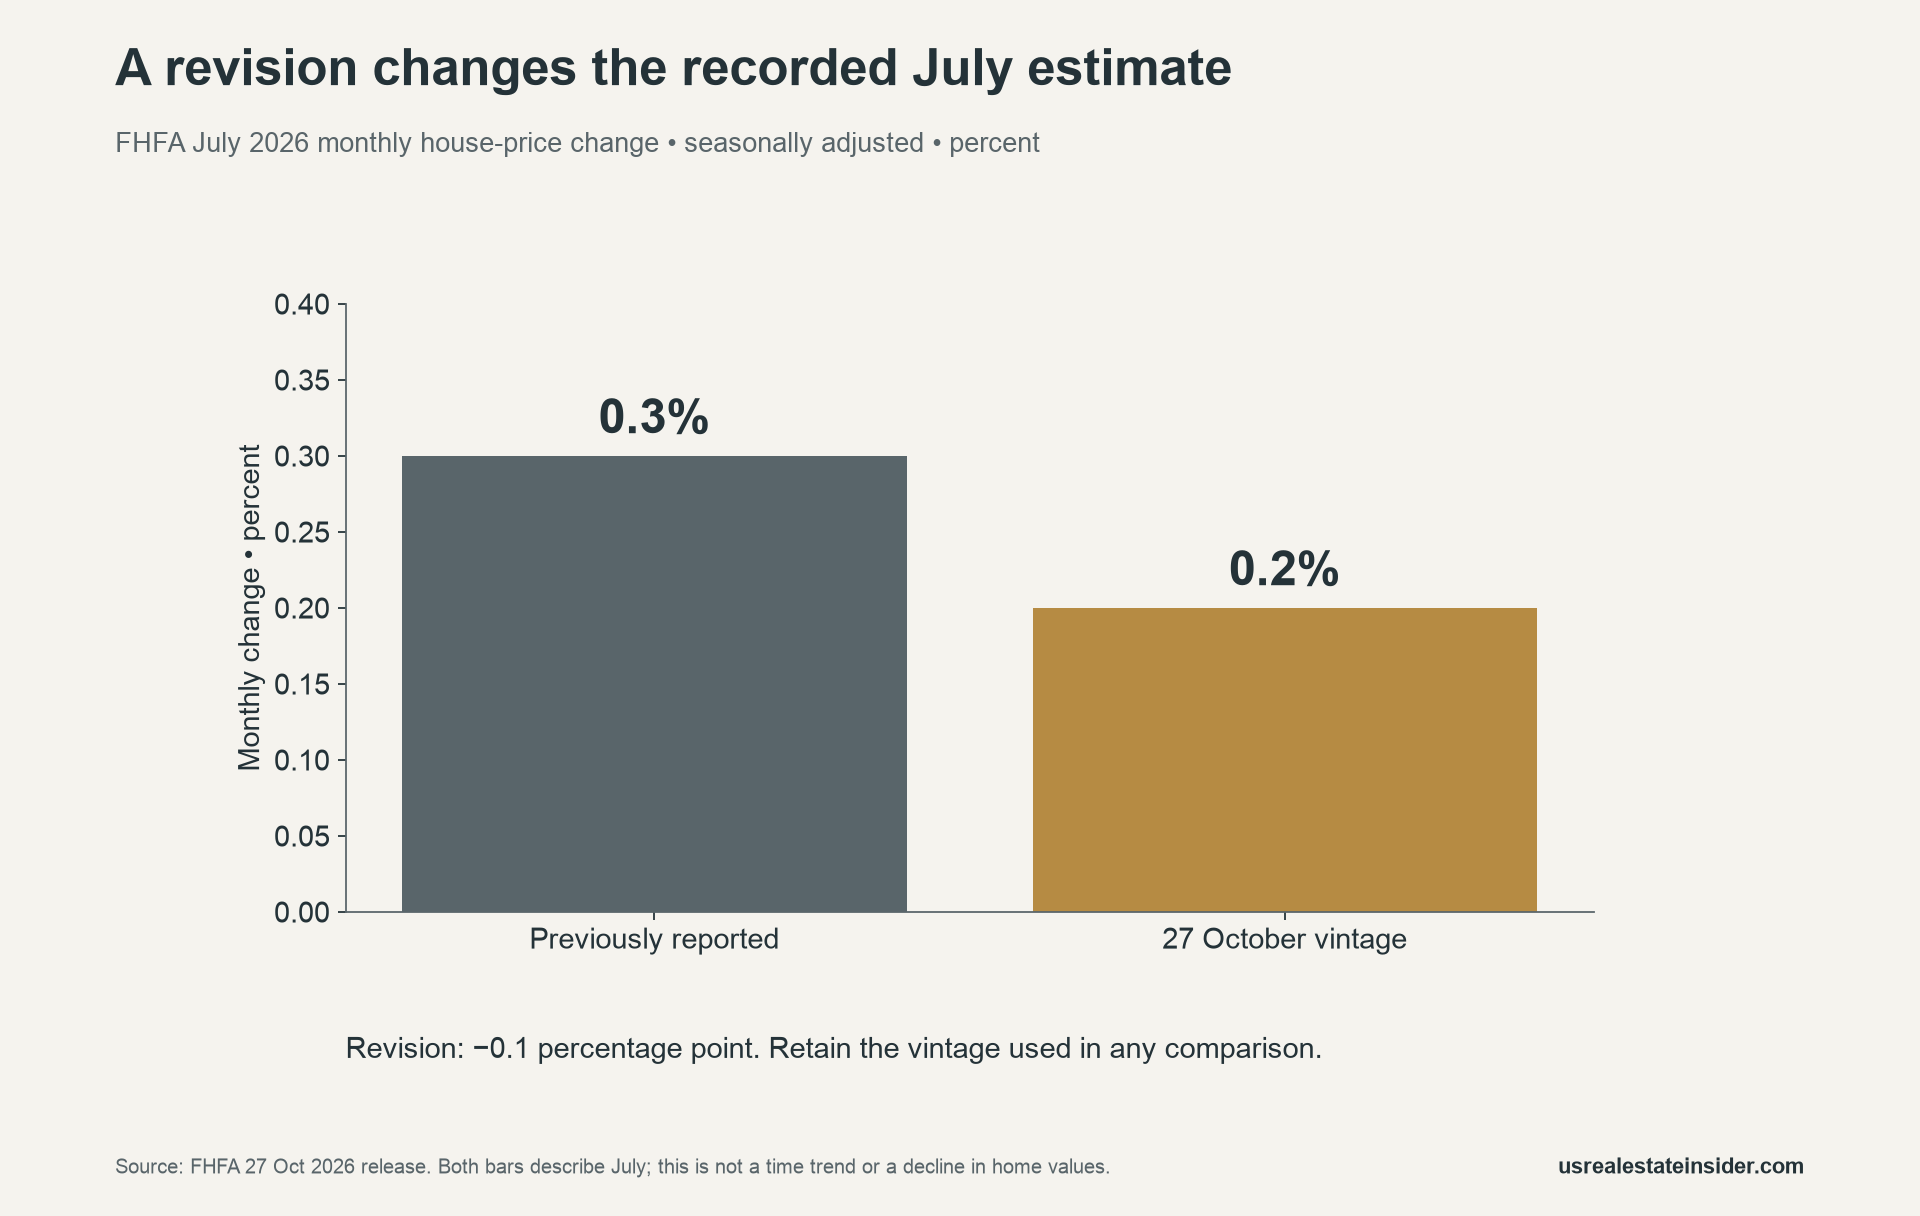
For example, a spreadsheet downloaded on one date can differ from a later spreadsheet without either file being corrupt. Keep the original snapshot, note the later correction and explain which version your comparison uses. Never silently combine a revised observation with an outdated label.
National context is not a local adjustment
In the same FHFA release, annual census-division changes ranged from 0.5% in Mountain to 4.4% in East North Central. Those endpoints show geographic variation within that series. They do not supply an adjustment coefficient for an individual house.
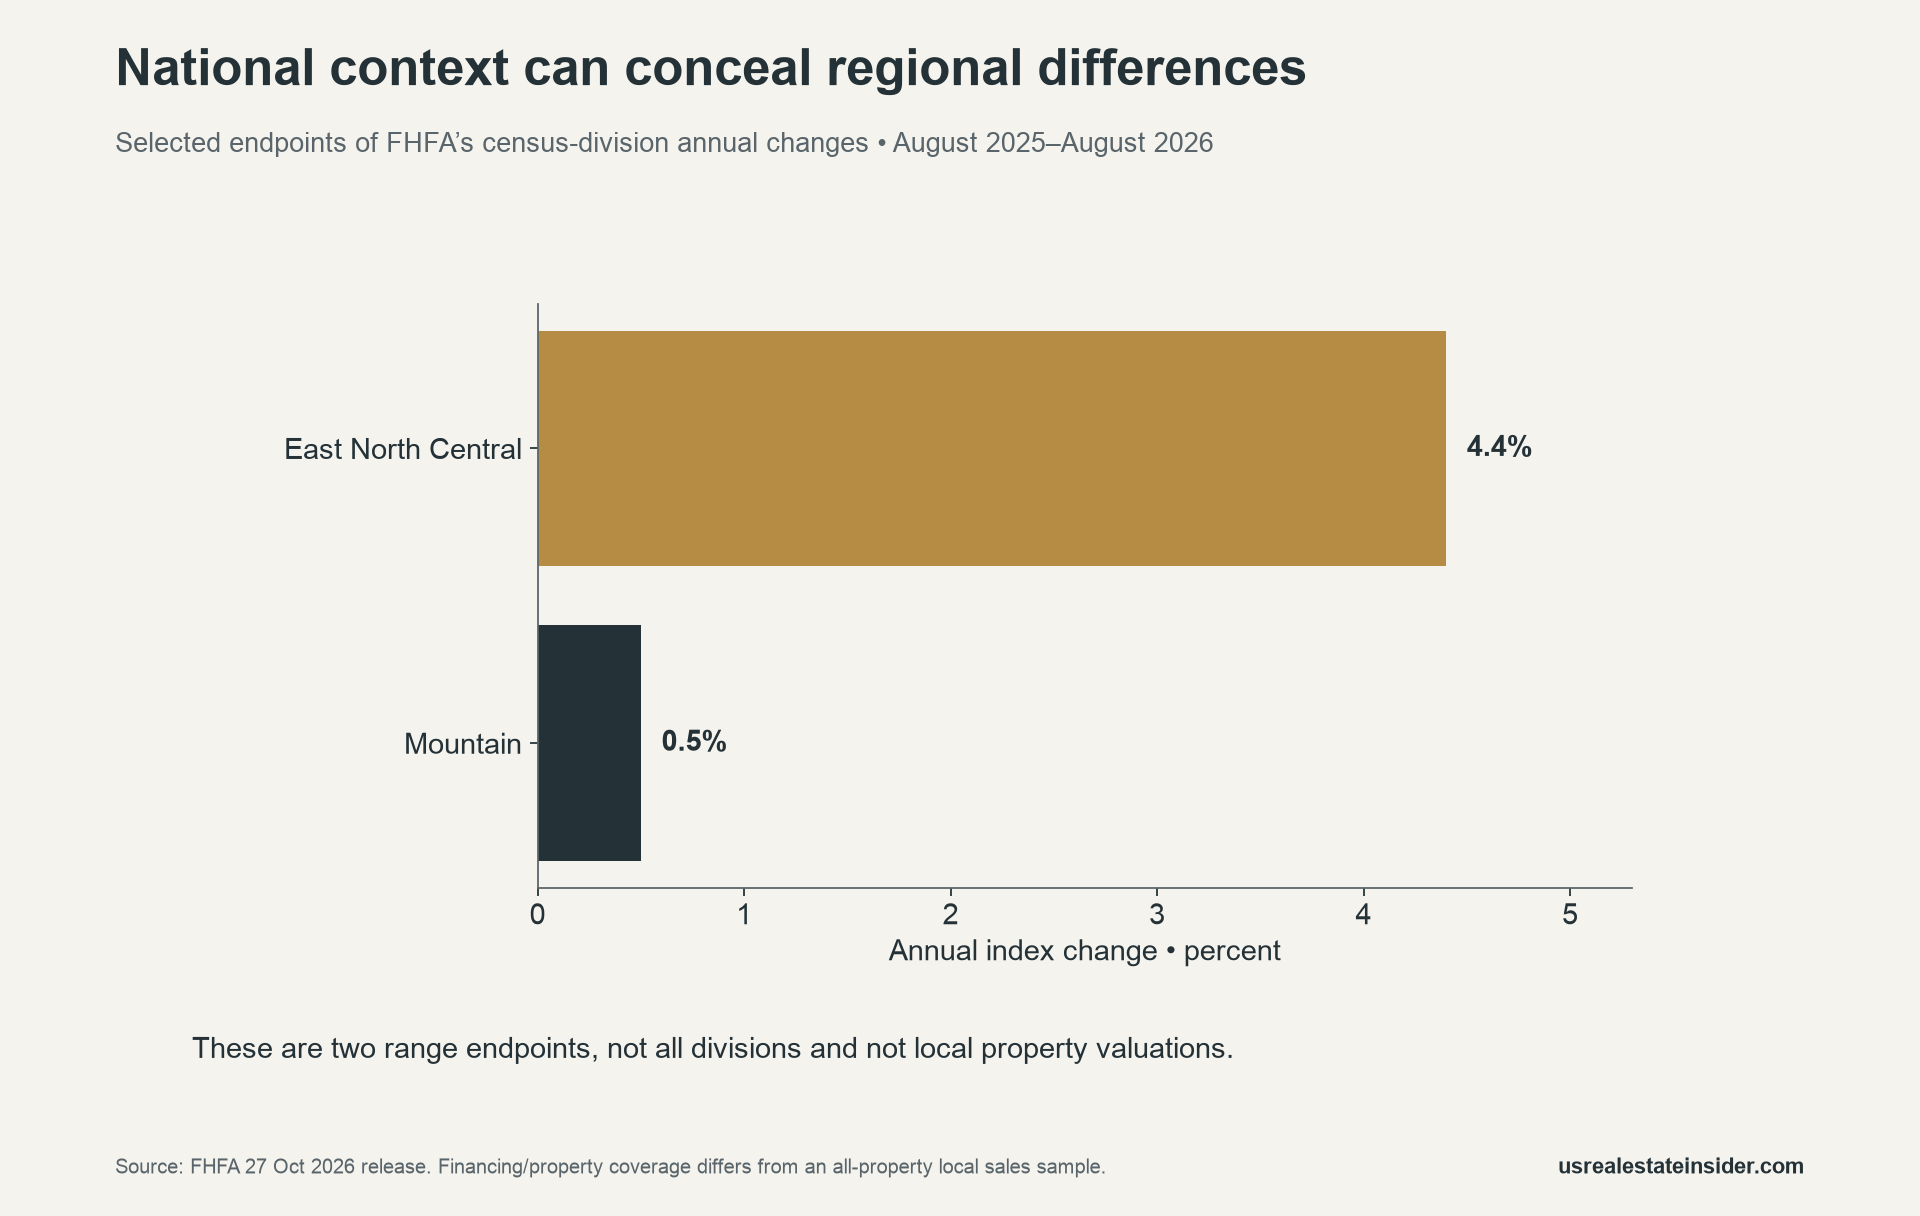
Even a relevant local series needs a coverage check. Ask whether it matches the property type, geography and transaction period you need. A broad regional change can provide context while nearby comparable sales provide different evidence about the subject property.
Reproduce a sales-mix example
Consider seven invented properties, A through G, with fixed prices of $200,000, $250,000, $300,000, $350,000, $400,000, $450,000 and $500,000. These values never change in this teaching example. Only the set of properties included in each five-sale sample changes.
Sample A includes properties A through E. Sorting their prices gives a middle observation of $300,000. Sample B includes C through G, with a middle observation of $400,000. Properties C, D and E appear in both samples at identical prices.
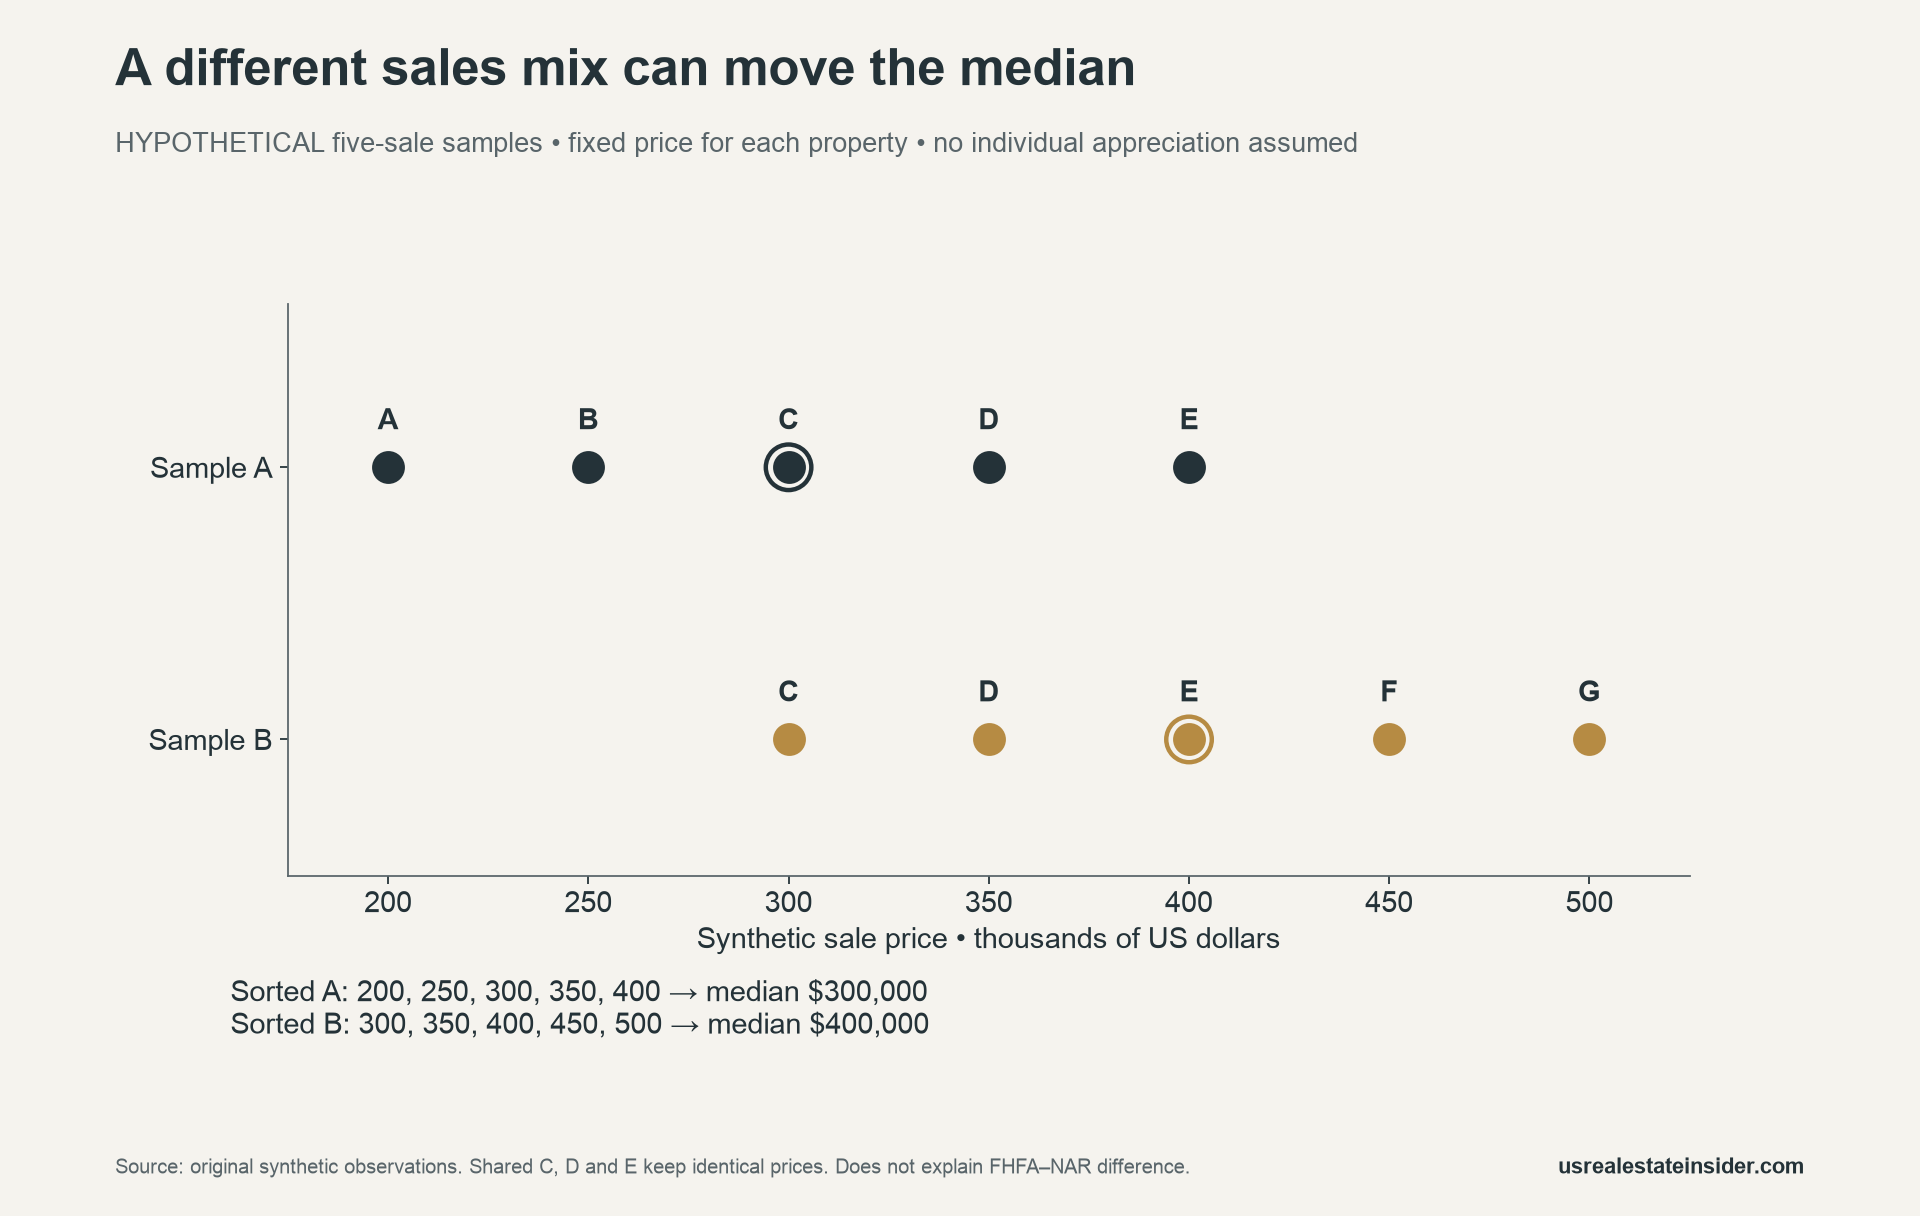
The sample median rises by $100,000, or 33.33% after rounding, even though every property’s assigned price remains fixed. This is an original demonstration of what composition can do. It is not an estimate of current appreciation or an explanation of the actual FHFA–NAR difference.
To check the arithmetic, download the synthetic observations below, sort within each sample and choose the third price. Each sample contains five rows, so no averaging of two central observations is needed. Keeping the property identifiers makes the unchanged overlapping values easy to audit.

Build a defensible comparable-sales file
Begin with the decision and the subject property. Then record candidate transactions with their sale dates, location, property type, size, condition and major features. Include the evidence source and the date you checked it. Treat an unverified condition claim as unresolved.
Next, explain why each candidate belongs in the comparison or should be excluded. A nearby sale may still differ materially in condition or transaction terms. Conversely, excluding an inconvenient price without a documented reason can bias the file. Ask an appropriate professional to assess material differences.
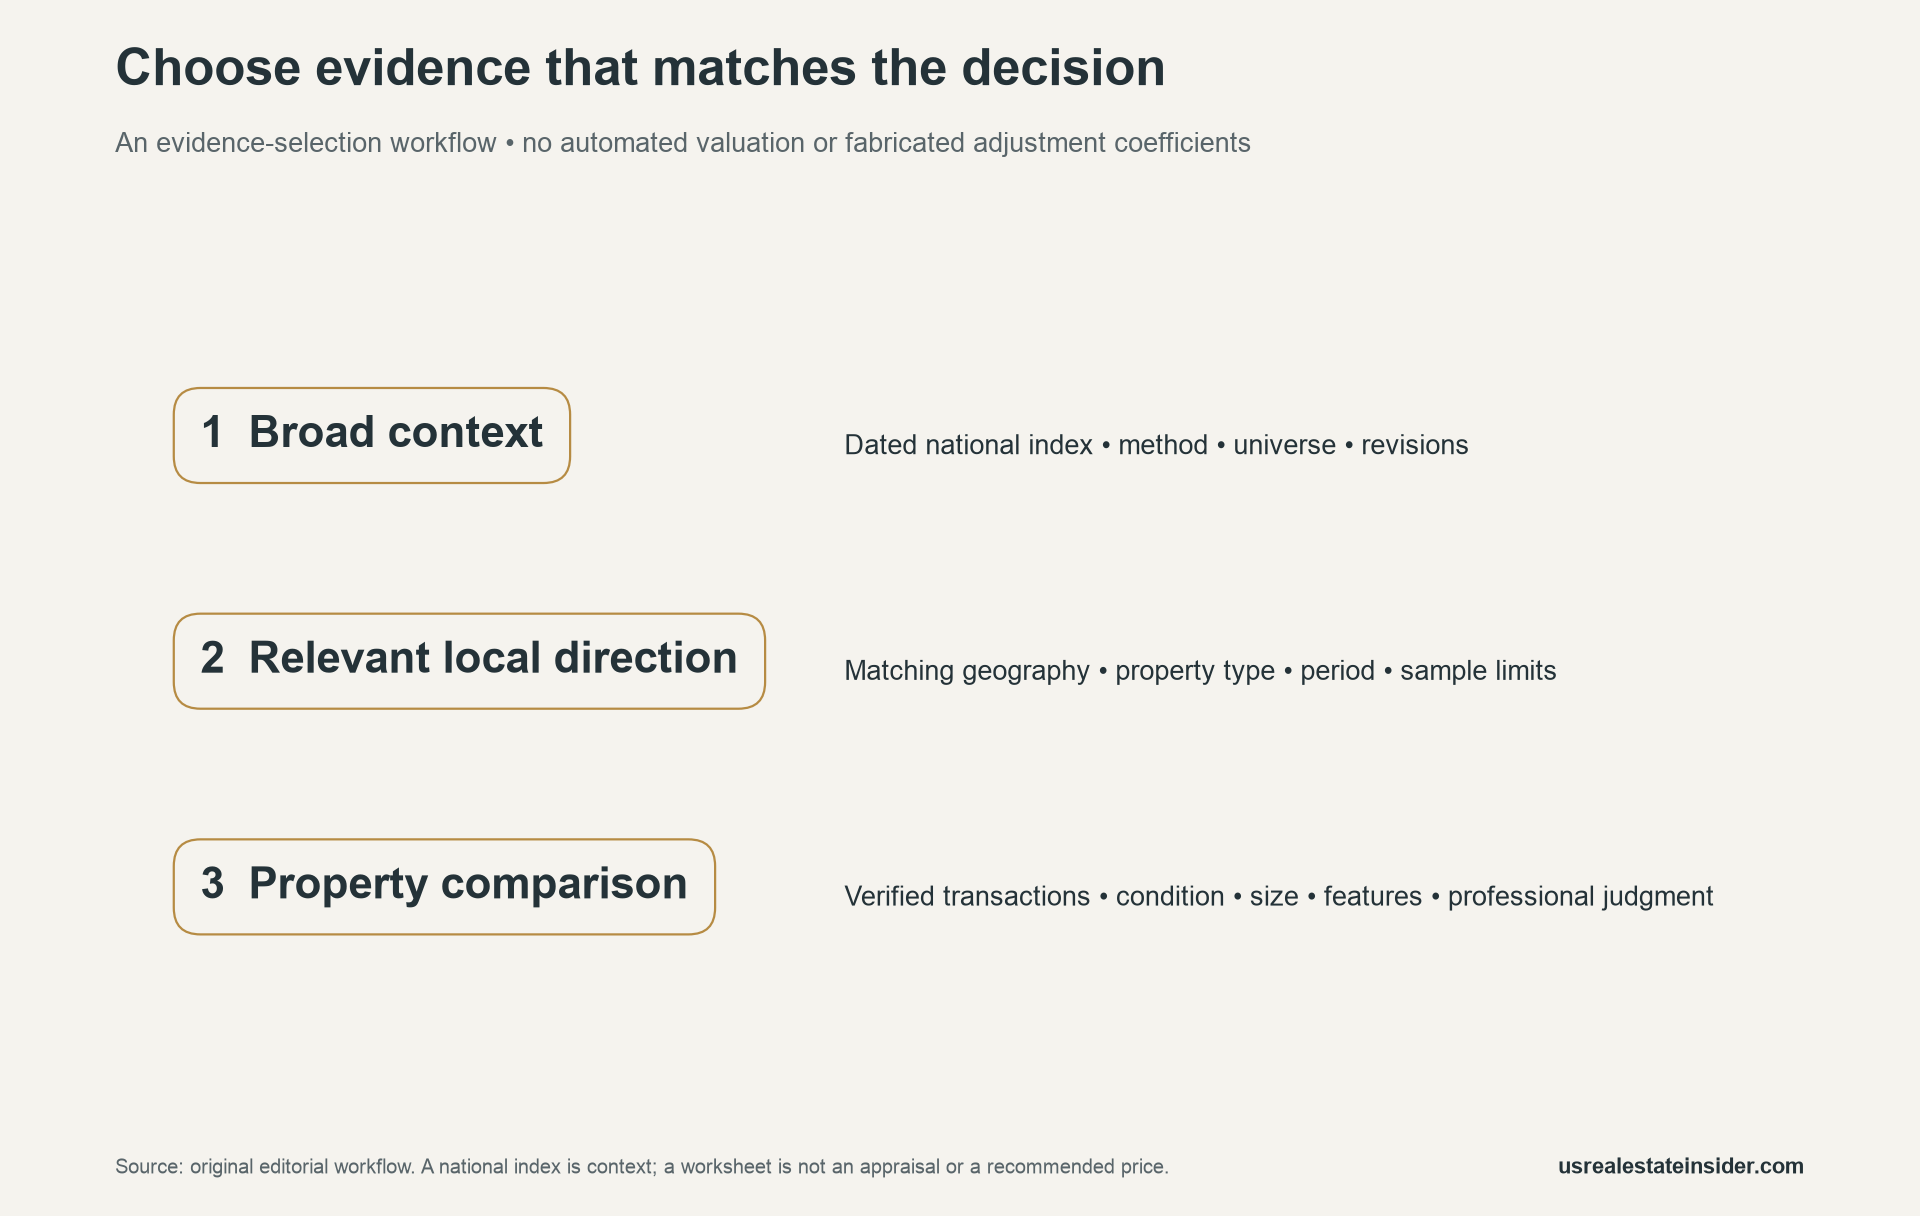
Our blank worksheet organizes those questions. It does not calculate an appraisal, invent dollar adjustments or recommend a list price. Respect access and licensing conditions when obtaining local transaction records; the worksheet does not grant access to restricted listing data.
Download the evidence tools
The dated release snapshot (CSV) records the numerical observations used here. The source-comparison matrix (CSV) separates publication dates, reference periods, coverage and revision notes.
Download the hypothetical five-sale samples (CSV) to reproduce the medians. Use the blank comparable-sales worksheet (CSV) for candidate evidence and unresolved questions. Blank entries deliberately remain blank rather than becoming assumed values.
Method, limits and related research
US Real Estate Insider retained the two primary releases and their 2 November research snapshot. Original checks confirm five rows per synthetic sample, the sorted middle observations and unchanged prices for shared identifiers. The figures separate source-reported statistics, synthetic arithmetic and an editorial workflow.
This article has no property-level valuation model and does not claim that either national series measures every U.S. transaction. Sample coverage, revisions and local conditions matter. It also does not determine a suitable price, lending value or investment return for a particular reader.
For another example of measurement boundaries, see our home-investor share analysis. Our rent comparison calculator likewise separates averages from payment schedules. Each tool answers its own question and should not substitute for property-specific evidence.
Suggested citation: US Real Estate Insider, “FHFA House Price Index vs. Median Sale Price,” 2 November 2026. Cite FHFA and NAR for their dated observations, and this article for the original synthetic example and worksheets.


