



Hottest housing markets rankings can tell you where online listings attract attention and move through the portal quickly. They do not tell you which property will deliver a suitable investment return. The useful response is a two-stage screen: understand the market signal, then investigate the actual property.
Our comparison uses two deliberately selected October observations to show why the distinction matters. It adds an original metric-to-decision map and blank evidence registers. There is no invented investment score, appreciation forecast or recommendation to buy in either location.
What the hottest housing markets ranking measures
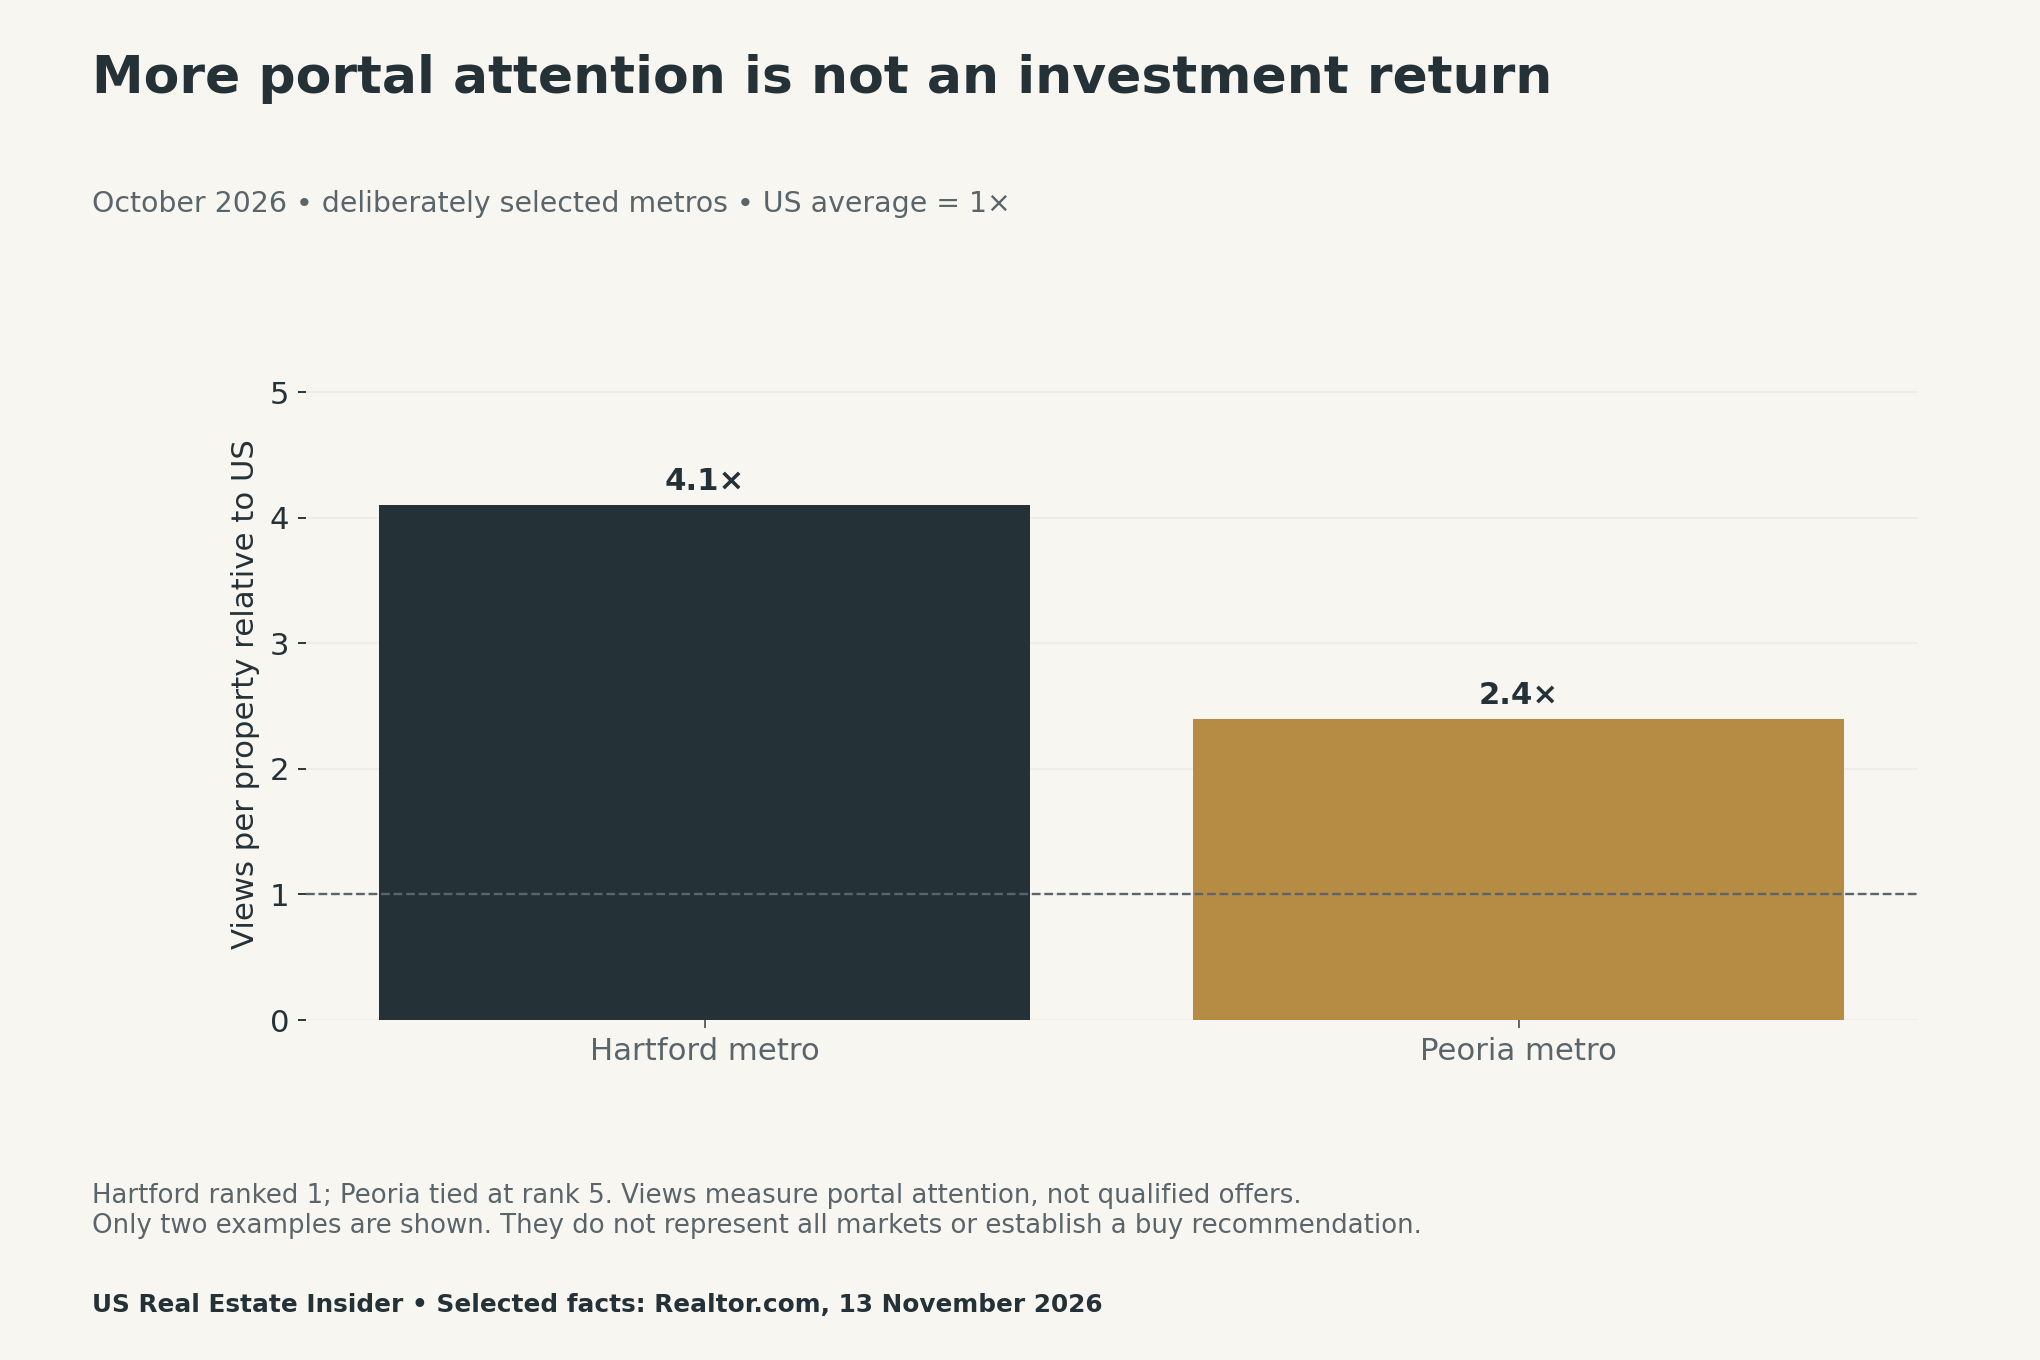
Realtor.com’s October report, published 13 November 2026, combines unique views per property with the time listings remain active on its platform. It describes attention and listing pace, rather than completed investment returns.
Hartford ranked first, with 4.1 times national views, 37 median days on market and a $440,000 median listing price. Peoria tied for fifth, with 2.4 times views, 36 days and a $180,000 median listing price. Our figures retain that tie and the October reference period.
Separate the signal from the decision
An attention measure can help choose what to investigate next. However, interest in an online listing does not establish the financial position, intent or financing of a particular viewer. A property decision still needs evidence that matches its purpose.
Likewise, a portal’s time-on-market measure is not a promise that your purchase, rental or resale will complete within a certain period. A reader who needs a deadline should investigate the actual transaction and its conditions rather than borrowing the metro median as a schedule.
| Signal | Describes | Still unanswered |
|---|---|---|
| Portal attention | Unique listing views per property | Who actually makes qualified offers |
| Listing pace | Time listings remain active | Property-specific time to a completed sale |
| Asking price | Median of listed properties | All-in cost or investment value of one property |
| Investment feasibility | Not supplied by the hotness rank | Cash flow, condition, financing and exit risk |
Compare asking prices and pace in separate units
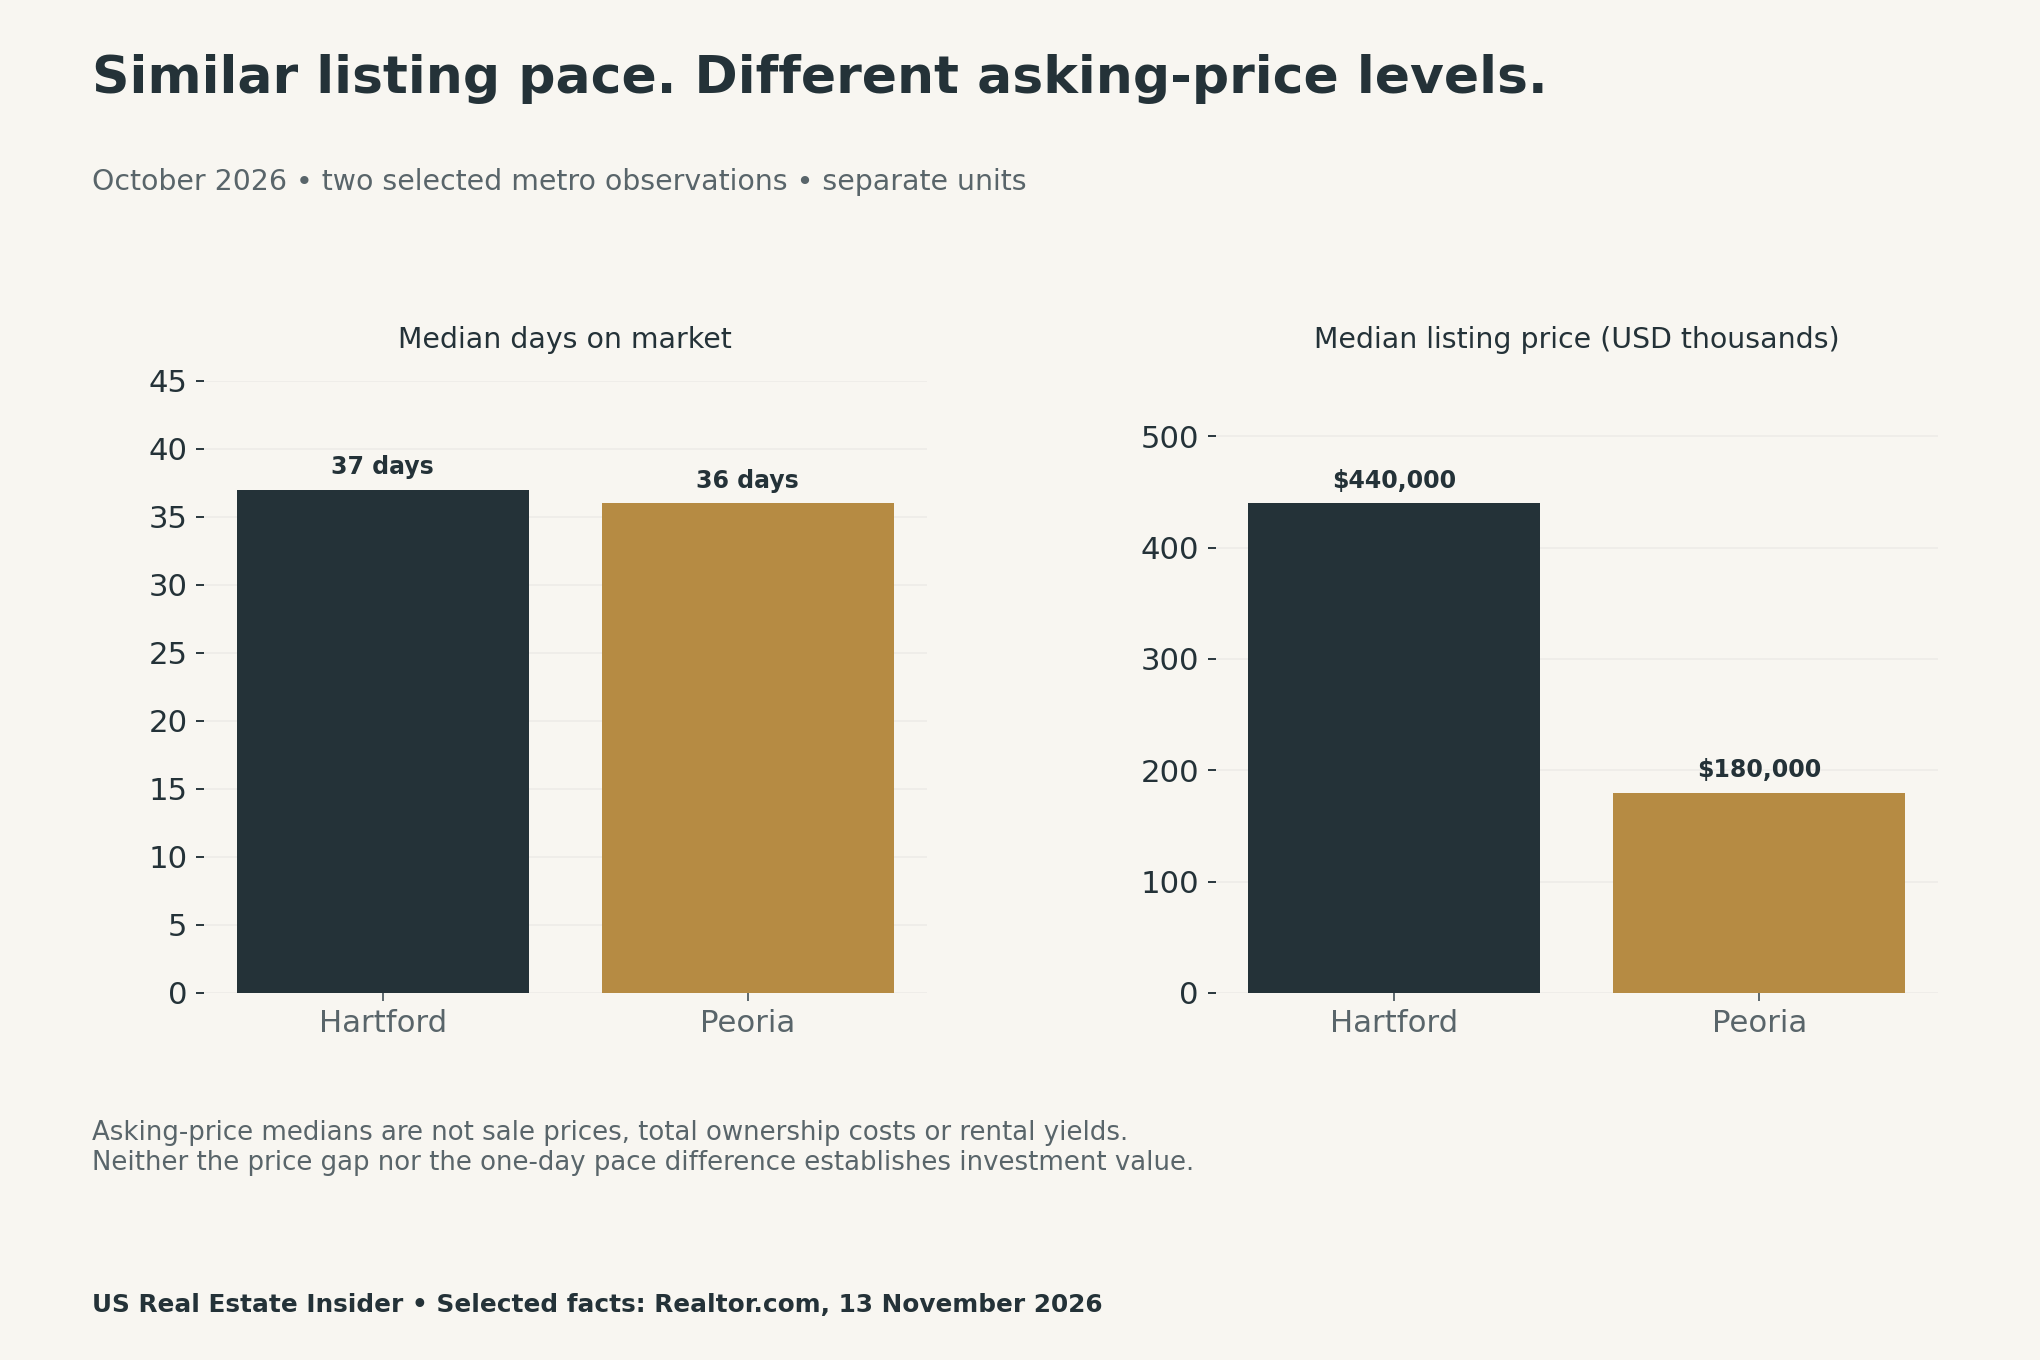
A tempting shortcut is to treat the lower asking-price median as better value. That conclusion does not follow. A lower acquisition figure could coexist with different rental income, expenses, repair needs, financing terms or exit conditions. Those inputs need their own sources.
Similarly, combining views, days and dollars into an arbitrary weighted score can hide the reader’s actual constraints. A household buying a home and an investor assessing rental cash flow may need different evidence. Our register therefore records the decision and unknowns instead of producing a universal score.
Use two separate screening stages
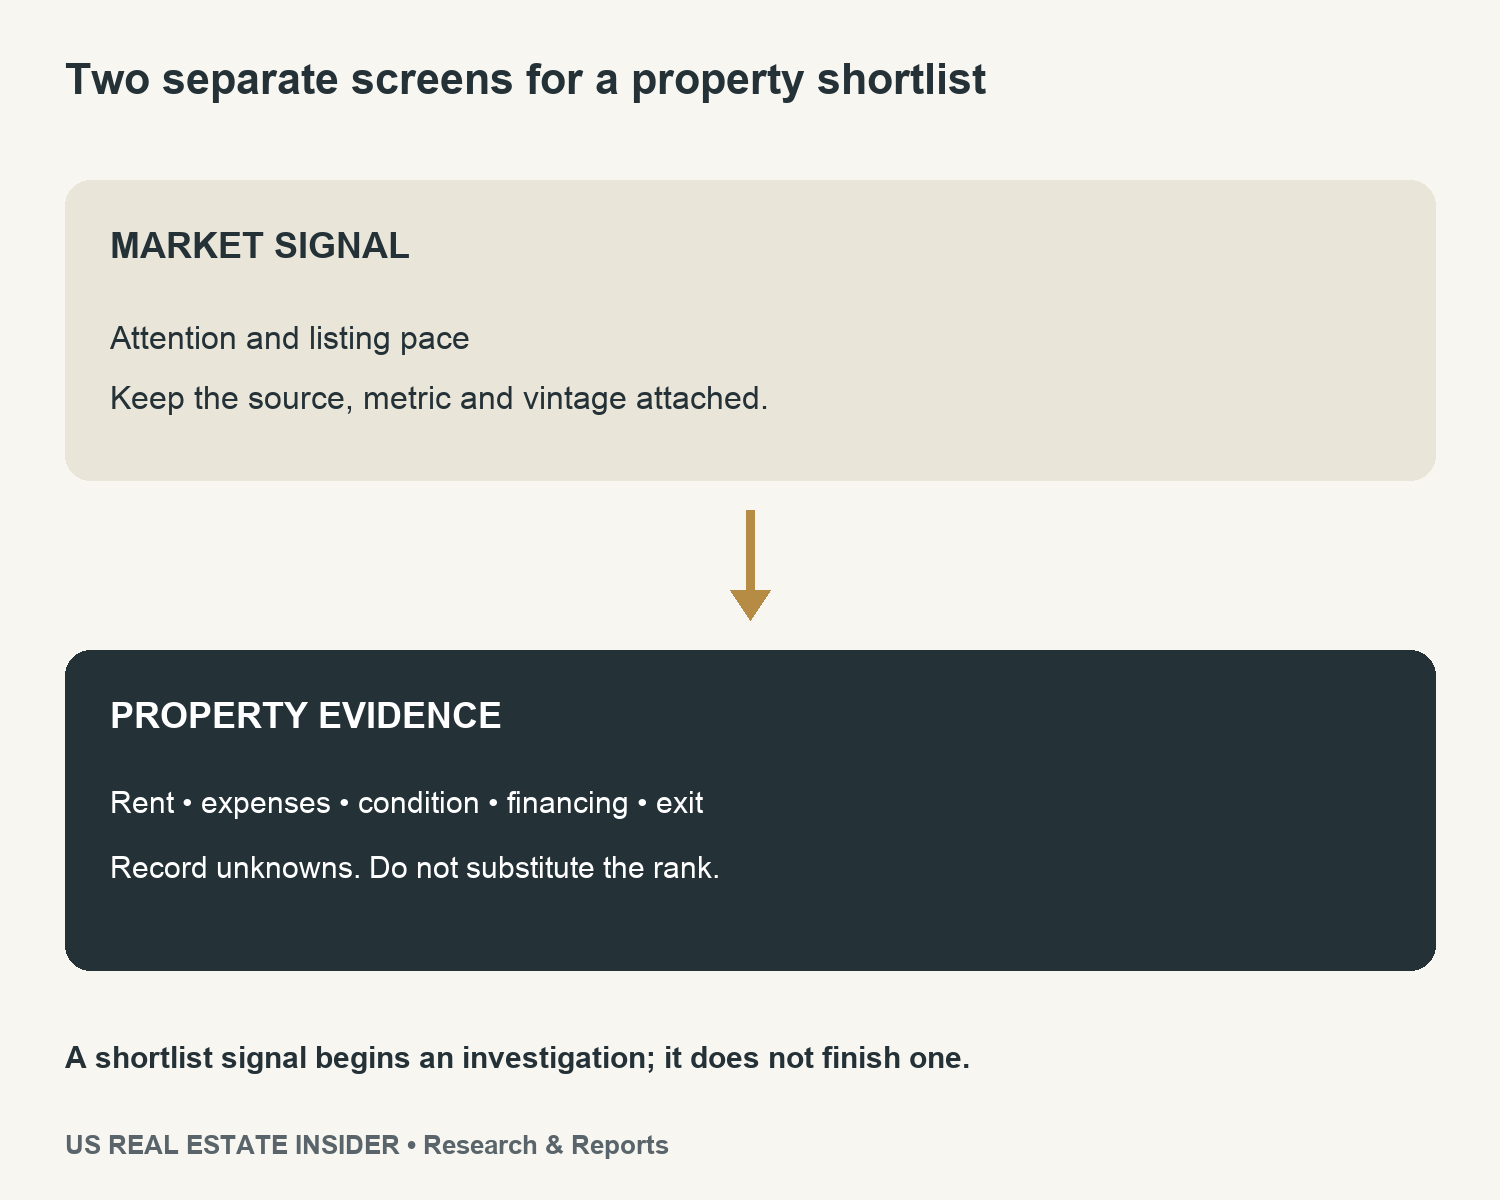
For the first screen, retain the publisher, vintage, geography and metric definition. Write why the signal deserves attention. Avoid changing its meaning as it moves from a headline into a spreadsheet, a conversation or a social post.
For the second screen, give each shortlisted property an identifier. Add the evidence needed for its intended use, the source date and whether each entry is observed or assumed. Missing data should remain visible. An attractive market rank does not fill a blank expense line.
Build the property evidence register
| Evidence topic | What to investigate |
|---|---|
| Rent | Comparable signed/asking evidence and differences |
| Operating expenses | Taxes, insurance, management, maintenance and other costs |
| Condition | Inspection findings and dated repair estimates |
| Financing | Current terms, payment scope and cash to close |
| Exit | Sale costs, comparable evidence and uncertainty |
For rent, retain the relevant comparison and explain differences in location, condition and services. Expense records should distinguish recurring operating costs from purchase costs and major work. For financing, keep quote dates and payment scope explicit. A single undated estimate is difficult to review later.
Condition deserves its own record because a broad metro statistic cannot inspect a building. Retain dated findings and estimates from suitable professionals. Keep the seller’s description separate from independent evidence, and show which questions remain unresolved.
Exit assumptions need the same discipline. Record how a sale or other exit would work, what costs it might involve and what remains uncertain. Do not let an attention ranking stand in for future resale demand or an assured price.
Maintain the shortlist without forcing a score
The blank shortlist file asks for the intended purpose, budget limit, property reference and missing evidence. Its final field records the reason to investigate or reject. This provides a reviewable decision trail without pretending that every factor belongs on a single numerical scale.
A property can leave the shortlist because essential evidence is unavailable, because it conflicts with a real constraint or because a documented assumption changes. Conversely, a market outside a popularity list may still warrant research for a particular purpose. The ranking alone settles neither case.
Download the source-linked tools
- Two selected October observations with ties, units and source (CSV)
- Hotness metric and unanswered-decision map (CSV)
- Blank property-underwriting evidence register (CSV)
- Blank market and property shortlist (CSV)
Our mortgage-availability guide offers a similar separation between a market headline and individual fit. For ongoing outgoings, use our household housing-budget comparison.
Methodology and limitations
We checked the first-party report on 15 November 2026 and selected Hartford and Peoria to illustrate distinct attention, pace and asking-price profiles. We did not reproduce the full ranking, estimate its proprietary formula or gather a representative investment sample.
Our charts redraw only those selected facts with attribution. The decision map and blank registers are editorial tools. Metro aggregates can differ from individual neighbourhoods and properties, while changes in listing mix can alter medians. No rent, yield, appreciation or completed-sale return is established here.


